1
Institutionen för datavetenskap
Department of Computer and Information Science
Final thesis
Usability Evaluation of Smart Phone
Application Store
byMuhammad Adnan
LIU-IDA/LITH-EX-A--15/008--SE2015-02-25
Linköpings universitetSE-581 83 Linköping, Sweden
Linköpings universitet 581 83 Linköping
2
Final Thesis
Usability Evaluation of Smart Phone
Application Store
by
Muhammad Adnan
LIU-IDA/LITH-EX-A--15/008--SE
2015-02-25
Supervisor: Arne Jönsson
3
Table of Contents
Chapter 1: Introduction ... 7
1.1 Background: ... 7
1.2 Problem Area: ... 7
Chapter 2: Research Methodology ... 9
2.1 Previous Research ... 10
2.2 Survey ... 10
2.2.1 Conducting Survey:... 11
2.2.2 Survey 1 ... 11
2.2.3 Survey 2 ... 11
2.3 Think aloud based experiment ... 11
Chapter 3: Previous Research ... 12
3.1 Review of previous studies ... 12
3.2 Usability issues ... 13 Chapter 4: Survey 1 ... 16 4.1 Aim ... 16 4.2 Method ... 16 4.3 Results ... 16 Chapter 5: Survey 2 ... 18
5.1 Payment for Apps: ... 18
5.2 Downloading and installation of Apps: ... 19
5.3 Uninstalling Apps: ... 20
5.4 Identifying installed Apps: ... 21
5.5 Updating Apps: ... 22
5.6 Information about Apps: ... 23
Chapter 6: Anova Analysis ... 24
6.1 One-way anova test ... 24
Chapter 7: Think-aloud based Experiment ... 27
7.1 Experiment ... 27
7.2 Environment ... 27
7.3 Selection of participants ... 27
7.4 Usability test materials ... 28
7.5 Designing tasks ... 28
4
7.7 Usability Observation scheme ... 28
7.8 Questionnaire ... 29
Chapter 8: Experiment results... 30
8.1 Tasks success rate ... 30
8.1.1 IPhone task success status ... 30
8.1.2 Android task success status ... 30
8.1.3 Time spent on Apple Store... 31
8.1.4 Time spent on Android store: ... 32
8.1.5 Number of taps on Apple Store and Android store: ... 33
8.1.6 Questionnaire Result ... 34
Chapter 9: Discussion ... 35
9.1 Results ... 35
9.2 Method ... 36
9.3 Work in wider context ... 36
Chapter 10: Conclusion ... 38
10.1 Suggestions ... 38
References ... 39
5 List of Figures
Figure 1 Research Methodology Steps ... 10
Figure 2 Comparisons of Tasks on Apple & Android ... 31
Figure 3 Comparisons of Task time (Time in Second) ... 32
Figure 4 Average No of Taps on Apple Store & Android Store ... 33
Figure 5 Pay for an App as a Gender wise ... 45
Figure 6 Pay for an App as an Age ... 45
Figure 7 Pay for an App as an Education Level ... 46
Figure 8 Pay for an App as a Smart Phone OS ... 46
Figure 9 Download & Install the App as a Gender wise ... 47
Figure 10 Download & Install the App as an Age ... 47
Figure 11 Download & Install the App as an Education Level ... 48
Figure 12 Download & Install the App as Smart Phone OS ... 48
Figure 13 Uninstall the App as a Gender wise ... 49
Figure 14 Uninstall the App as an Age ... 49
Figure 15 Uninstall the App as an Education Level ... 50
Figure 16 Uninstall the App as a Gender wise ... 50
Figure 17 Identification of Apps installed in mobile as a Gender Wise ... 51
Figure 18 Identification of Apps installed in mobile as an Age ... 51
Figure 19 Identification of Apps installed in mobile as an Education Lever ... 52
Figure 20 Identification of Apps installed in mobile as a Smart Phone OS... 52
Figure 21 Update the installed Apps as a Gender wise ... 53
Figure 22 Update the installed Apps as an Age ... 53
Figure 23 Update the installed Apps as an Gender Education Level ... 54
Figure 24 Update the installed Apps as a Smart Phone OS ... 54
Figure 25 Information about specific Apps as a Gender wise ... 55
Figure 26 Information about specific Apps as an Gender Age ... 55
Figure 27 Information about specific Apps as an Education Level ... 56
6 List of Tables
Table 1 Survey 1 Results ... 17
Table 2 Payment for apps ... 19
Table 3 Downloading and installation of apps ... 19
Table 4 Uninstalling apps ... 20
Table 5 Identifying installed apps ... 21
Table 6 Updating apps ... 22
Table 7 Information about apps ... 23
Table 8 Anova Results: P values & F values ... 24
Table 9 Question 13: F Value & P Value ... 25
Table 10 Question 14: F Value & P Value ... 25
Table 11 Question 15: F Value & P Value ... 26
Table 12 Question 17: F Value & P Value ... 26
Table 13 Selection of participants ... 27
Table 14 Task Status on Apple Store ... 30
Table 15 Task status on Android ... 30
Table 16 Task time in second on Apple store ... 31
Table 17 Task time in second on Android store ... 32
Table 18 Taps on Apple store ... 33
Table 19 Taps on Apple store ... 33
Table 20 Android Users Mean ... 34
Table 21 iPhone Users Mean ... 34
7
Chapter 1: Introduction
1.1 Background:
In the last decade, smart phones have become more powerful, productive and common in daily life [4]. Unlike the traditional use of mobile phones such as making calls, SMS and MMS, the latest technologies in the field of mobile computing have enabled us to use smart phones for many different tasks which were previously reserved for computers such as word processing, collaboration, web browsing, video chat, games, email, installation of software etc. [4, 5]. One of the most distinguishing features of smart phones as compared to the traditional mobile phones is the ability to install software (commonly known as apps). Going five or more years back, smart phone vendors were allowing users to use third-party apps or apps from any source to be installed on their phones [4, 5]. Companies such as Apple provides its users of iPhone with App Store, Microsoft provides Marketplace on Windows Phones and Google provides a playstore for Android phones. All these app stores/market places have the same common functionality of providing the user the ability to search and install apps on their phones. These features of smart phones have made them grow enormously in the last couple of years.
There are more than 600 million smart phone users worldwide in 2011[1]. In 2011, 269 million smart phones will be shipped compared to 194 million notebooks [1]. These increases in the number of smart phone users and devices as compared to computers have also caused strong growth in the number of apps available for smart phones. As of 2011, there are around 1 million smart phone apps available to users [2]. IPhone has around half million apps, android has around 400,000, blackberry has around 43,000 and windows phone has around 35,000 [2]. Although these large number of apps for different smart phones provide options but it also adds to complexity and information overload. Smart phone users have to search the app stores and market places to find the required app. Using the available tools in different smart phones to search, download and install an app is a complex process, since most of the smart phone user interfaces are difficult to use for an ordinary user [3, 6].
1.2 Problem Area:
There is usually a marketplace /app store app installed in a Smartphone which provides the services of searching, downloading, installing/uninstalling and upgrading the apps. Different smart phone operating systems have different tools for managing marketplace search and installation process and if a user switches from one OS to another then the user has to adjust the new OS marketplace installation tools.
8
In this thesis we will investigate usability issues for app stores: How to search for an app?
How to make payment for an app? How to select an app after searching? How to download an app?
How to view the downloaded and/or installed app? How to uninstall the app?
How to update the app?
Developing systems that fulfill all usability attributes of a user interface is very rare [15]. It is important that specific target values for the usability attributes are fulfilled to achieve the acceptance criteria and to what extend this criteria is implemented using iPhone, android and windows phone.
Most of the existing research has focused on improving the usability of smart phones for web browsing, communication tools, e-learning, authentication etc. We are focusing on the app store/marketplace which involves an app search, selection, download, installation, uninstallation, upgradation and feedback for each of these actions. We are focusing on the usability issues in this whole process, and attempts to answer the following research questions:
1. What are the usability issues in existing app store/market places from user point of view?
2. What is the learning curve for an ordinary user to use the app store/marketplace tools? 3. What are the effects of app store/marketplace size on usability?
9
Chapter 2: Research Methodology
This research requires a number of research methods to be used to achieve the goals and objectives. We analysed the usability aspects of app store/marketplace tools on windows , android and iPhone smart phones. Research work was conducted from the perspective of the user. Our main aim was to know: How usable is a particular tool for the user? How quickly can users learn to use the tool? Is the user satisfied with the feedback he/she gets while using the tools?
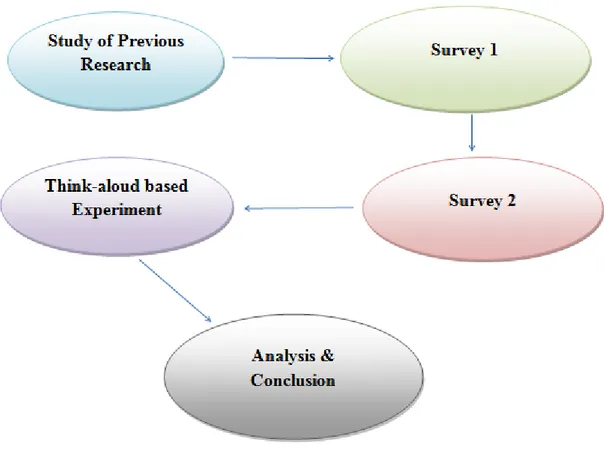
Based on our thesis requirement we have formalized our research methodology in 3-steps. In the first step, we studied the previous research and gathered information about
usability issues in smart phones and the existing solutions or guidelines for making app store/marketplace tools more usable. We compared our survey and experiment results and come up with guidelines and solutions to make the usability of app store/marketplace more usable for different kind of users.
In the second part of the research, we performed a survey by using a questionnaire to ask existing users of iPhone, Windows Phone and Android about the usability issues they face while using the app store/marketplace tools. We decided to use a survey instead of interviewing users because interviews take more time and cover a small group of users. A survey allows gathering information from a large group of users.
A quantitative approach can be used which focuses on more users and getting their feedback through surveys and questionnaires which is not very expensive and hard to conduct like a table approach in which group of users are collected in one place which is more difficult [3].
In the last step, we analysed the survey result and tried to validate it. We conducted a think aloud based experiment in which users were asked to perform marketplace related actions. We measured and recorded their performance and issues they faced during using smartphones. This allowed us to compare our experimental result against the survey result so that we only identify genuine usability issues which were identified both in the survey and the experiment. The reason for using this kind of experiment is to get usability information about different Smartphone operating systems from different perspectives, as getting information only from one source (survey) can be biased and may not reflect the general usage patterns.
10 Research Methodology Steps
Figure 1 Research Methodology Steps
2.1 Previous Research
In the first step, we studied the previous research in the area of smartphone usability. Previous research study was needed to study the problems and solutions presented by other researchers in the field of app store usability.
2.2 Survey
Usability evaluation surveys are conducted to find problems being faced by users, while using respective tools and software. On the basis of these survey results, developers try to modify the software and make it more usable and efficient for the user [12].
Surveys can be conducted in many ways while keeping some factors in mind like cost, population coverage, respondents’ reluctance in participation and accuracy of survey. Different methods produce many ways for the respondents to answer the survey. Each method has its own advantage [13]. These surveys can be conducted through several modes like
Internet surveys (online) Mailing surveys (by post) Street surveys (oral) Written questionnaires
11
Within an education campus and many more.
2.2.1 Conducting Survey:
First of all, we identified a random group of people for the survey. After that a written questionnaire (Appendix A), was distributed among the selected participants. Most of the questions were multiple choices while some were based on Yes/No answers. The questionnaire was designed to be as simple as possible, so that people with different backgrounds could easily understand it. Users were given the questionnaire to answer all the questions, and if they had any problem in understanding the questions, we were there to explain .
2.2.2 Survey 1
Survey 1 was performed on small group (10 participants), to identify any potential usability issues when using marketplace apps in different smartphone operating systems.
2.2.3 Survey 2
Survey 2 was performed on a large group (100 participants) to focus on major usability issues which were identified in Survey 1. Surveying a large sample of??????????
2.3 Think aloud based experiment
In the last step of the research, we performed a think-aloud based experiment on a group of users to perform app store based tasks. A questionnaire was used to gather supportive information from the user after performing the tasks.
12
Chapter 3: Previous Research
Initially PDA’s were having functionalities like personal directory, an appointment schedule, camera and games [4]. In 1996, Nokia launched the first PDA with full mobile phone functionality that spawned a new PDA phone, now known as Smartphone [10]. Integration of PDAs with mobile phones gave rise to the smart phone production. The manufactures started to make their products more attractive for the users by developing different applications. Initially most of the work was carried out on the hardware usability of the mobile phones with limited software applications but later keeping user interaction with computer and the applications used within it, compelled mobile phone companies to take special attention towards mobile applications.
3.1 Review of previous studies
Zhong & Michahelles have investigated the Android app store to find out whether it is a long tail or Superstar market. There findings suggested that it is a Superstar market which is dominated by hit/blockbuster apps [30]. Their findings suggested that developers should focus on optimizing apps for small screen sizes of smartphone and provide flexible pricing options. In the long term, the app markets may show different growth structure because of the effects of social networks and the way friends recommend apps to each other [30].
Petsas et. al investigates the effects of pricing and revenue on popularity of an app and the developer income. Their study indicates that 10% of the apps account for 70-90% of the downloaded apps. This result is attributed to “clustering effect”, which means that user downloads the next app from the same category [31].
Cuadrado & Dueñas discussed the factors which affects the success of an app store. Apple store follows a closed source and walled garden model while Android store follows an open source model with fewer restrictions. This leads Android store to have more diverse apps but it also causes fragmentation [32].
Song et. al discusses the user satisfaction in app stores. They conclude that user satisfaction is dependent on the discoverability of apps [33]. User satisfaction is affected by the app store coherence, user reviews and perceived sufficient quantity of apps by the user [33].
Aguilar et. al investigates deceptive and malware laden apps in Android app store. Authors have come up with a model which can flag an app which is either deceptive or malware [34]. The research shows that the model flagged 9 out 10 potentially harmful apps [34].
Hyrynsalmi et. al discusses the value creation in smart phone app stores. They studied Apple, Google and Microsoft app store eco systems [35]. Their study identified major factors which affect the value of eco system, which are lock-in, efficiency, novelty and complimentary [35]. Apple app store is closed source and has strict restrictions for submitting an app. Which has a positive effect on the quality of apps and in-turn increases user satisfaction with the app store. This also increases the novelty and value of the app store, which attracts developers and mobile users to the app eco system. On the other hand, android has a lot of malware laden apps and therefore has lesser attraction for the developers and users. Discoverability of apps also plays an important role in creating a successful app store. Making it easier for the end
13
user to discover apps through their social connections makes them feel comfortable in using the app. In some cases, most of the app downloads were triggered by social factors such as friends downloaded the same apps.
3.2 Usability issues
Usability has always been a major issue for development of mobile phones and the features availability for the users. In this regard a lot of research has been done on usability from various perspectives in different times. [16,17,18,19] Usability engineering allows developers to include usability practices in the developing process in order to avoid usability problems and collect information from its users in a more appropriate way [9]. ISO 13407 describes the way of achieving user goals through user centered design in its guide which is considered a best practice [8].
Usability is a way through which users get experience about an application. Mobile phones are playing an essential role in learning besides communication. M-learning is today’s technology via which users can benefit but success of any application is based on the usability of that application that can be suffered through several issues [11]. Such issues can be:
The design of the application which can be complex and difficult to use.
Highly developed interactive interfaces can have several confusing menus causing users to be lost while exploring the application.
Insufficiency content that the user is looking for.
Difficult design can be hard to remember that finally results in disappointment of the user to achieve the goals.
Information can be difficult to navigate through.
Information and objects used inside an application may not be structured properly. Such issues can cause the user to get frustrated, disappointed and can eventually make him decide not to use that application again [11]. For a better application, the developer should keep the issues in mind and should try to use the quality components which are as follows [11]
Learnability: how easy it is for a user to finish their tasks when they use the application for
the first time.
Efficiency: how fast they perform the task.
Memorability: how easy it is to remember the use of the interface the next time. Errors: how many errors the user made while using the application.
Satisfaction: the feeling of the user after using the interface. Did he achieve his goals?
It is good to involve the user from the start of the design phase of an application to the end phase. Using that approach a group of users can be selected and can be authorized to access each option of the application using the “think out loud” technique. It is possible sometimes
14
that this technique may be irrelevant because of different background of users with different experiences which can lead us to multiple feedback and can affect the quality of the application [3].
As the usage of smartphones have increased in the last couple of years, providing usability assistance to users of mobile phones have not improved as compared to the desktop user experience [20]. Rauch formulates suggestion for developing user assistance for mobile apps [20]. There are different usability issues on mobile platforms, for e.g. inconsistent interaction design, non-user friendly user interfaces, non-user friendly navigation design etc. [20]. Rauch suggests designing apps for the size and type of mobile display and interface for the actions which the user will perform (keep it minimalistic), develop prototypes for testing designs etc. [20].
The majority of web content is designed for desktop users, but with a growing usage of mobile users, the same content is now being accessed through mobile phones [21]. Most of the content providers are still providing the same desktop designed content to the mobile users, which is not user friendly for mobile phones [21]. Guirguis & Hassan present a Content Management System (CMS) to deliver user friendly and device adapted content to different types of mobile devices [21]. The CMS adapts to a specific mobile device in 2 ways, first it adapts to the device browser to provide optimum layout of content and navigation, and secondly it perform media adaptation by compressing the contents and providing compatible contents (e.g. video or audio) [21].
Web experience on mobile devices is poor as compared to desktop users [25]. Shrestha also performed usability evaluation of user web experience on mobile phones [6]. The author conducted an experiment in which users were asked to perform different web browsing related tasks in a laboratory environment [6]. User performance was measured during the experiment. Based on the data gathered through the experiment, the author gave suggestions on how to develop mobile friendly web pages [6]. Shrestha suggested to use clearly visible font and background colour, addition of a search function, use text instead of images, label items and give them titles, use short lists on webpages etc. [6].
There is no standard approach for the usability evaluation of mobile phone apps [22]. Qiu et al. present an approach to evaluate the usability of mobile phone camera software [22]. They classified usability into four dimensions such as control/action, learnability/memorization, perception, and evaluative feeling [22]. They conducted an experiment on a group of users to use the camera software of different mobile phones [22]. The author measured and observed the behaviour of the users and also used a questionnaire related to the four classified usability dimensions [22].
Usability is an important factor in the user acceptance of a mobile app [23]. In this research work a mobile app is developed and evaluated [23]. First, a contextual interview in which user uses the mobile app and the feedback from the user is recorded as well [23]. In the second part of the research method, a diary study is performed, in this method the user used the mobile app for a week and then the log files were used to gather data about usage of the mobile app [23].
The usability of mobile apps can be affected by different factors [24]. Tsiaousis & Giaglis performs research on the effect of environmental factors on the usability of mobile
15
websites [24]. They identified different environmental factors such as visual, auditory, social etc. [24]. A pilot study and experiment was used to measure the effects of different environmental factors on the usability of mobile websites [24]. They concluded that the lighting level, motion and presence of nearby people/objects, nearby sounds and other variables affect the usability of mobile websites for different people [24].
There is a lot of research work done on providing guidelines for mobile device but in this article the author proposes guideline with metric as well [26]. Hussain & Ferneley identified a set of guidelines from existing literature using the four steps defined by Leavitt & Shneiderman [27]. They used the Goal Question metric (GQM) approach to generate the metrics for each identified guideline [26].
Mobile app developers and operating system vendors should deploy consistent design throughout their app/website/OS [20]. Mobile friendly fonts, colours and more visual elements should be used [21, 6]. Most of the online content is designed for desktop users, which makes it difficult for the mobile user to consume it. Content should be tailored for mobile phones as well, alongside of desktop, especially in cases of audio and video content [21]. Apps and operating system should provide search functionality, which is easily discoverable [6].
16
Chapter 4: Survey 1
4.1 Aim
We conducted a survey on a small group of users to look for potential usability problems that smartphone user faces during searching, installing, uninstalling, and updating apps on the iPhone, Android and Windows Phone . This pilot study will form the basis for the later full scale survey.
4.2 Method
A group of 10 users with different age and backgrounds were selected and a questionnaire was given to them to fill out. The participants were selected randomly in local market, university and town center. This survey was conducted in May, 2012. All the questions in the questionnaire were multiple choice questions to get unambiguous answers from the participants, see Appendix A.
Selected participants belonged to the following age groups: 1. Teenagers a. Girls b. Boys 2. Adults over 21 a. Females b. Males 3. Adults over 40 a. Females b. Males
After conducting the survey, answers were grouped in the following categories based on education.
a. Basic Education b. High School/College
c. University Graduates/or higher
4.3 Results
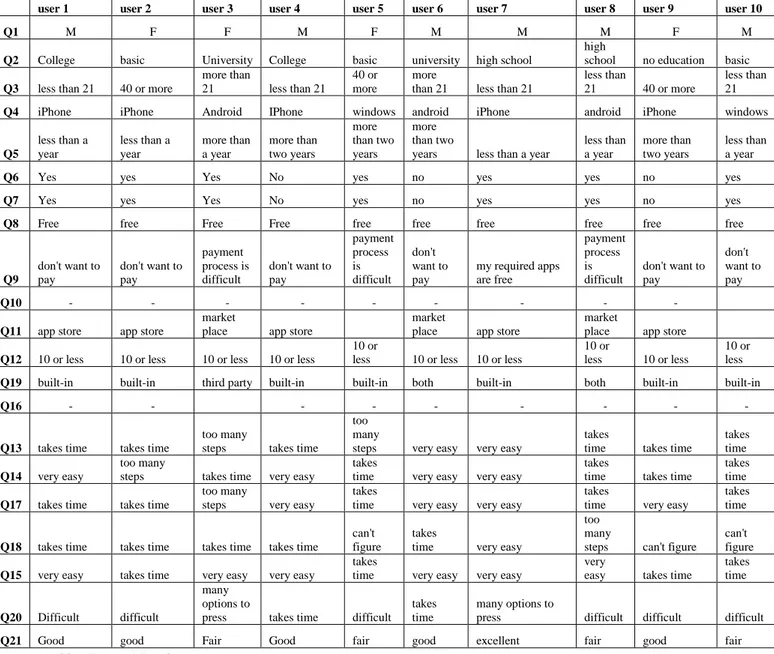
The results show that most of the users use iPhone while some used Android and Windows phone. According to the result, we found that user’s satisfaction varies from person to person on different mobile platforms. Most users prefer to install mobile applications instead of using web applications. We found different responses from users about the process of searching, installing and updating apps, some users find the process simple while others had difficulty installing and updating apps. Most of the users, who find paid apps do not want to pay because the process contains too many steps. Mostly users prefer to install and use free apps. Most of the users have installed 10 or less than 10 apps on their mobile phones.
It was evident from the survey that there are some usability issues in the process of searching, installing and updating mobile apps on different platforms. Results from the questionnaire (provided in Appendix A) are shown in the table 1. First column represents the
17
question from the questionnaire while the rest of the columns represent the answers of the 10 participants.
Table 1 Survey 1 Results
user 1 user 2 user 3 user 4 user 5 user 6 user 7 user 8 user 9 user 10
Q1 M F F M F M M M F M
Q2 College basic University College basic university high school
high
school no education basic
Q3 less than 21 40 or more
more than
21 less than 21
40 or more
more
than 21 less than 21
less than
21 40 or more
less than 21
Q4 iPhone iPhone Android IPhone windows android iPhone android iPhone windows
Q5 less than a year less than a year more than a year more than two years more than two years more than two
years less than a year
less than a year more than two years less than a year
Q6 Yes yes Yes No yes no yes yes no yes
Q7 Yes yes Yes No yes no yes yes no yes
Q8 Free free Free Free free free free free free free
Q9 don't want to pay don't want to pay payment process is difficult don't want to pay payment process is difficult don't want to pay my required apps are free payment process is difficult don't want to pay don't want to pay Q10 - - -
Q11 app store app store
market
place app store
market
place app store
market
place app store
Q12 10 or less 10 or less 10 or less 10 or less
10 or
less 10 or less 10 or less
10 or
less 10 or less
10 or less
Q19 built-in built-in third party built-in built-in both built-in both built-in built-in
Q16 - - - - - -
Q13 takes time takes time
too many
steps takes time too many
steps very easy very easy
takes
time takes time
takes time
Q14 very easy
too many
steps takes time very easy
takes
time very easy very easy
takes
time takes time
takes time
Q17 takes time takes time
too many
steps very easy
takes
time very easy very easy
takes
time very easy
takes time
Q18 takes time takes time takes time takes time
can't figure
takes
time very easy
too many
steps can't figure can't figure
Q15 very easy takes time very easy very easy
takes
time very easy very easy
very
easy takes time
takes time
Q20 Difficult difficult
many options to
press takes time difficult takes time
many options to
press difficult difficult difficult
18
Chapter 5: Survey 2
The results gathered from survey 1 provided some useful information about usability issues but these results cannot be a true representation of the whole population, therefore another survey was conducted on a larger group.
We conducted a second survey using the same questionnaire which was used in Survey 1 to get results from a larger sample of population. In this survey a total of 100 participants were recruited. Participants were selected in the same way as Survey 1, by randomly selecting people in local market, university and town centre. This survey was conducted in September, 2012. The survey was conducted in the same way as the previous survey. In the data, collected through a questionnaire, the results were mixed. In some areas such as payment of apps most of the users had difficulties where as in other areas the user satisfaction was varying across age, gender and education.
Most of the variance was visible in the following subjects:
Males
Users with university education
Users aged 21 to 40 iPhone users
5.1 Payment for Apps:
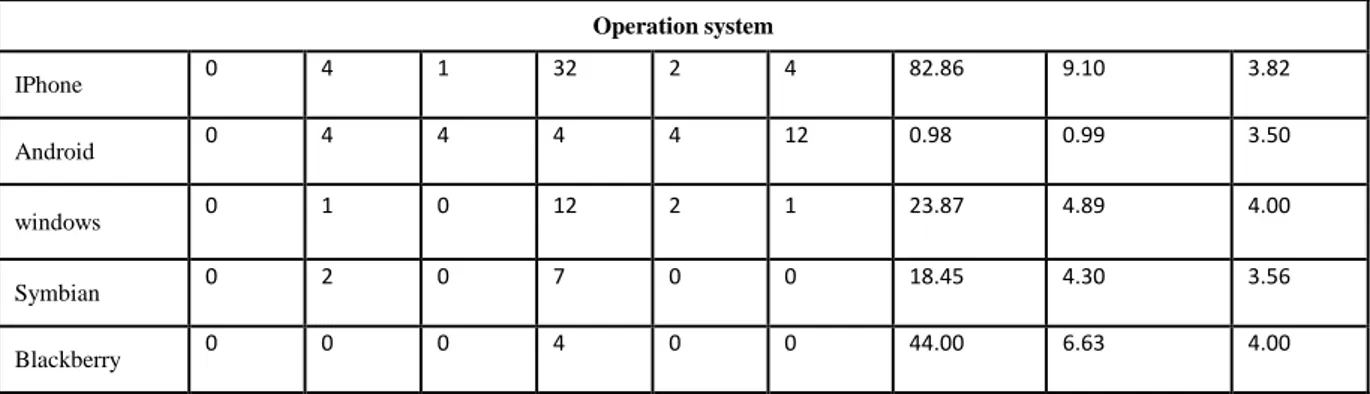
Most of the female users had difficulty in paying for apps, with a mean of 3.93, standard deviation of 5.65 and variance at 31.93. Users with college and university education had also difficulties in this area. Users aged above 40 had higher mean at 3.90, standard deviation at 6.06 and the variance at 36.78. IPhone users had more difficulty as compared to Android with mean of 3.82, standard deviation at 9.10 and variance of 82.86. Some users in the survey had never bought any apps, there answers are grouped under “Never bought” category. This category is not used in mean, variance and standard deviation calculation.
Very
East Easy neither difficult Very difficult Never bought Variance Standard deviation Mean Gender Male 0 8 3 40 2 8 100.81 10.04 3.68 Female 0 3 2 19 6 9 31.93 5.65 3.93 Age less than 21 0 2 4 16 0 2 31.66 5.63 3.64 21 -40 0 7 1 26 6 12 51.47 7.17 3.78 above 40 0 2 0 17 2 3 36.78 6.06 3.90 Education Basic 0 3 0 8 3 4 9.48 3.08 3.79 College 0 2 3 17 0 4 36.27 6.02 3.68 University 0 4 2 21 5 7 37.78 6.15 3.84 no education 0 2 0 13 0 2 31.66 5.63 3.73
19 Operation system IPhone 0 4 1 32 2 4 82.86 9.10 3.82 Android 0 4 4 4 4 12 0.98 0.99 3.50 windows 0 1 0 12 2 1 23.87 4.89 4.00 Symbian 0 2 0 7 0 0 18.45 4.30 3.56 Blackberry 0 0 0 4 0 0 44.00 6.63 4.00
Table 2 Payment for apps
5.2 Downloading and installation of Apps:
There was a lot of variance among the male users in downloading and installing apps. Male mean was 3.34 and standard deviation at 6.65, and the variance between very easy and difficulty was at 44.22. People with basic education have the most difficulty in this area with mean of 3.72 and standard deviation at 3.71. Their variance was at 13.78. Users aged less than 21 also had a high mean at 3.58. In terms of mobile phone, iPhone users had the highest variance at 53.71.
Very Easy Easy neither difficult Very
difficult Variance Standard deviation Mean Gender male 1 19 7 26 8 44.22 6.65 3.34 female 3 10 2 20 4 31.07 5.57 3.31 Age less than 21 1 4 3 12 4 12.18 3.49 3.58 21 -40 1 15 4 25 7 42.33 6.51 3.42 above 40 2 10 3 7 2 7.26 2.69 2.88 Education basic 0 2 3 11 2 13.78 3.71 3.72 college 2 6 0 14 4 19.10 4.37 3.46 university 1 9 15 7 7 15.66 3.96 3.26 no education 1 1 1 14 0 31.60 5.62 3.65 Operating system iphone 0 10 1 25 5 47.68 6.91 3.61 android 4 9 6 5 5 4.88 2.21 2.93 windows 0 6 1 8 1 9.78 3.13 3.25 symbian 0 0 1 7 0 23.00 4.80 3.88 blackberry 0 4 0 0 0 15.00 3.87 2.00
20 5.3 Uninstalling Apps:
In gender category, male users have a lot of variance and deviation in uninstalling apps. Variance was at 32.52 while mean at 3.33 and standard deviation at 5.70. People aged 21 to 40 had a lot of variance between ease and difficulty in uninstalling apps with a variance at 28.51. Users with university education had the most variance in this area with variance at 13.79, followed by users with college education at 12.67. Blackberry users had variance of 21.75 followed by iPhone users at 19.52.
Very
Easy Easy Neither difficult
Very difficult Variance Standard deviation Mean Gender male 2 14 16 20 9 32.52 5.70 3.33 female 3 11 4 14 7 16.65 4.08 3.28 Age less than 21 1 2 4 9 8 8.56 2.93 3.88 21 -40 1 16 9 19 7 28.51 5.34 3.29 above 40 3 6 7 6 2 4.64 2.15 2.92 Education basic 0 4 5 7 2 4.55 2.13 3.39 college 2 5 5 12 2 12.67 3.56 3.27 university 1 14 7 10 7 13.79 3.71 3.21 no education 2 2 1 7 5 4.90 2.21 3.65 Operating system iphone 2 10 11 15 5 19.52 4.42 3.26 android 2 4 8 7 7 6.32 2.51 3.46 windows 0 5 1 6 4 3.83 1.96 3.56 symbian 0 3 1 5 0 9.98 3.16 3.22 blackberry 0 2 0 2 0 21.75 4.66 3.00
21 5.4 Identifying installed Apps:
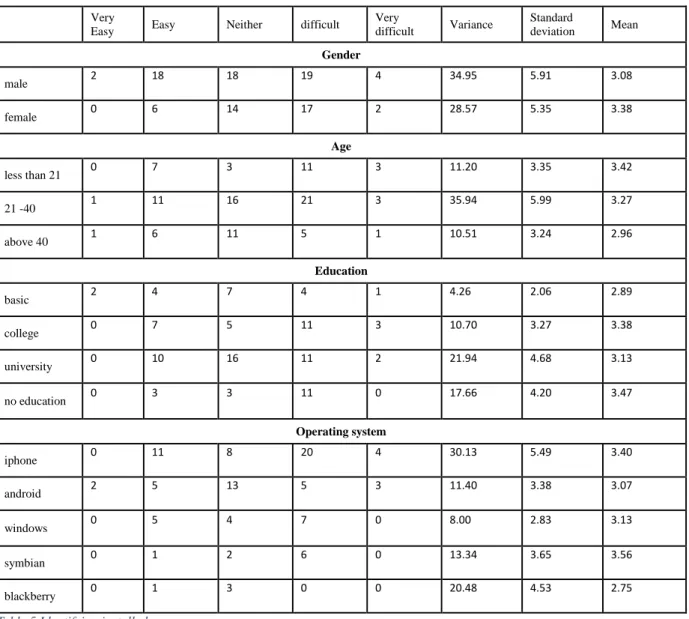
Identifying installed apps in this context meant to locate or to be able to know which apps are already installed in the smart phone through the app store. Male users had more variance in identifying installed apps as compared to females with a variance of 34.95 compared to female’s variance of 28.57. People aged 21 to 40 has the most variance in ease and difficulty with a variance at 35.94. Users with university education have the highest variance at 21.94. Their mean was 3.13 and standard deviation at 4.68. IPhone users had the most variance at 30.13, followed by Blackberry at 20.48.
Very
Easy Easy Neither difficult
Very difficult Variance Standard deviation Mean Gender male 2 18 18 19 4 34.95 5.91 3.08 female 0 6 14 17 2 28.57 5.35 3.38 Age less than 21 0 7 3 11 3 11.20 3.35 3.42 21 -40 1 11 16 21 3 35.94 5.99 3.27 above 40 1 6 11 5 1 10.51 3.24 2.96 Education basic 2 4 7 4 1 4.26 2.06 2.89 college 0 7 5 11 3 10.70 3.27 3.38 university 0 10 16 11 2 21.94 4.68 3.13 no education 0 3 3 11 0 17.66 4.20 3.47 Operating system iphone 0 11 8 20 4 30.13 5.49 3.40 android 2 5 13 5 3 11.40 3.38 3.07 windows 0 5 4 7 0 8.00 2.83 3.13 symbian 0 1 2 6 0 13.34 3.65 3.56 blackberry 0 1 3 0 0 20.48 4.53 2.75
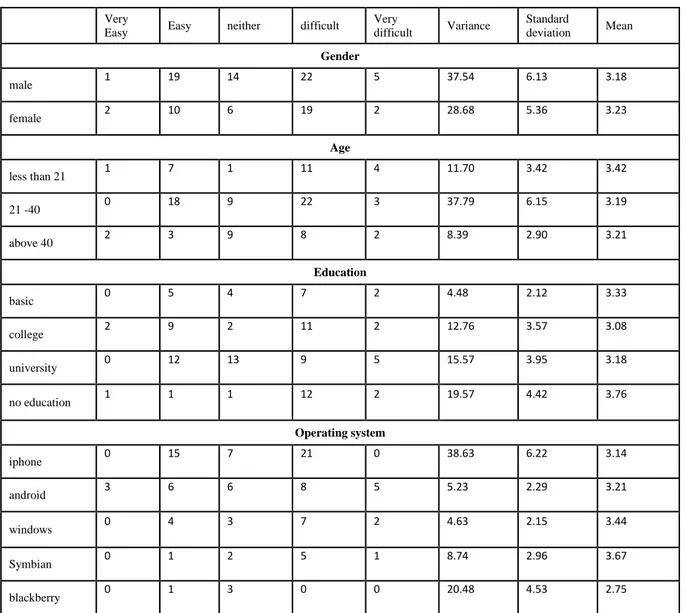
22 5.5 Updating Apps:
Male users had high variance of 37.54 as compared to 26.68 of female users. People aged 21 to 40 had the most variance with 37.79. Users with no education, university
education and college education had high variance of 19.57, 15.57 and 12.76 respectively. IPhone users had the highest variance of 38.63 which was very high compared to the second high of Blackberry at 20.48.
Very
Easy Easy neither difficult
Very difficult Variance Standard deviation Mean Gender male 1 19 14 22 5 37.54 6.13 3.18 female 2 10 6 19 2 28.68 5.36 3.23 Age less than 21 1 7 1 11 4 11.70 3.42 3.42 21 -40 0 18 9 22 3 37.79 6.15 3.19 above 40 2 3 9 8 2 8.39 2.90 3.21 Education basic 0 5 4 7 2 4.48 2.12 3.33 college 2 9 2 11 2 12.76 3.57 3.08 university 0 12 13 9 5 15.57 3.95 3.18 no education 1 1 1 12 2 19.57 4.42 3.76 Operating system iphone 0 15 7 21 0 38.63 6.22 3.14 android 3 6 6 8 5 5.23 2.29 3.21 windows 0 4 3 7 2 4.63 2.15 3.44 Symbian 0 1 2 5 1 8.74 2.96 3.67 blackberry 0 1 3 0 0 20.48 4.53 2.75
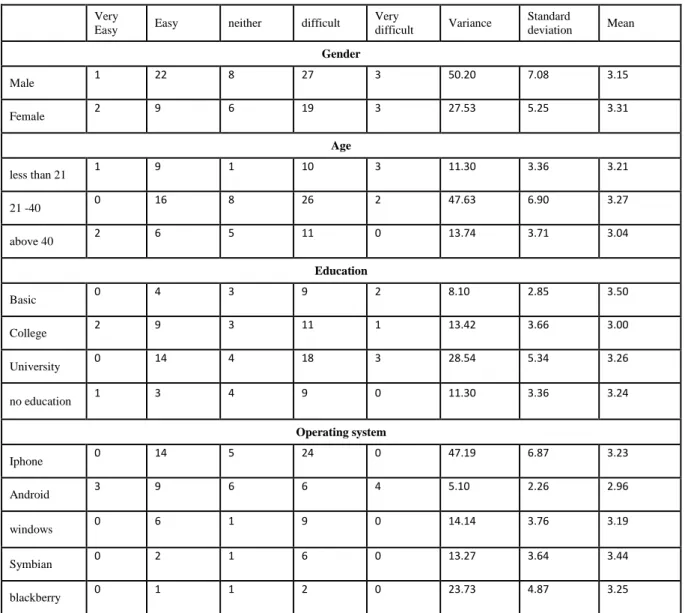
23 5.6 Information about Apps:
Male users had a high variance of 50.20 as compared to 27.53 of female users. People aged 21 to 40 had the most variance with 47.63. Users with university education and college education have variance of 28.54 and 13.42 respectively. IPhone has the most variance with 47.19 followed by Blackberry users with 23.73
Very
Easy Easy neither difficult
Very difficult Variance Standard deviation Mean Gender Male 1 22 8 27 3 50.20 7.08 3.15 Female 2 9 6 19 3 27.53 5.25 3.31 Age less than 21 1 9 1 10 3 11.30 3.36 3.21 21 -40 0 16 8 26 2 47.63 6.90 3.27 above 40 2 6 5 11 0 13.74 3.71 3.04 Education Basic 0 4 3 9 2 8.10 2.85 3.50 College 2 9 3 11 1 13.42 3.66 3.00 University 0 14 4 18 3 28.54 5.34 3.26 no education 1 3 4 9 0 11.30 3.36 3.24 Operating system Iphone 0 14 5 24 0 47.19 6.87 3.23 Android 3 9 6 6 4 5.10 2.26 2.96 windows 0 6 1 9 0 14.14 3.76 3.19 Symbian 0 2 1 6 0 13.27 3.64 3.44 blackberry 0 1 1 2 0 23.73 4.87 3.25
24
Chapter 6: Anova Analysis
6.1 One-way anova test
One-way anova test was used to determine the significant difference between the means of different independent groups. It can also be used for unequal sample sizes. The null hypothesis tested was:
Where ‘µ’ shows group mean and ‘k’ the number of groups.
In order to know the significant difference between the usability of Apple app store and Android store, we used P-value. The P-value less than 0.05 shows a significant difference between the different groups whereas the P-value greater than 0.05 shows that there is no significant difference between the groups.
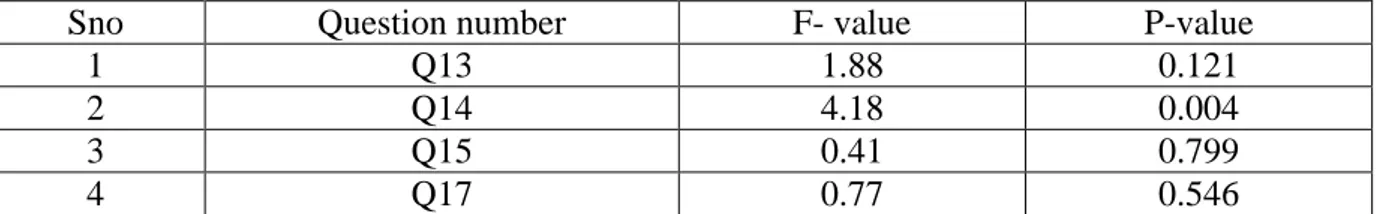
We analysed some questions with the help of one-way anova test. Calculated p-values are
Sno Question number F- value P-value
1 Q13 1.88 0.121
2 Q14 4.18 0.004
3 Q15 0.41 0.799
4 Q17 0.77 0.546
Table 8 Anova Results: P values & F values
The calculations and box plot graph of the groups are shown in appendix F.
In Q13, Q15 and Q17 the p-value calculated is greater than 0.05 which clearly indicates the insignificant difference between the analysed groups whereas Q14 p-value is less than 0.05 which indicates a significant difference between the groups. In order to find significant differences more in detail we performed the post hoc analysis for each question between the samples.
Scale used to find the difficulty level is:
1=very easy 2=easy 3=neither easy nor difficult 4=difficult 5=very difficult
25
Question 13: How easy it is find an app in marketplace/appstore?
If we look at the box plot of Q13 more deeply then we come to know that as a whole though there is no significant difference but there is a significant differece between the blackberry and other four operating systems. The graph shows that for the blackberry operating it is much easier to find an app compared to the other four. Whereas, there is no much difference among the other four operating system, the difficulty level is almost the same i.e scale 3, neither difficult nor easy.
Sno Question number F- value P-value
1 Q13 1.88 0.121
Table 9 Question 13: F Value & P Value
Post hoc analysis:
In order to find the significant difference we also did the post hoc analysis. In post hoc analysis we use the Bonferroni correction method to avoid making errors while doing multiple comparisons. It is considered the simplest method to control error rate. In this method we divided the threshold value which was 0.05 by the number of comparisons which is five in our case and got a new threshold value which is 0.01. Then we compared the two tailed data value with the new threshold value 0.01 to find if it is less than threshold value. In Q13 after post hoc analysis we got one significant difference between symbian operating system and blackberry where two tailed data value i.e 0.0097 is less than the threshold value which clearly indicated that to find an app in symbian app store is more difficult than black berry.
All figures of anova and post hoc analysis between samples are shown in appendix F.
Question 14: How easy it is download/install the app?
The box plot of q14 shows significant difference as a whole among the groups though the difference between android and windows is not significant. The analysis indicates that the difficulty level in Symbian is much greater compared to the other four operating systems i.e scale 4 (4=difficult). Android and windows operating system have almost the same difficulty level which is just below the scale (3=normal), whereas it is easy to install an app in blackberry.
Anova analysis result:
Sno Question number F- value P-value
1 Q14 4.18 0.004
26 Post hoc analysis:
In Q14 after doing post hoc analysis we found two significant differences between the samples. First difference was between iphone and blackberry where two tailed data value was less than threshold value (0.001 < 0.01) and the other difference was between symbian and blackberry where the two tailed value was much more less than threshold value (0.00000014 < 0.01). From the result it is illustrated that to install an app from the iphone and symbian app store is much more difficult than the blackberry.
Question 15: How easy it is to uninstall an app?
In Q15 there is no significant difference among the groups. All groups share almost the same difficulty level i.e scale 3 (3=normal) some fall between the 3 and 4 scale whereas blacberry is below scale 3. So as a whole it is neither easy nor difficult to uninstall an app in all 5 different operating systems.
Anova analysis result:
Sno Question number F- value P-value
1 Q15 0.41 0.799
Table 11 Question 15: F Value & P Value
Post hoc analysis:
In Q15 after anova and post hoc it is cleared that there is no significant difference and the it was neither easy nor difficult to uninstall an app in any of the operating systems.
Question 17: How easy it is to update an app?
Ananalysis of Q17 shows no significant difference among the operating systems. The difficulty level is normal i.e scale 3. That cleary shows that thought updating an app in all operating systems is neither easy nor difficult.
Anova analysis result:
Sno Question number F- value P-value
1 Q17 0.77 0.546
Table 12 Question 17: F Value & P Value
Post hoc analysis:
In Q17 after anova and post hoc analysis it is cleared that there is no significant difference and it is neither easy nor difficult update an app in any of the operating systems.
27
Chapter 7: Think-aloud based Experiment
7.1 Experiment
In order to capture more information about the usability issues which are faced by the users when using app stores/market place apps, a think aloud based experiment was conducted. In the experiment, participants were asked to perform different tasks in app store and the participant performs the task while thinking aloud. All this activity was recorded and after the experiment the participant were provided a questionnaire to answer questions regarding the different tasks to gather supporting data. Think aloud based experiments allowed us to more precisely identify usability issues which were not easy to discover through surveys. In the think-aloud based experiment, it was decided to focus on iPhone and Android app store/market places. Since most of the users, who took part in the surveys had iPhone and Android phones.
7.2 Environment
Usability labs were used to conduct the experiment and these labs are equipped with some special tools in an isolated environment. An isolated environment was used and all participants performed usability tests without interruption in order to take accurate results from the observations.
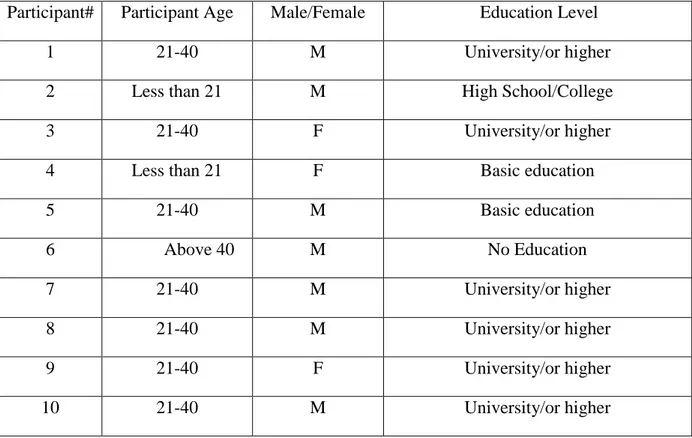
7.3 Selection of participants
User selection was very important for performing usability experiment. For this purpose, 10 participants were selected who had little to no experience with the apple store and android store.
Participant# Participant Age Male/Female Education Level
1 21-40 M University/or higher
2 Less than 21 M High School/College
3 21-40 F University/or higher
4 Less than 21 F Basic education
5 21-40 M Basic education 6 Above 40 M No Education 7 21-40 M University/or higher 8 21-40 M University/or higher 9 21-40 F University/or higher 10 21-40 M University/or higher
28 7.4 Usability test materials
Usability materials are required to successfully conduct the experiment. The experiment leader had prepared and collected all usability material for conducting the experiment. The material were the following:
iPhone 4 (iOS 4)
Samsung Galaxy 2 (Android 4.0.4, Ice cream sandwich)
Test scripts to inform the participant about the usability test
Webcam to capture the participant fingers movement on the smartphone screen
Microphone to record the voice of the participant
Usability data collection sheet to note down the task status and time.
7.5 Designing tasks
The experiment leader had designed all the tasks based on issues identified in the surveys. A brief introduction about the purpose of this experiment was given to the participants. Participants were given tasks to perform in a limited time, based on the time taken by an expert user to complete the task. All the tasks were explained to the users and during the experiment no help will be provided to the participant in completing the tasks.
7.6 Tasks
Task 1 (Time Limit: 3 minutes)
Four apps were provided to the users that they have to search in the app store (Apple store & Android) within the given time.
Task 2 (Time Limit: 3 minutes)
Now users had to install the searched apps within the given period of time.
Task 3 (Time Limit: 3 minutes)
Now users had to uninstall the installed apps within the given time.
Task 4 (Time Limit: 3 minutes)
Users were now provided with paid apps to install in order to know the difficulty during the process.
7.7 Usability Observation scheme
Jakob Nielsen´s usability criteria [29] was used for this experiment to evaluate the usability in app stores. Objective data are collected for the occurrences of events and subjective data are collected from the participant’s expressions while performing the tasks.
Throughout the test an observer was monitoring the participant while performing the tasks. He/She would note down the time, task completion status and comments given by the candidates. The following data will be gathered in data sheets:
29
Task completion and incompletion status How much time spent on task
Number of taps which represent action to perform task Subjective data expression of participants.
The usability was measured in terms of number of taps performed and time taken by the user as compared to actually how many taps are required to perform a particular task in a particular time. A user who has not used Apple/Android app store before may take more taps and time to complete a task. The extra taps and time was considered as the difficulty level/learning curve for that particular app store.
Furthermore, the Apple store and Android store were observed for further information which are the following:
How easily the participant understand the task
How comfortable the participant is in adopting a new environment (operating system), in case he/she is new to iPhone or android.
Does the participant find it easy to perform different steps in order to complete the task?
In general, the functionally in the App stores must be easy to locate and understand, if the user spends extra time and taps, this means the user was looking around to find the required functionality. This also means the App Store UI is not easy to read for novice users.
7.8 Questionnaire
A questionnaire was distributed to collect subjective data (feedback) from participants after the experiment. The questionnaire consisted of 25 questions which are designed according to a Likert scale close ended questions. The questionnaire tries to gather data about usability attributes (identified by Jakob Nielsen) which are listed below:
1. Efficiency 2. Learnability 3. Memorability 4. Errors
5. Satisfaction
30
Chapter 8: Experiment results
Results from the think aloud based experiment is presented in this chapter.
8.1 Tasks success rate
Four different tasks were designed to cover the usability of app stores. 10 candidates performed the tasks. Task success rate were calculated using the following formula:
100 * how many user complete the task Success rate in percentage = ---
Total number of user
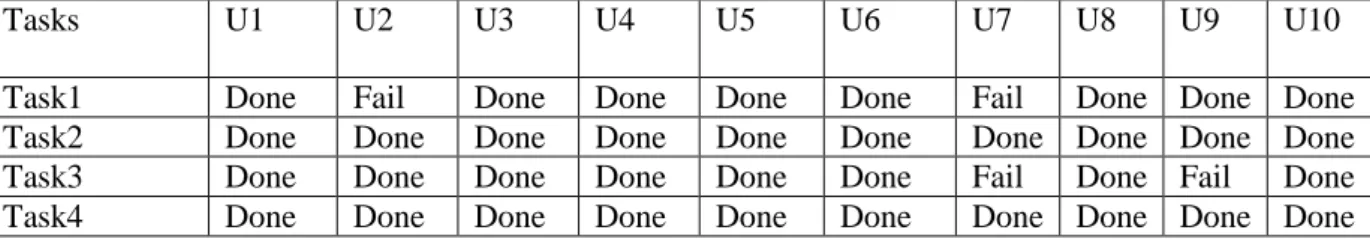
8.1.1 IPhone task success status
In the experiment, out of total 40 tasks, the participants had 37 completed tasks and 3 failed tasks. The following table represents the status of tasks for each participant.
Tasks U1 U2 U3 U4 U5 U6 U7 U8 U9 U10
Task1 Done Done Fail Done Done Done Done Fail Done Done Task2 Done Done Done Done Done Done Done Done Done Done Task3 Done Done Done Done Done Done Done Done Done Fail Task4 Done Done Done Done Done Done Done Done Done Done
Table 14 Task Status on Apple Store
8.1.2 Android task success status
In the experiment, out of total 40 tasks, participants had 36 completed tasks and 4 failed tasks. The following table represents the status of tasks for each participant.
Tasks U1 U2 U3 U4 U5 U6 U7 U8 U9 U10
Task1 Done Fail Done Done Done Done Fail Done Done Done Task2 Done Done Done Done Done Done Done Done Done Done Task3 Done Done Done Done Done Done Fail Done Fail Done Task4 Done Done Done Done Done Done Done Done Done Done
31
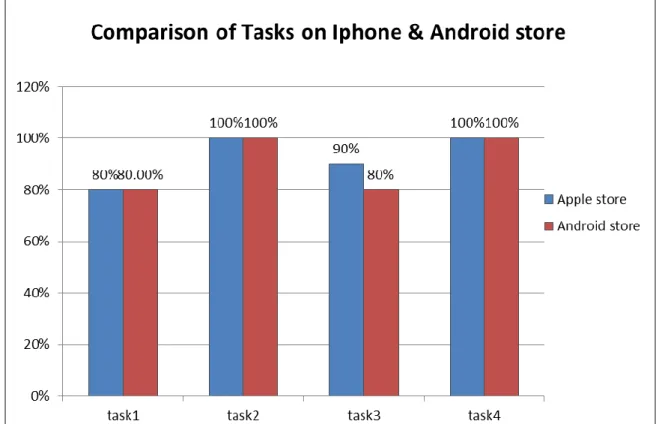
Figure 2 Comparisons of Tasks on Apple & Android
The above figure shows the tasks success rate comparison by participants using apple store on iPhone and Android store on Samsung Galaxy 5. Task 2 and Task 4 were successfully completed in both app stores. Task 1 was completed 80% in both app stores. Task 3 was completed 90% in iPhone app store while it was completed 80% on Android store.
8.1.3 Time spent on Apple Store
We noted the total time spent in the Apple store which was 119 minutes and 9 seconds. The detailed description of time on each task show in below table:
Task U1 U2 U3 U4 U5 U6 U7 U8 U9 U10 Total time Min. time Max. time Average time Task1 191 199 239 47 41 30 124 260 145 177 1453 30 260 145.3 Task2 395 350 371 181 110 121 243 246 322 193 2532 110 395 253.2 Task3 47 59 48 55 52 44 72 56 80 129 642 44 129 64.2 Task4 250 253 249 250 255 250 212 303 214 286 2522 212 303 252.2
32 8.1.4 Time spent on Android store:
We noted the total time spent in the Android store which was 122 minutes and 53 seconds. The detailed description of time on each task show in below table:
Task U1 U2 U3 U4 U5 U6 U7 U8 U9 U10 Total time Min. time Max. time Average time Task1 200 226 166 77 37 44 232 264 155 167 1568 37 264 156.8 Task2 260 248 250 251 175 251 247 242 331 273 2528 175 331 252.8 Task3 67 57 58 84 65 62 122 53 117 139 824 53 139 82.4 Task4 259 230 240 249 234 231 219 309 243 239 2453 219 309 245.3
Table 17 Task time in second on Android store
Figure 3 Comparisons of Task time (Time in Second)
We calculated the mean time for task 1 in the Apple store which is 145.3 seconds while Android is 156.8 seconds. Task 2 mean time in Apple store is 253.2 seconds while the Android store took 252.8 seconds. Task 3 mean time in Apple store is 64.2 seconds while Android store is 82.4 seconds. Similarly, Task 4 mean time in Apple store is 252.2 seconds while Android store is 245.3 seconds.
We observed that Apple store on iPhone and Android store on Samsung galaxy 2 were very similar in terms of efficiency. Total time taken by Apple store is 7149 seconds (119 minutes & 9 seconds) while Android store took 7373 seconds (122 minutes & 53 seconds). In total, the Android store on Samsung Galaxy 2 took 224 seconds more than Apple store on iPhone.
1453 2532 642 2522 1568 2528 824 2453 0 500 1000 1500 2000 2500 3000
Task1 Task2 Task3 Task4
Apple Android
Comparison of task time
33
8.1.5 Number of taps on Apple Store and Android store:
The participants performed a total of 857 taps in the Apple app store and 879 in the Android store.. Breakdown of the number of taps performed during each task by every participant is provided in Table 14 & Table 15.
Task U1 U2 U3 U4 U5 U6 U7 U8 U9 U10 Total taps Min. taps Max. taps Average taps Task1 19 18 19 18 20 20 22 31 20 21 208 18 31 20.8 Task2 34 38 36 37 36 36 41 35 37 36 366 34 41 36.6 Task3 12 12 12 12 13 12 8 14 13 24 132 8 24 13.2 Task4 13 14 13 13 13 13 17 20 16 19 151 13 20 15.1
Table 18 Taps on Apple store
Task U1 U2 U3 U4 U5 U6 U7 U8 U9 U10 Total taps Min. taps Max. taps Average taps Task1 16 16 17 16 17 20 32 24 28 27 213 16 32 21.3 Task2 25 19 24 25 24 20 23 32 30 34 256 19 34 25.6 Task3 24 20 23 23 24 20 39 26 43 27 269 20 43 26.9 Task4 11 11 12 11 13 14 18 16 17 18 141 11 18 14.1
Table 19 Taps on Apple store
Figure 4 Average No of Taps on Apple Store & Android Store
20.8 36.6 13.2 15.1 21.3 25.6 26.9 14.1 0 5 10 15 20 25 30 35 40
Task1 Task2 Task3 Task4
Apple store Android store
Average number of taps on Apple store and Android store
34
iPhone users tapped more than Android users in Task 2 while in Task 3 Android users tapped more than iPhone users. In task 1 and 2 the average number of taps were almost equal.
8.1.6 Questionnaire Result
After completing the tasks, the participants were provided with questionnaire (Appendix C). Each question was answered on the following scale with their corresponding weight. Strongly Agree = 5 Agree = 4 Moderate = 3 Disagree = 2 Strongly Disagree = 1 Android Users Q1 Q2 Q3 Q4 Q5 Q6 Q7 Q8 Q9 Q10 Q11 Q12 Q13 Q14 Q15 Mean 3.8 3.4 3.5 3.3 4.4 3.4 3.7 2.3 2.1 3.9 3.6 3.5 3.5 3.6 2.3
Table 20 Android Users Mean
iPhone Users
Q1 Q2 Q3 Q4 Q5 Q6 Q7 Q8 Q9 Q10 Q11 Q12 Q13 Q14 Q15 Mean 3.7 4 4.1 3.8 3.7 3.6 3.4 2.4 2.4 4.1 3.6 4.1 3.6 3.9 2.4
Table 21 iPhone Users Mean
Users reported usability issues based on the following questions. Most of the participants disagreed with questions 8, 9 and 15 while agreeing with question 13.
Q. no Question Android users iPhone users 8
I easily located the app in my phone after installation was completed
2.3 2.4
9 It was easy to locate the uninstall option for an app 2.1 2.4 13
I needed to learn a lot of things before I could get going with the app store
3.5 3.6
15
I found the various functions in the app store were well integrated
2.3 2.4
Table 22 Question with usability Issues
35
Chapter 9: Discussion
9.1 Results
In the surveys, it was observed that users have problems installing apps and then locating these apps in the smartphone. This observation has been confirmed in the think aloud study where similar issues were identified. Following is a detailed description of the identified issues:
1. After the app was installed successfully, users could open the app from the app store as long as the user were in the app store. But, in case the user left the app store then he/she would face difficulty in locating the installed app. Because in both Android and IPhone there are multiple home screens with shortcuts to installed apps. The installed app may appear in any empty slot in one of those home screens. If the user has many apps and home screens then it takes time to locate the app and sometimes the user overlooks the app and thinks it is not installed. Although, the user has left the app store, there is disconnect between the functionality of the app store and the rest of the smart phone features. There was a lack of coherence in app store functionary which is also mentioned in [33]. 12 participants reported this issue.
2. Uninstalling an installed app can be confusing for the user. Usually when the user taps the icon of the app on the home screen, it runs the app by default. In iPhone, the user has to long tap the icon to enable the uninstall option which can be tricky for new users to know in the first attempt. In Android, the user has to go to settings and then go to the Apps section, there the user can select any installed app and uninstall it. But this requires a lot of know-hows about the phone, which is very difficult to do compared to iPhone [33]. 14 participants reported this issue.
3. Users had to learn how to go back and forth among search results. Clearing search results and starting a new search result was also confusing. Also when the user was viewing a search result item in Android, then taping the back option rather than pressing the back key would cause the search result to be cleared completely, and the user had to start searching again. This was a frustrating issue for many participants [33]. 13 participants identified and reported this issue. 4. The installation and uninstallation features seem to be disconnected from a user point of view. Once the user leaves the App store then he/she has to search for the uninstall option, which is in different places [33]. 10 participants reported this issue.
5. Searching for apps in android app store would bring up some unwanted apps in the top of the search results. Some of these apps were scam or malware apps, as reported in [34]. This problem was noticeable when searching for Netflix in android app store. The availability of scam and malware laden apps can be attributed to the open source and relaxed restrictions on app submission in android app store while iPhone app store is closed source and has strict guidelines for app submission [32].
36
9.2 Method
Evaluation the usability of smartphone app stores requires gathering data from a large number of users, since the number of smartphone users are 600 million and increasing [1]. For this purpose we selected the following two methods for gathering results from the users:
1. Survey
2. Think aloud study / Feedback questionnaire
Survey is an easy approach to collect information from large number of users in short time. We decided to use survey for the purpose of identifying usability issues among smartphone users while using app store. Information gathered through survey are useful but they don’t provide deep insight into the problems that were reported by users. Therefore to gather more information and understanding about the problems, we complimented the research work by conducting think aloud study. Think aloud study allowed us to observe the behaviours of users while performing app store related operations and provide feedback while performing them. The feedback which is gathered through think aloud study is more valuable than conducting interviews since during interview user might not remember things correctly and the answers they provide may not reflect the usability issues in reality. One major problem with interviews is that it is difficult to understand other people perceptions without adding the bias of interviewer [36]. Often it becomes difficult to systematically report the interview findings [36].
In categorical data, using mean for finding the central tendency can be affected by outliers (extreme values) [38, 39, 40]. Median or mode usually gives a better representation of central tendency in categorical data when the data distribution is skewed [38, 39, 40]. In our survey data, we have used a weighted arithmetic mean with a scale of 1-5 to represent the responses of participants (from very good to very difficult) in order to avoid any extreme values which could skew the data distribution.
Thinking aloud has effect on the performance of the participant’s behaviour and mental workload [37] especially when relaxed thinking aloud is performed. We used the approach of classic thinking aloud and kept the task duration to a small amount to avoid affecting the performance of participants [37]. During thinking aloud, the instructors kept minimum interaction with the participants to avoid skewing the results in the direction of better performance [25]. Instructors interacted only when asked by participants for help.
9.3 Work in wider context
This research work helps developers and vendors to streamline their app ecosystem and app store to improve usability. The results and suggestion provided in this work can be used to offer more usable app store environment. Users expect to discover, install and remove apps in simple and easy steps, improving these areas in smart phone eco-system can also increase customer loyalty and improve perception of the overall eco system as well.
The app/market store are dominated by a small number of super hit apps especially in android app store which makes it difficult for small companies to attract market and large
37
companies have an unfair advantage. Small companies can use social networks to market and attract users because users download habits can be influenced by social factors
38
Chapter 10: Conclusion
In the following section we discuss the research questions and their answers.
Question 1. What are the usability issues in existing app store/market places from user point of view?
The major usability issues identified during this research work are listed below.
App store functionality is not coherent across the smartphone operating system
Location of an app after installation is not easy to find
Uninstallation feature is difficult to locate
Android app store contains a lot of scam and malware laden apps
Navigating search results in the Android app store is not user friendly
Question 2. What is the learning curve for an ordinary user to use the app store/marketplace tools?
Learning curve in this context is used to refer to the time or effort required to understand the user interface of app stores/marketplace. During the think aloud study, many users reported that it was not easy to start using and understanding the way the app store works. For example how to navigate the search results, when does the installation of app completes and where to find the installed the apps. Many users made mistakes while performing these operations in the first attempt. An ordinary user needs time and help to start using the app store in a correct manner.
Question 3. What are the effects of app store/marketplace size on the usability?
The large number of apps in Android and iPhone app store means that there are also a lot of scam and malware laden apps [32]. This reduces the user satisfaction since installing a scam app results in a negative user perception of the app store (and the smartphone eco system).
10.1 Suggestions
There should be some visual connection between the app store and home screen to help the user to locate the installed apps. In iPhone, uninstallation is a single long tap process on the app icon but it is difficult to find out for a new user. Similarly, Android has different ways of uninstalling the app, each method involves many steps. It will be easier for the user to uninstall apps by having a cross icon for each app icon on home screen.
As mentioned already, installed apps and their location on the home screen should be more visually connected. Both Android and iPhone treat the app store an App in the operating system. Rather, it should be treated more of feature. For example, when user is using the search box then besides showing simple a web search result, the user should be presented app search results as well. And the user should be allowed to install apps directly from here.
39 References
[1] “Research and Markets: Worldwide Smartphone Markets: 2011 to 2015 | Business Wire.”[Online].Available:
http://www.businesswire.com/news/home/20110826005231/en/Research-Markets-Worldwide-Smartphone-Markets. [Accessed: 01-May-2012].
[2] “Mobile Apps Approaching Major Milestone of 1 Million Apps in Marketplace: Mobilewalla.” [Online]. Available: http://www.prnewswire.com/news-releases/mobile- apps-approaching-major-milestone-of-1-million-apps-in-marketplace-mobilewalla-134891433.html. [Accessed: 01-May-2012].
[3] M. Fetaji, Z. Dika, and B. Fetaji, “Usability testing and evaluation of a mobile software solution: A case study,” Information Technology Interfaces, 2008. ITI 2008. 30th International Conference on, pp. 501–506, Jun. 2008
[4] Kwang Bok Lee and R. A. Grice, “Developing a new usability testing method for mobile devices,” Professional Communication Conference, 2004. IPCC 2004. Proceedings. International, pp. 115–127, Oct. 2004.
[5] M. Borges, P. Rita, and M. Pagani, “A New Conceptual Framework to Evaluate Consumer Adoption of Mobile Services: The Case of Mobile TV,” Mobile Business (ICMB), 2011 Tenth International Conference on, pp. 173–184, Jun. 2011.
[6] S. Shrestha, “Mobile web browsing: usability study,” in Proceedings of the 4th international conference on mobile technology, applications, and systems and the 1st international symposium on Computer human interaction in mobile technology, Singapore, 2007, pp. 187–194.
[7] P. A. Cudd and R. Oskouie, “Combining HCI techniques for better user interfacing,” IEE Colloquium on Interfaces - The Leading Edge (Digest No.1996/126), pp. 11/1– 11/9, Apr. 1996.
[8] ISO 13407, “International Standard, ISO 13407”, Human-centered design processes for interactive systems, 1999.
[9] Wikipedia contributors, “Usability engineering,” Wikipedia, the free encyclopedia. Wikimedia Foundation, Inc., 06-May-2012.
[10] Wikipedia contributors, “Personal digital assistant,” Wikipedia, the free encyclopedia. Wikimedia Foundation, Inc., 05-May-2012.
[11] P. Paolini, “Hypermedia, the Web and Usability issues,” Multimedia Computing and Systems, 1999. IEEE International Conference on, vol. 1, pp. 111–115 vol.1, Jul. 1999. [12] A. Rauf, S. Batool, S. U. Rehman, and A. A. Shahid, “Survey based usability
evaluation of MS Word,” User Science and Engineering (i-USEr), 2010 International Conference on, pp. 193–198, Dec. 2010
[13] Wikipedia contributors, “Survey methodology,” Wikipedia, the free encyclopedia. Wikimedia Foundation, Inc., 05-May-2012.