An Investment Approach Built
on Systematic Risk
A performance analysis based on the characteristics of
defensive and cyclical sectors on the Swedish stock market.
BACHELOR THESIS WITHIN: Economics
NUMBER OF CREDITS: 15
PROGRAMME OF STUDY: InternationalEconomics
AUTHOR: Pontus Bardh and Jacob Haglund
i
Bachelor Thesis in Economics
Title: An Investment Approach Built on Systematic Risk Authors: Pontus Bardh and Jacob Haglund
Tutor: Mikaela Backman Date: 2021-05-24
Key terms: Defensive, Cyclical, Sectors, CAPM, Beta, Systematic risk, Alpha, Sharpe ratio, Performance, Stock market
Abstract
This thesis investigates and compares the performance and characteristics of defensive and cyclical sectors on the Swedish stock market during 2003-2020 and the financial crisis in 2007-2008, taking monthly price developments from nine sectors. The purpose is to examine the differences in sector performances based on the estimations of systematic risk. Using the relationship between risk and return, we aim to find the most beneficial investment strategy for investors with a long-term investment horizon and provide knowledge to investors who may want to change investment schemes during stock market crises to protect their portfolios from risk. To determine the sectors' classifications, the beta coefficient from CAPM is used. Moreover, alpha and Sharpe ratios are used as performance measures with the aim to find evidence of differences in performance between the classifications. The results show that beta is inconstant over time, and sectors behave differently depending on their dependence to business conditions, demonstrated by different patterns in beta for the two different
classifications when comparing the crisis to the full period. The empirical evidence indicates that a defensive investment strategy is beneficial when considering the relationship between risk and return.
ii
Table of Contents
1.
Introduction ... 1
2.
The Swedish Stock Market ... 4
3.
Literature Review ... 7
4.
Theoretical Framework ... 11
4.1 Modern Portfolio Theory ... 11
4.2 Efficient Market Hypothesis ... 12
4.3 Capital Asset Pricing Model (CAPM) ... 13
4.4 Defensive and Cyclical Sectors ... 14
4.5 Hypothesis ... 15
5.
Methodology ... 17
5.1 Data ... 17
5.2 Sector and Classifications ... 18
5.3 Performance Measure Analysis ... 19
5.3.1 Hypothesis 1 ... 19
5.3.2 Hypothesis 2 ... 21
6.
Results ... 22
6.1 Sector Performance and Period Variations ... 22
6.2 Hypothesis 1 ... 26 6.3 Hypothesis 2 ... 27
7.
Discussion ... 29
8.
Conclusion ... 34
8.1 Limitations ... 35References ... 37
Appendix ... 42
iii
Tables
Table 1: Defensive and cyclical sectors ... 15
Table 2: Selected sector indexes and classifications ... 19
Table 3: Results, full period 2003-2020 ... 23
Table 4: Results, financial crisis period 2007-2008. ... 24
Table 5: Correlation matrix, full period 2003-2020 ... 25
Table 6: Results from equality of mean test, transformed to a one-tailed test on Sharpe ratio, full period 2003-2020 ... 27
Table 7: Results from equality of mean test, transformed to a one-tailed test on Sharpe ratio, financial crisis period 2007-2008 ... 28
Appendix
Appendix 1: Significance of beta and alpha, full period 2003-2020 ... 42Appendix 2: Significance of beta and alpha, financial crisis period 2007-2008 ... 43
Appendix 3: Performance measures, results from hypothesis, full period 2003-2020 ... 43
Appendix 4: Performance measures, results from hypothesis, financial crisis period 2007-2008 ... 44
Appendix 5: Correlation matrix, financial crisis period 2007-2008. ... 44
Appendix 6: Jarque-Bera test, full period 2003-2020. ... 44
iv
Definitions
Alpha: A performance measure for calculating a security or portfolio's excess return in relation to the overall stock market.
Beta (Systematic risk): A variable explaining market risk, measuring how volatile or
sensitive a security or portfolio is compared to the overall stock market, or benchmark index.
Cyclical sector: A sector with a beta over one and moves more than the overall stock market. Generally, more dependent on business conditions, which varies when the demand in an economy change.
Defensive sector: A sector with a beta lower than one and moves less than the overall stock market. Generally, less dependent on business conditions, with a relatively stable demand that is less affected by economic changes.
Index: A measurement on the performance of a selection of securities. Investor: Any person that invests money in the stock market.
Security: A financial asset, commonly referred to as funds, stocks or a combined portfolio like a sector index.
Sharpe ratio: A performance measure that specifies and indicates the relationship between risk and return.
Standard deviation: Measures how the variation of a dataset differs from the mean value. Volatility: Related to standard deviation and describes how much securities differ from the market index. A higher volatility means a higher risk and vice versa.
1
1. Introduction
The number of Swedes investing in the stock market has increased during the last decades. In 2020, 2.1 million unique Swedish private persons held stocks on the market, around 20% of the whole population (Euroclear, 2020). Still, mutual funds are the most popular option where 76% of all Swedes invest in funds (Fondbolagens förening, 2018). An argument for investing in the stock market is to obtain a passive return that grows over time. For example, investing proportions of savings early for pensions could be an excellent way to gain additional
monetary freedom when an individual is retiring. However, investors should be aware that the stock market is dependent on business cycles that affect economic conditions, which has led to several market crises. Yet, investors can protect their investment from losing substantial amounts of money by learning how different securities react and move in different periods. Therefore, it is essential for investors to have the knowledge and the correct information to make investment choices to obtain stable returns while shielding for risk over time. To manage risk or volatility, examining stock market sectors might be a practical approach for investors in decision making since sector volatility has shown clear patterns over time (Bartel et al., 2015).
Systematic risk or commonly referred to as beta in the financial literature, is a variable that explains market risk, meaning how volatile a security or portfolio is compared to the overall stock market. When a security or portfolio of stocks has a beta value of one, it is as volatile as the overall stock market or benchmark index. Accordingly, a defensive security or portfolio has a beta value lower than one and is less volatile to the benchmark index. In contrast, a cyclical security has a beta over one, meaning more volatile to the index (Levy, 1984; Berk & DeMarzo, 2017). Stock-listed companies that operate in similar business segments are
allocated into a portfolio of stocks, called a sector—made by the Global Industry
Classification Standards (GICS). Accordingly, sectors can also be divided into defensive, or cyclical based on MSCI (2018)1. However, several studies show that the beta of securities and sectors is inconstant and can vary over different periods (Levy, 1984; Mergner & Bulla, 2008). Hence, one cannot make a general division of which sectors classify as defensive or
1
Morgan Stanley Capital International (MSCI), together with Standard and Poor (S&P), has conducted a general division and threshold based on the global indexes to serve as a standard for cyclical and defensive sector investigations (MSCI, 2018).
2
cyclical as it may also depend on micro-and macro-economic factors, such as business cycles (Bos & Newbold, 1984; Fabozzi & Francis, 1978). Furthermore, studies have shown that industry-specific and institutional environment influences fluctuations in beta, in addition to the variation in estimates that are affected by the time horizon of study (Drobetz et al., 2016). Thus, analyzing sector performances based on a beta evaluation makes the topic interesting since betas have been proven to change over time and are affected by several factors.
Previous studies have found differences in sector characteristics and performance during different market conditions and countries, concluding ambiguous results (Bartel et al., 2015; Bartram & Bodnar, 2009; Davis & Philips, 2007; Karlsson & Hacker, 2013; Ole-Meiludie et al., 2014). This thesis contributes to the existing literature by analyzing the defensive and cyclical sectors on the Swedish stock market. To the authors' knowledge, this has not been done. The purpose is to examine the differences in sector performances based on estimations of systematic risk, observing the period 2003-2020 and 2007-2008 separately. Using the relationship between risk and return, we aim to find the most beneficial investment strategy for investors with a long-term investment horizon2 and provide knowledge to investors that may want to change investment schemes during stock market crises to protect their portfolios from risk.
Related to the stock market, Sweden has a pension system that has been recognized
worldwide and is considered financially robust (Andra AP Fonden, n.d.). The system includes a Premium Pension System (PPS), where individuals have complete responsibility for
investing their money (Dahlquist et al., 2017). Therefore, it gives an additional opportunity to invest money in the Swedish stock market with multiple existing directions and options. Investors can gain benefits by having the knowledge to make favorable decisions. Furthermore, the increased attention to investing in the stock market makes Sweden an interesting country to study since Dahlquist et al. (2017) show benefits to being an active pension investor. Thus, this thesis aims to fill the research gap and further support investors, such as people who actively manage their long-run pensions in the Swedish stock market, that want stable returns on their investments and protect themselves from the risk of losing
substantial amounts of money in market crises.
3
To empirically assess the relationship between the two classifications, this study uses nine sectors (out of ten) on the Swedish stock market. The sectors are classified as either defensive or cyclical, determined by the beta value using the capital asset pricing model (CAPM), which is calculated for the full period and the crisis period. Moreover, alpha and Sharpe ratio,
denoted as performance measures, will assess the sectors' performance and give insights if an investor should focus on defensive or cyclical sectors in their portfolio. The performance is based on collecting data for each sector and compared to OMX Stockholm Benchmark GI (OMXSBGI). The results from this thesis show that beta is inconstant and changes over time. Still, sector betas tend to stay within their predicted classification overall, following existing literature. In addition, estimations on beta show that sectors behave differently during the financial crisis period 2007-2008, contrary to the full period 2003-2020. The patterns show that defensive sectors overall become less and cyclical, more dependent on the overall stock market's condition. Additionally, the first hypothesis on alpha was found insignificant, concluding that investors theoretically cannot beat the market. The second hypothesis
compares the mean of the Sharpe ratio for each classification using data for the full period and the crisis period separately. The empirical evidence suggests that a defensive investment strategy would be the most preferable during both periods, as the additional risk in cyclical sectors does not compensate enough with higher returns. However, there could be
implications for investors taking investment choices from past data since the trend might not follow the same patterns in the future.
The thesis is structured as follows: Section 2 provides a background connected to the Swedish stock market. Section 3 includes a literature review on the existing literature. In section 4, the theoretical framework, along with hypotheses, is presented. Section 5 describes the
methodology used to analyze the topic, followed by a resume of the main findings in section 6. Section 7 presents a discussion of the results and findings. Finally, the main conclusions and potential future studies, and limitations of the study are found in section 8.
4
2. The Swedish Stock Market
The Swedish Stock Market consists of approximately 900 stock-listed companies on the Stockholm Stock Exchange (SSE) (SCB, 2020). There are various forms of investing money in the companies, depending on the investor's knowledge, savings horizon, and risk an investor wants to take. In recent years, more people have paid attention to investing in the stock market. The trend shows that young people, 21-30 years, are the most increasing age-group investing in the stock market between 2011-2020, with an increase of 5.2%,
corresponding to 12,7% of the total shareholding in Sweden (Euroclear, 2020). An example that may have increased the number of young investors could be the newly emerged internet banks that have made it more convenient to invest in the stock market. Avanza, a popular internet bank in Sweden, saw an increase of 303 900 customers from 2019 to 2020. It corresponds to a rise of 31% of their total user base (Avanza, 2021).
The most common for a Swedish investor is to invest in stocks or mutual funds
(Fondbolagens förening, 2019). Stocks incorporate high risk because investors rely on the results from individual companies. Instead of finding single stocks that have performed good past returns, sector-specific funds are an investment option. There exist funds that directly place all investments into stocks of the same sector. Examples of this are Swedbank Robur Ny Teknik (Technology), Länsförsäkringar Fastighetsfond (Real Estate) and Swedbank Robur Medica (Health Care). The advantage of investing in sector-specific funds is that small investors can easily invest in an individual sector that includes several stocks without buying them individually. Thus, investors can easily follow the performance of the specific sector since sector volatility is shown to be relatively stable over time (Bartel et al., 2015). However, sector funds lead to a high distribution of volatility and return relative to the overall stock market (Yao & Gao, 2004), as the stocks within the sector share similar characteristics. Hence, being more exposed to risk, but a chance to abnormal returns if the overall
performance of stocks within the sector performs well, and vice versa. Additionally, there exist less risky options, like funds that invest in a mix of sectors. For example, Sensor Sweden Select invests high proportions in companies connected to Communication, Finance, Industry, and Real Estate. Additionally, some funds aim to replicate the broad Swedish stock market, called an index fund, that can be an option for an investor that wants minimum risk (Avanza, n.d.). To assess which investment options are most beneficial, investors can ignore the current market conditions and look for long-term investment options in the stock market. A useful
5
approach might be to study individual companies or stocks past performance and their sector classification. Then, investors can find a trend of the average returns and potentially identify good investment choices (Dzikevičius & Vetrov, 2012).
Connected to the stock market, Sweden has a well-known pension system. According to Allianz (2020), Sweden has the highest ranking based on the variables, financial and
demographic starting point, sustainability, and adequacy. It indicates that Sweden is the best country to balance the trade-off between sustainability (demographic change) and adequacy (standard of living in old age). In comparison, large European countries such as Germany, Spain, and France ranked 26, 44, and 51 out of 70 countries in the report. Moreover, the Swedish public pension system has two elements; the first is a notional defined contribution plan which refers to public pension systems for public contributions, funded on a pay-as-you-go foundation. The second is the premium pension system (PPS). It is managed by the Swedish Pensions Agency and offers a range of different funds. Still, the individuals have complete responsibility for their portfolio and where to invest their money. Dahlquist et al. (2017) studied individual investors' performance from the Sweden's Premium Pension System. Their study concluded that investors that actively managed their investments had higher risk-adjusted returns than inactive investors. Thus, this thesis could give pension savers an idea of where to invest their money over a long-time horizon and how to protect their savings in future crises, making the Swedish pension system relevant to the research question.
For an investor with a long-term perspective, placing money in the stock market can be an excellent way to obtain passive income and have historically generated more revenue than a savings account (Fondbolagens förening, 2019). A common method of saving for retirement is by adopting a private pension. By investing long-term savings on the stock market, an individual can attain higher savings that could grow during the years. However, investing money in the market is not always stable due to large fluctuations, which may generate negative returns to an investor's portfolio.
The Swedish stock market has faced several crises during the last decades. In 1990-1992, a real estate crisis led to a decrease in the SSE of 50%, mainly affecting banks and real estate companies (Fondbolagens förening, 2019; Wedin, 2016). In the late 1990s, many people invested in the newly emerged technology phenomena and saw opportunities connected with internet development (Wedin, 2016). It led to an increase in the Stock market of 70% in 1999
6
(Fondbolagens förening, 2019). However, at the beginning of the 2000s, the bubble crashed, leading to broad downturns in stock-listed companies, primarily affecting the Information Technology (IT) companies (Wedin, 2016). In Sweden, the stock market value decreased by half from the top results in 1999. The market had a decreasing trend until 2003, followed by significant upturns until 2007. Although, in 2007, another crisis hit the market. The leading cause of the outbreak was a credit crisis on the US mortgage market, linked to an inflated housing market. The crisis spread worldwide, affecting the SSE with a decrease of around 40% during 2007-2008. However, the market recovered, followed by years of stable growth in the 2010s, with some deviations in 2011 and 2015 due to the Euro nations' unstable financial situations. Also, in 2018 in connection with Great Britain leaving the European Union (Fondbolagens förening, 2019). Moreover, the COVID-19 crisis led to widespread downturns in the stock market at the beginning of 2020, caused by loss of revenues and uncertainty regarding the situation and the future outcomes (CNBC, 2020).
Notwithstanding, OMXSBGI that measures the average growth on the Swedish stock market, including dividends, has increased. The trend is that after a crisis with broad downturns follows periods of significant stock market increases. Yet, the index has reached the highest values during the last years, with an average yearly growth of around 13% from 2003 to 2020 (Nasdaq Omx Nordic, 2021).
7
3. Literature Review
Previous studies have analyzed sector performance and their characteristics, beta estimations, and investment techniques, primarily investigating performance deviations in recessions or market crises in a specific country. However, several empirical studies give various results, making it hard to draw a general conclusion on how defensive and cyclical sectors perform in different periods. For simplicity, previous studies that find sectors with a beta less than one are considered defensive, and beta over one cyclical.
Drobetz et al. (2016) find that specific sector betas occur highly correlated to a single stock's beta, meaning that stocks share the same characteristics as their sector. The study focusing on the international shipping industry (cyclical sector) finds that beta changes over time,
influenced by economic outcomes, and exploits beta variation over time. Another study by Hafsal and Durai (2020) confirms the statement and shows that changes in a sector's variance affect the companies in the same sector. A similar argument is drawn by Bartel et al. (2015), finding that sector volatility is relatively steady over time due to similar reactions to
macroeconomic changes for companies within a sector. Hence, the beta of a single stock moves in the same direction as the sector. Moreover, Drobetz et al. (2016) find that market betas tend to be higher during market crises and lower when the market has a positive trend. Hence, sectors that are more exposed and affected by business cycles see higher movements in their beta levels, explaining sector-specific differences in beta. Moreover, studies have found that beta investigations are more useful when evaluating sectors instead of individual stocks. Since measuring individual stocks betas, there is a tendency for significant sampling errors, leading to an unavoidable over or underestimation in betas (Yao & Gao, 2004). Additionally, a study conducted in North America by He and Kryzanowski (2007) showed similar results for both the Canadian and the US stock market, providing evidence that sectors have similar characteristics regardless of the institutional environment. Thus, the previously mentioned studies indicate that it is possible to use sector characteristics and performance to assess investment strategies.
Furthermore, Ole-Meiludie et al. (2014) conducted a study on the South African Stock exchange's five historically defensive and cyclical sectors. By particularly comparing
defensive sectors performance during the market crisis in 2007-2009, compared to 1996-1999. They find that defensive sectors become more defensive by a lower beta under the market crisis, implying that defensive sectors in their study, Health Care, Consumer Goods, and
8
Consumer Services remain non-cyclical or defensive and more insensitive to movement in the stock market. However, compared to cyclical sectors (Basic Materials, Industrials), the beta increased in the crisis (Ole-Meiludie et al., 2020), meaning more sensitive or volatile to the overall stock market. Another study by Bellehumeur (2008) found that the traditional US defensive sectors performed a negative return, but better than the market and cyclical sectors during the 2008 Financial crisis compared to 2007. Bellehumeur (2008) concludes that the traditionally defensive sectors remain defensive during a crisis and find that Consumer Goods and Services, Health Care, and Utilities are defensive sectors. Moreover, Karlsson and Hacker (2013) analyzed the US stock market with data from 1995-2010, finding that systematic risk (beta) decreases over more extended periods. But during stock market crises, like the financial crisis in 2008, the risk coefficient has a propensity to increase and hit the industries most affected by the situations. Karlsson and Hacker (2013) argues that the primary source of the crisis was the Financial sector which includes Banks and Real estate-related companies, etc. They found that the market betas for industries related to the Financial sector in the US became more cyclical in terms of a significant increase in beta, while traditional defensive sectors like Health care and Consumer goods related sectors remained defensive during two stock market crises in their sample period.
Ole-Meiludie et al. (2014) recommend that investors change investment strategies and invest in defensive securities under crisis periods. In comparison, Bartram and Bodnar (2009) show with global, including US stock data from 2007-2009, that the correlation between sectors and investment styles gets higher during the crisis period. Thus, it becomes harder for investors to shield for risk and significant downturns in a global crisis. Moreover, Davis and Philips (2007) studied data from 1963-2006 in the US market to investigate the strengths and weaknesses of defensive equity investing. They confirm that investors can improve their portfolio's performance during recessions by investing in defensive securities rather than cyclical ones. However, there are difficulties implementing a defensive investment strategy because clear historical patterns are hard to transform into real-time outperformance. The problem is argued to come from inconsistent characteristics and performance. Also, when the market has a positive trend, defensive securities tend to perform less than the overall stock market. Therefore, Davis and Philips (2007) conclude that having a defensive investment strategy based on looking at signals of stock market declines and recessions would not be better than having a buy-and-hold strategy.
9
Davis and Philips (2007) find Health Care, Utilities, Consumer Staples, Telecommunication, and Energy to be defensive sectors, Technology, Consumer Discretionary, Materials,
Industrials, and Financial as cyclical. Similar sectors are used in Bartram and Bodnar (2009), showing that the primary cause of the crisis (Financial sector) performed twice as high negative returns compared to non-financial sectors in the world stock market. Moreover, they found a tendency for higher volatility during the crisis period compared to the total period for all sectors. However, a drawback of Bartram and Bodnar's (2009) study is that they do not specify the sectors as defensive or cyclical or use beta estimations. On the other hand,
following how other US stock data studies classify sectors, the traditionally defensive sectors managed to perform the best, albeit negative returns, with lower volatility on average during the financial crisis than cyclical sectors. Moreover, Bartel et al. (2015) study the approach of using sectors to manage risk using ten large sectors with data from the US stock market for 1962-2010. They find differences in defensive and cyclical sectors performance in terms of drawdown risk and risk-adjusted returns, depending on four stages of the business cycles, often 1-10 years. Bartel et al.'s (2015) data show that traditional cyclical sectors (Financials, Industrials, Technology, etc.) perform better than the benchmark index in the early cycle but worse than the index during the late-cycle and in recessions, considering risk-adjusted returns. The contrary pattern holds for defensive sectors (Health Care, Telecom, Utilities, etc.). They outperformed the benchmark and cyclical sectors in the late-cycle and recessions linked to poor market performance.
To summarize this section, the evidence from previous studies shows that analyzing sectors is a useful tool as stock within a sector correlates with each other and shows clear patterns of volatility going in the same direction. Furthermore, the existing literature shows that
defensive sectors should become more or remain defensive during a market crisis, in terms of maintaining a beta lower than one. In contrast, cyclical sectors in general are expected to generate increasing beta value during market crises. Regarding how sectors react to crises in terms of returns is divergent, since some studies confirm that defensive sectors beat the market in a crisis, but others find a defensive investment strategy during a crisis to not generate better returns than the market. Studies also find cyclical sectors to be more affected by expectations regarding future cash flows. Therefore, evidence shows that cyclical sectors should perform poorly during crisis situations, but better than the overall stock market and defensive sectors in a longer period. However, when accounting for the higher risk in terms of
10
volatility, previous studies show that defensive sectors should be favorable in crisis situations and in a longer time frame.
11
4. Theoretical Framework
4.1 Modern Portfolio TheoryHarry Markowitz developed the modern portfolio theory in his paper “Portfolio Selection” from 1952. The theory guides risk-averse investors by several rules for rational decisions by maximizing expected returns while keeping risk or variance of returns minimized. Markowitz (1952) stresses that by diversifying their portfolios through investments in diverse securities, investors can decrease their risk. Instead of investing all money in one stock, investors should allocate their money in multiple securities to get a diversified portfolio that is argued to be less risky than the total of all individual securities. It is done to get the highest expected return with the lowest variance. Having a portfolio with low variance securities and adding high variance securities will expose the portfolio for higher risk levels but give a higher potential expected return (Markowitz, 1952). The theory captures some valuable points for this thesis:
• An investor should choose a diversified portfolio to shield for risk, meaning diversify the risk in several stock sectors.
• If two securities have the same risk-adjusted performance, the investor should pick the least risky.
• Higher variance, a measure of risk, should theoretically be compensated by a higher return.
Chunhachinda et al. (1997) confirm the theory in some regards by arguing that including more securities into a portfolio lowers the risk substantially. Moreover, investors will get a higher expected return when investing in more risky portfolios in terms of skewness, meaning more distant values from the mean gives higher expected returns (Chunhachinda et al., 1997). However, according to Širůček and Křen (2015), analyzing the US stock market compares if high or low beta stock portfolios are the most favorable investment option for twenty years, rejects the assumption. Their results show that a portfolio with high beta generated the lowest return when including the risk—backed by Fama and French (2004), finding that higher risk in terms of beta does not guarantee a higher return. In contrast, a low beta portfolio showed higher returns, but the risk in terms of volatility increased in the study period. The highest returns and lowest risk were found in a portfolio using several stocks with a close connection to the index (Širůček & Křen, 2015).
12
4.2 Efficient Market Hypothesis
Eugene Fama founded the efficient market hypothesis (EMH) in 1970. In the paper, Fama (1970) argues that all information available regarding capital markets should be fully reflected by all parties involved. As a result, investors can perfectly observe security prices and firm outcomes, and choose securities efficiently with complete information about the price. Fama (1970) claims that in a market where prices are driving and perfectly reflect all available information is called efficient. An efficient market is one without transaction costs, publicly available information, and everyone agrees on the current price and distribution of future prices of securities. In this market, the current prices of securities reflect all accessible information (Fama, 1970).
EMH describes price adjustment in different levels: weak form, semi-strong form, and strong form. These various forms illustrate how quickly and efficiently the market reacts to the newly accessible information. The weak form implicitly tells that market prices are reflected based on available historical prices. The semi-strong assumes publicly available information (e.g., announcements of company annual earnings) in addition to the weak form's
assumptions. Lastly, the strong form with the premise of the latter two also assumes that private and hidden information reacts to changes in prices. Connected to EMH is the random walk model. The model is used in finance to describe that changes in security prices are almost unpredictable or spontaneous. Thus, prices reflect all available information, and one cannot predict future prices; hence, they are random (Fama, 1970).
According to Fama (1970), investors cannot get price advantages from new information. Therefore, there is no possible way to earn excess returns on stock investment, i.e., investors cannot beat the market or obtain alpha over zero. Ying et al. (2019) criticizes the theory by arguing that markets cannot be fully efficient, and it is possible to gain excess returns over time. Ying et al. (2019) says that if an actively managed portfolio does not perform better than passively managed, it is assumed that the extra information does not pay off, and the market is efficient. However, empirical estimates by Malkiel (2003) found consistency with the EMH when researching US mutual funds from 1991-2001. He found that 70% of the mutual funds performed lower returns than the benchmark index. Additionally, funds that performed great in the short run could not generate consistent returns, in the long run, meaning it is difficult to get excess returns and beat the market in the long run.
13
4.3 Capital Asset Pricing Model (CAPM)
CAPM is the most known and commonly used model to estimate and specify the relationship between systematic risk (beta) and expected returns on securities (Berk & DeMarzo, 2017). The model is a developed version of Markowitz's portfolio theory that introduced risk-free assets to the efficient portfolio and evaluation of individual securities. CAPM was first introduced by William Sharpe (1964) and assumes that investors can only get higher returns when taking higher risk relating to volatility. The model suggests that investors want to maximize their return and choose the most efficient portfolio, meaning that they choose securities with the highest expected return for a specific risk level (Berk & DeMarzo, 2017). The following equation is the CAPM formula:
𝑬(𝒓𝒊) = 𝒓𝒇+ 𝜷𝒊(𝑬(𝒓𝒎) − 𝒓𝒇)
Where 𝐸 (𝑟𝑖) is the expected return on securities, 𝑟𝑓 is the risk-free interest rate, which is the return that an investor should expect from a risk-free investment. 𝛽𝑖 is the beta of the security and 𝐸 (𝑟𝑚) is the expected return on the overall market.
In CAPM, beta is a variable used to measure how volatile or sensitive securities or portfolios are compared to the whole stock market, explaining market risk. According to the CAPM formula, beta is assumed to be constant over time. A beta over (under) one means that the security or portfolio is more (less) volatile to the market. A beta equal to one means that the security is equally volatile as the overall stock market or benchmark index (Berk & DeMarzo, 2017). The beta variable supports our study to determine which sectors classify either as defensive or cyclical during the periods under research and is an essential indicator for the thesis. The following equation is the beta formula:
𝜷 =
𝑪𝒐𝒗(𝒓𝒔, 𝒓𝒎)𝑽𝒂𝒓(𝒓𝒎)
Where Cov(𝑟𝑠, 𝑟𝑚) is the covariance between 𝑟𝑠 referring to the return of a security, and 𝑟𝑚 which is the return of the market. Var(𝑟𝑚) is the variance of 𝑟𝑚.
Alpha is a measure of performance, calculated by taking securities' or portfolio's expected excess return over its expected return, and is related to the efficient market hypothesis (EMH) presented in 4.2. Jensen (1968) developed the concept behind alpha and is used as a
performance measure in CAPM. According to CAPM, alpha should not divert from zero, meaning that securities or portfolios should perform equivalent to the overall market. These
14
assumptions are consistent with EMH that investors cannot beat the market (Fama, 1970). Alpha over (under) zero means that the security or portfolio performs better (worse) compared to the market (Berk & DeMarzo, 2017). The following equation is the alpha formula:
𝜶𝒋 = 𝒓𝒊− (𝒓𝒇+ 𝜷𝒊𝒎(𝒓𝒎− 𝒓𝒇))
Where 𝛼𝑗 is the return in relation to a market index, 𝑟𝑖 is the realized return, 𝑟𝑓 risk-free interest rate, 𝛽𝑖𝑚 is the beta value of the portfolio and 𝑟𝑚 is the market return.
4.4 Defensive and Cyclical Sectors
The general approach to determine whether a security is defensive, or cyclical depends on systematic risk or beta measures, meaning volatility to the overall market (Levy, 1984). For securities, the beta coefficient is, for instance, affected by how sensitive the firms' operations are to economic conditions, like revenues and future expected cash flows (Berk & DeMarzo, 2017). Following Bartel et al. (2015), Drobetz et al. (2016), and Hafsal and Durai (2020), the argument can be applied to sectors as well, since their studies show that stocks within the same sector share similar characteristics in terms of correlation, volatility or variance. Moreover, MSCI (2018) has created a general global benchmark on defensive and cyclical companies used for future research by allocating the companies into sectors that operate in similar business segments.
Generally, a defensive security or sector is argued to be less dependent on the economy or business cycles and moves less than the entire stock market or a benchmark index. In comparison, a cyclical sector is generally more volatile and dependent on economic
conditions, where the performance tends to move with the business cycle (Berk & DeMarzo, 2017). The concept behind business cycles, found by Burns and Mitchell in 1946, explains business cycles as being phases of low and high economic activity, which affect business enterprises' financial outcomes. Thus, a recession is linked to deficient economic activity, in contrast to an expansion that refers to high activity and promising outcomes for the future (Burns & Mitchell, 1946). Accordingly, defensive sectors should not be affected by a
recession compared to cyclical, meaning the beta coefficient and revenues should not change that much for defensive securities during poor economic times. That is since the demand for personal and household products does not change when times are tough. On the other hand, cyclical follows the economy phase and performs approximately equally to the business cycle, which generally means performing better in an expansion and poorly in a recession phase. In addition, cyclical sectors are more dependent on revenues, which varies when the demand in
15
an economy moves within business cycles (Berk & DeMarzo, 2017). In Table 1 below, the general characteristics of defensive and cyclical sectors is summarized.
Table 1: Defensive and cyclical sectors. Summarizes the characteristics of defensive and cyclical securities.
Defensive Cyclical
Performance Independent on economy Dependent on economy
Beta <1 >1
Risk Low High
Volatility Low High
Furthermore, whether a sector classifies as defensive or cyclical might not always hold over time, since previous research has rejected the CAPM assumption of constant beta and found that beta estimates are affected by the time horizon of the study (Levy, 1984; Mergner & Bulla, 2008). Studies have also provided arguments that micro and macroeconomics
conditions such as dividend changes and business cycles may impact beta estimations (Bos & Newbold, 1984; Fabozzi & Francis, 1978). Additionally, Drobetz et al. (2016) find that firm and industry-specific, and institutional influence fluctuations in beta. Rui et al. (2011) evaluated the beta of five sectors in the Shanghai stock exchange from 1993-2010, finding continuous fluctuations in betas during the period and a higher than the typical increase of betas in four sectors during the financial crisis 2008. Yet, the beta estimates for a single country stock market may only hold for the specific country and chosen period of study.
4.5 Hypothesis
The theoretical framework builds up to two hypotheses that will be tested during a more extended period and a crisis period individually to determine the differences in defensive and cyclical sectors performance. The results from the performance measures tests aim to support the purpose and conclude the most beneficial investment strategy.
The first hypothesis is a test on alpha to find if there are any differences in defensive and cyclical sectors expected excess returns in relation to the expected market return. The alpha term shows how securities perform in relation to the benchmark index, calculated based on CAPM. The aim is to make two tests individually, with data for the full period 2003-2020 and the financial crisis period in 2007-2008.
16
Hypothesis 1: Defensive sectors have performed higher average excess returns than cyclical sectors in relation to the benchmark index.
The hypothesis is based on the argument from a study by Baker et al. (2011) that finds that low beta securities perform better excess returns than high beta securities. Hence, it is
expected that the returns of the defensive sectors should perform higher returns in relation to a market index than the cyclical sectors looking at the mean of the alphas for each
classification. However, the theories, EMH in section 4.2 and CAPM in section 4.3 states that an investor cannot theoretically beat the market, which means that they cannot get an excess return over time, and it should not differ from zero (Berk & DeMarzo, 2017; Fama, 1970; Malkiel, 2003). Thus, the tests will reveal if this holds for the Swedish stock markets as well.
The second hypothesis is established on the Sharpe ratio, which measures the excess return of a security, divided by the standard deviation of the securities excess return, which refers to risk or volatility. The ratio shows risk-adjusted return, where higher values are preferable. The aim is to conduct two tests separately, with data for the full period 2003-2020 and for the financial crisis period in 2007-2008.
Hypothesis 2: Defensive sectors have performed higher risk-adjusted returns on average than cyclical sectors.
The hypothesis states that investing in defensive sectors gives a higher excess return than cyclical when adjusting for risk. Which is according to the existing literature as studies find that higher risk does not compensate for a higher return in the long-term (Fama & French, 2004; Širůček & Křen, 2015). Also, Bartel et al. (2015) find that less volatile or defensive sectors perform better risk-adjusted returns than cyclical ones in the phase of a recession, which is linked to overall poor stock performance.
17
5. Methodology
5.1 DataThe calculations used in this study are based on price developments of Swedish sector indexes. However, various external and internal factors can cause variation in each sector's performance in terms of returns, standard deviation, and beta over time. External factors are related to macroeconomic conditions, such as interest rate, inflation, and economic growth. This thesis does not capture or include these factors directly, which is a topic for future studies. Yet, these factors affect price developments of sectors indirectly, which is captured to some degree using the trend of sector performance by comparing two periods. Internal factors are related to microeconomic conditions that can be systematic risk or beta (Subing et al., 2017), which is an essential variable for the evaluation used in this paper.3
The data is collected from the website Nasdaq Omx Nordic, which gives access to historical price developments for the chosen sectors in this thesis. Data from the sector indexes in this study have been taken from the last trading day every month, referring to monthly returns, following Davis and Philips (2007) and He and Kryzanowski (2007). Choosing monthly returns instead of daily is because monthly returns are roughly normally distributed and have fewer peaks (Fama, 1976). Furthermore, there are two types of broad indexes in Sweden, PI index, which only measures price development, and GI index, which also collects the stocks' dividends. Since a significant share of the indexes is companies where dividends often constitute a large share of average returns, GI indexes have been used (Nasdaq, 2012). OMXSBGI, a GI index, is used as the benchmark index to compare the sectors to the overall stock market. The Swedish government borrowing rate is used as the risk-free rate. It reflects the risk-free rate and is calculated as the average market interest rate for government bonds with a remaining maturity of at least five years (Riksgälden, 2019). Based on this,
Skatteverket (2021) has calculated an average rate for each year that is used in this thesis.
This study uses data from the period January 2003 to December 2020. The decision to use this period should be long enough to have many stock markets ups and downs, therefore capture
3
Other factors that may affect sectors' performance could be the degree of international market share and export levels of production has not been considered. Additionally, a trend variable showing the number of Swedes investing in the stock market over time has not been included either.
18
the characteristics of defensive and cyclical sectors during different stock market conditions. Additionally, the chosen period covers the global financial crisis that started in 2007 and came to an end in 2009 (Riksbanken, 2018), which will be analyzed separately. However, since the sample data shows a positive trend from 2009, this study investigates the period January 2007 to December 2008 where the Swedish stock market had a significant stock market decline. The authors are aware that having a crisis within the full period might impact the evaluation. However, the choice was made consciously as the intention is to find if there are any
differences in beta estimates or characteristics during different business conditions or cycles of an estimated period. Thus, by examining sector performance and their classification in a more extended period contrary to a crisis period, a profound analysis of the results can be achieved to see patterns of differences in behavior or movements in the stock market.
5.2 Sector and Classifications
Collecting data from sector indexes captures the whole price development of several stocks within a sector. Instead of collecting data from individual stocks, that could lead to bias in the selection process, for example, choosing only top-performing stocks. The sector methodology is based on MSCI (2018), with ten existing sectors in the Swedish stock market that are divided into two classifications, defensive and cyclical4. However, due to missing data restrictions from the Consumer Discretionary sector, the thesis includes nine. The chosen sector indexes and their expected classification are shown in the table below. Each index is a market-capitalization weighted index and consists of a variety of stocks in a sector that are listed on the Swedish stock market.
4
MSCI has created a general division on cyclical and defensive indexes to highlight the performance across different Global Industry Classification Standard (GICS) sectors. The GICS classifies the companies based on the business segment they operate. The indexes work as a benchmark for future investigations on cyclical and defensive sectors (MSCI, 2018).
19
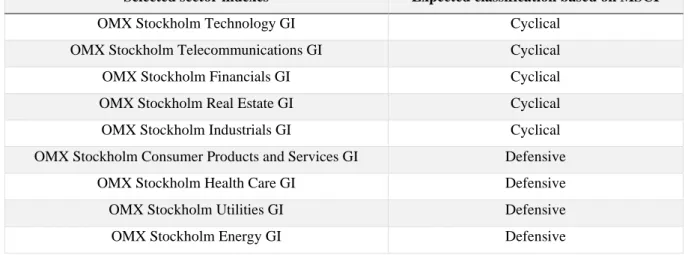
Table 2: Selected sector indexes and classifications.The table shows the selected sector indexes and their expected classification (MSCI, 2018). Beta > 1 classifies as cyclical, beta < 1 classifies as defensive (Berk & Demarzo, 2017; Levy, 1984).
Selected sector indexes Expected classification based on MSCI
OMX Stockholm Technology GI Cyclical
OMX Stockholm Telecommunications GI Cyclical
OMX Stockholm Financials GI Cyclical
OMX Stockholm Real Estate GI Cyclical
OMX Stockholm Industrials GI Cyclical
OMX Stockholm Consumer Products and Services GI Defensive
OMX Stockholm Health Care GI Defensive
OMX Stockholm Utilities GI Defensive
OMX Stockholm Energy GI Defensive
First, we need to calculate the beta values for each sector during the full period 2003-2020 and the financial crisis period 2007-2008 separately. Then, using the beta formula from CAPM in section 4.3, ordinary least squares (OLS) regressions are conducted to test which classification a sector belongs to by calculating the beta values and their significance for the full and crisis period. The results from the regression found in Appendix 1 and Appendix 2 will be compared to MSCI's benchmark classification, seen in Table 2 above. The threshold is used as a guideline to see if the sectors of the Swedish market are different from the global classifications that MSCI (2018) has created.
5.3 Performance Measure Analysis
To fulfill the paper's purpose and fill the research gap, the goal is to conduct four tests, two for each time-period using alphas and Sharpe ratios independently. The tests on the
performance measures are used to assess the most beneficial investment strategy considering the relationship between risk and return.
5.3.1 Hypothesis 1
The first hypothesis aims to find differences in alphas for defensive and cyclical sectors. Although, according to the EMH in section 4.2 and CAPM in 4.3, investors cannot theoretically beat the market, meaning they cannot get an excess return and obtain alpha above zero over time (Berk & DeMarzo, 2017; Fama, 1970; Malkiel, 2003). By applying the CAPM and alpha equation, the test can be made to see if this does not hold for the defensive and cyclical sectors on the Swedish stock market or if the market is considered efficient. First, to conduct the test, an OLS regression for each sector is made. The excess return of the individual sectors is set as
20
the dependent variable, with the market return of the benchmark index, OMXSBGI, as the independent variable. A significance level of 0,05 is selected to test if the alphas are significantly different from zero.
If most individual sector alphas are found significant in each period, two tests will be conducted with data from the full period 2003-2020 and the financial crisis period 2007-2008. By assembling sets for defensive and cyclical sectors found in Appendix 3 and Appendix 4 to make independent sample t-tests constructed by equality of means tests. The first hypothesis will compare the mean of alphas between the two classifications to determine if the means of the sample sets differ from each other and support the purpose of the thesis to indicate if an investor should focus on defensive or cyclical securities. The hypotheses will hold if the results show that investing in defensive sectors gives a higher average excess return than cyclical sectors in relation to the benchmark index. The tests will be established as a one-tailed test following the t-distribution, assuming unequal variance.
The hypothesis tests will be rejected if the t-value is lower than the critical value 𝑇 < 𝑡1−𝛼 where = 0.95. The following equations are for the t-test and degrees of freedom formulas using Nist/Sematech (2012) statistical E-handbook, as shown below. Sample one refers to defensive sectors, and sample two refers to cyclical sectors.
𝒕 = (𝒙𝟏− 𝒙𝟐) √(𝒔𝟏)𝟐 𝒏𝟏 + (𝒔𝟐)𝟐 𝒏𝟐 𝒅. 𝒇 = ((𝒔𝟏 𝟐 𝒏𝟏)) + (( 𝒔𝟐𝟐 𝒏𝟐)) 𝟐 ( (𝒔𝒏𝟏𝟐 𝟏) 𝟐 𝒏𝟏− 𝟏 ) + ( (𝒔𝒏𝟐𝟐 𝟐) 𝟐 𝒏𝟐− 𝟏 )
Where t is the t-value, 𝑥1 is the mean of sample one, 𝑥2 is the mean of sample two, 𝑠1 is the standard deviation of sample one, 𝑠2 is the standard deviation of sample two, 𝑛1 is the sample size of sample one and 𝑛2 is the sample size of sample two.
21
5.3.2 Hypothesis 2
The Sharpe ratio, developed by William Sharpe in 1966, is used to assess securities such as funds, stocks, and portfolios, by calculating the average excess return per unit of overall risk. In other words, the ratio corrects the expected return by considering the specific risk that an investor takes, meaning risk-adjusted return. Theoretically, investors should pick securities with the highest predicted excess return, meaning risk-adjusted return (Sharpe, 1994). The portfolio with the highest Sharpe ratio is called the efficient portfolio. It is typically a mix of stock-related securities and the risk-free rate, being the optimal combination of risky
investments independent of the investor's desire for risk (Berk & DeMarzo, 2017).
The Sharpe ratio is the most well-known performance measure. It is argued popular and successful due to its simplicity and clear explanation (Bednarek et al., 2016). However, a weakness of the ratio is that it assumes that investment returns are normally distributed (Sharpe, 1994), which might be unlikely in reality. Still, using monthly returns gives
approximately normally distributed data with fewer peaks, which minimizes the risk of errors in estimation (Fama, 1976). The following equation is the Sharpe ratio formula:
𝑺𝑹 =
𝒓𝒑−𝒓𝒇𝝈𝒑
Where SR is the Sharpe ratio, 𝑟𝑝 is the average return of the portfolio, 𝑟𝑓 is the average return of the risk-free rate and 𝜎𝑝 is the risk in terms of standard deviation of the portfolio, where the portfolio represents a sector index.
The second hypothesis intends to find the differences in Sharpe ratio for the two
classifications. To test this, the same independent sample t-test as in the first hypothesis will be conducted by allocating all defensive sectors Sharpe ratios into one portfolio and all cyclical into another. Two tests will be made, testing the mean of defensive sectors against cyclical with data from 2003-2020 and 2007-2008 separately. The hypotheses will hold if the results show that investing in defensive sectors gives higher benefits on a risk-to-reward level than cyclical sectors or if the higher volatility in cyclical does not provide enough return to compensate for the higher risk.
22
6. Results
6.1 Sector Performance and Period Variations
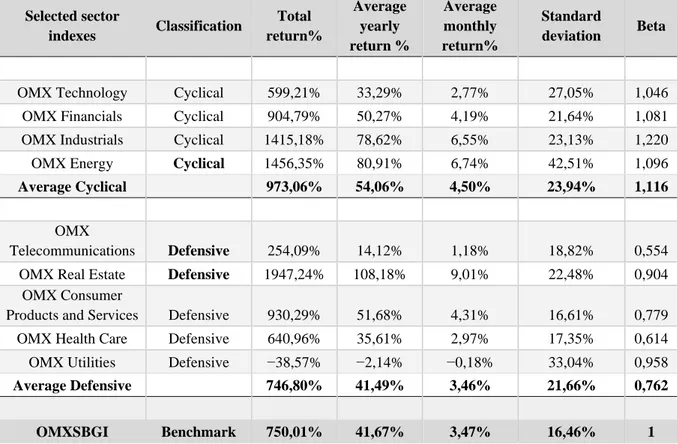
Table 3 and Table 4 below show returns, standard deviation, and beta values for the examined sectors, calculated based on data for the full period 2003-2020 and crisis period 2007-2008 separately. The results found in Appendix 1 and Appendix 2 conducted from the OLS regressions show that all beta values are statistically significant at the 0,05 critical level, except the Energy sector in the crisis period 2007-2008.
In the full period, shown in Table 3, three sector betas showed variation from the MSCI (2018) sector benchmark classification, highlighted in bold. Telecommunication (0,554) and Real Estate (0,904), which according to MSCI (2018) in Table 2, are classified as cyclical sectors and should have a beta over one, have been defensive during 2003-2020 in Sweden. Also, Energy (1,096), which should have a beta below one according to MSCI (2018), has been cyclical during the period. It indicates that Telecommunications and Real Estate are less volatile to the overall market than predicted, and Energy more volatile. It implies that some of the Swedish sectors show variation from MSCI's global classification and do not follow the general threshold of which sectors classify as defensive or cyclical. Thus, MSCI's global threshold is not entirely reliable when seeking defensive and cyclical securities in Sweden since it does not completely share the same characteristics during the researched period.
Moreover, all sectors have positive returns during the period, apart from utilities (-38,57%). The total returns show that the top performers were Real Estate (1947,24%), Energy
(1456,35%), and Industrials (1415,18%). The benchmark index OMXSBGI has a positive return of 750,01%, greater than four of the nine sectors, and a standard deviation of 16,46%, the lowest of all. The average total return of cyclical sectors was 973,06%, with a standard deviation of 23,94%, which is more than the benchmark index, where three out of four sectors have higher returns than the benchmark. The defensive sectors underperform compared to the average cyclical and benchmark index, with an average total return of 746,80%, with a standard deviation of 21,66%, lower than cyclical. However, a big part of defensives' average low average performance comes from the Utility sector, which has heavily underperformed (-38,57%) with a higher standard deviation (33,04%) than the other sectors classified as defensive under the examined period.
23
Table 3: Results, full period 2003-2020. The table presents the classifications based on beta calculations from the CAPM formula using an OLS regression. Sectors that obtain beta > 1, classifies as cyclical, beta < 1, classifies as defensive. Beta is calculated using the formula presented in 4.3. Sectors highlighted with bold deviate from MSCI (2018) benchmark. The total return is calculated by taking: (final value - starting value) divided by starting value. The average yearly return has been calculated by taking total return divided by 12 and average monthly return by taking total return divided by the total number of months for the period. Standard deviation by taking STDEV.S in Excel multiplied by SQRT (12).
Selected sector indexes Classification Total return% Average yearly return % Average monthly return% Standard deviation Beta
OMX Technology Cyclical 599,21% 33,29% 2,77% 27,05% 1,046 OMX Financials Cyclical 904,79% 50,27% 4,19% 21,64% 1,081 OMX Industrials Cyclical 1415,18% 78,62% 6,55% 23,13% 1,220 OMX Energy Cyclical 1456,35% 80,91% 6,74% 42,51% 1,096
Average Cyclical 973,06% 54,06% 4,50% 23,94% 1,116
OMX
Telecommunications Defensive 254,09% 14,12% 1,18% 18,82% 0,554 OMX Real Estate Defensive 1947,24% 108,18% 9,01% 22,48% 0,904
OMX Consumer
Products and Services Defensive 930,29% 51,68% 4,31% 16,61% 0,779 OMX Health Care Defensive 640,96% 35,61% 2,97% 17,35% 0,614 OMX Utilities Defensive −38,57% −2,14% −0,18% 33,04% 0,958
Average Defensive 746,80% 41,49% 3,46% 21,66% 0,762 OMXSBGI Benchmark 750,01% 41,67% 3,47% 16,46% 1
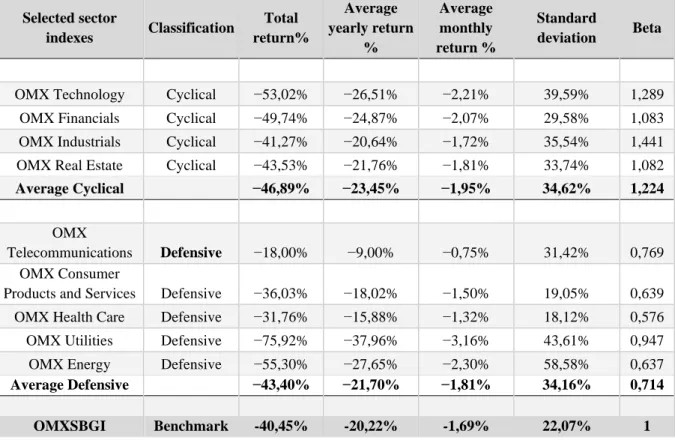
Table 4 shows the results from the financial crisis in 2007-2008 with some interesting findings compared to the full period. First of all, the Energy sector classifies as defensive during the crisis period with a beta of 0,637 compared to the full period (1,096). However, since the beta is statistically insignificant, the Energy sector's beta is equal to zero, which corresponds to a defensive sector. Furthermore, Real Estate became cyclical with a beta of 1,082 during the crisis period (0,904 in full), which can be influenced by the inflated US housing market that spread the crisis globally, described in section 2. All cyclical sectors during the crisis period obtained a higher beta value and became more sensitive to the
conditions in the overall stock market when compared to the full period. In contrast, the betas for all defensive sectors apart from Telecommunications obtained a lower beta in the crisis period. Thus, they became more defensive and less sensitive to movements in the overall stock market.
The total returns are negative for all sectors, but the benchmark index has performed the highest returns (-40,45%), compared to average defensive (-43,40%) and cyclical (-46,89%). The benchmark has the lowest standard deviation (22,07%) in comparison to average
24
defensive (34,16%) and cyclical (34,62%). The defensive sectors average performance was again influenced by the high standard deviation for Utilities (43,61%), but also Energy (58,58%). Looking at individual sectors, the defensive sectors under the crisis managed to deliver the best results, with the top-performing Telecommunications (-18%) and Healthcare (-31,76%). However, defensive sectors accounted for the worst returns as well, with Utilities (-75,92%) and Energy (-55,30%). In comparison, all cyclical sectors performed negative returns but were more equally distributed within their classification and lower range regarding total return (-53,02% to -41,27%) and standard deviation (29,58% to 39,59%). Contrary to defensive sectors, return (-75,92% to -18%) and standard deviation (18,12% to 58,58%).
Table 4: Results, financial crisis period 2007-2008. The table presents the classifications based on beta calculations from the CAPM formula using an OLS regression. Sectors that obtain beta > 1, classifies as cyclical, beta < 1, classifies as defensive. Beta is calculated using the formula presented in 4.3. Sectors highlighted with bold deviate from MSCI (2018) benchmark. The total return is calculated by taking: (final value - starting value) divided by starting value. The average yearly return has been calculated by taking total return divided by 12 and average monthly return by taking total return divided by the total number of months for the period. Standard deviation by taking STDEV.S in Excel multiplied by SQRT (12).
Selected sector indexes Classification Total return% Average yearly return % Average monthly return % Standard deviation Beta
OMX Technology Cyclical −53,02% −26,51% −2,21% 39,59% 1,289 OMX Financials Cyclical −49,74% −24,87% −2,07% 29,58% 1,083 OMX Industrials Cyclical −41,27% −20,64% −1,72% 35,54% 1,441 OMX Real Estate Cyclical −43,53% −21,76% −1,81% 33,74% 1,082
Average Cyclical −46,89% −23,45% −1,95% 34,62% 1,224
OMX
Telecommunications Defensive −18,00% −9,00% −0,75% 31,42% 0,769 OMX Consumer
Products and Services Defensive −36,03% −18,02% −1,50% 19,05% 0,639 OMX Health Care Defensive −31,76% −15,88% −1,32% 18,12% 0,576 OMX Utilities Defensive −75,92% −37,96% −3,16% 43,61% 0,947 OMX Energy Defensive −55,30% −27,65% −2,30% 58,58% 0,637
Average Defensive −43,40% −21,70% −1,81% 34,16% 0,714 OMXSBGI Benchmark -40,45% -20,22% -1,69% 22,07% 1
Table 5 below shows the correlation matrix for all sector indexes, including the benchmark index OMXSBGI during the full period 2003-2020. Whether a sector is classified as defensive, or cyclical is based on beta estimates in Table 3. Correlation is measured from minus one to one and describes how associated the sector indexes' performance or price movements are. A value closer to one means that two variables are highly positively
25
correlated and move in the same direction, with one telling perfect correlation. Conversely, a negative value indicates that price movements go in opposite directions.
The matrix shows that several sectors have a high correlation to each other, which can
correspond to signs of autocorrelation in the data sets. However, it is expected and not seen as a problem since individual sector indexes are a part of the benchmark index, and typically their price movements should move together. Moreover, all correlations are highly significant at a significance level of 0,05, apart from the correlation between Utilities and Technology, which is insignificant. All defensive sectors apart from Utilities have a correlation value over 0,9 compared to the benchmark index, which means that nearly all defensive sectors move in the same direction as the overall stock market. Also, Financials (0,9945) and Industrials (0,9919) are nearly perfected correlated to the benchmark, being the only cyclical sectors with a value over 0,9 compared to the benchmark index. Overall, defensive sectors display a higher correlation to the benchmark, meaning moving more similar to the overall market, except for Utilities which is negatively correlated, meaning moving in the opposite direction to the overall market. However, having a negative or low correlation to the benchmark like Utilities (-0,5233) and Energy (0,7731) could have different impacts on their results. The results in Table 3 show that Utilities had negative returns while Energy was one of the top performers. However, overall, the correlations link well with the results in the full period in Table 3, where on average defensive sectors have more similar returns and standard deviations to the benchmark index.
Table 5: Correlation matrix, full period 2003-2020. Summarizes the correlation between defensive and cyclical sectors with
the overall market or benchmark index OMXSBGI, ranging from -1 to 1. 1 being perfectly positively correlated, 0 no correlation, -1 perfectly negatively correlated. The sectors marked in italic refer to defensive sectors in 2003-2020, obtained from beta estimates in Table 3.
TECH FINA INDU ENER TELE REALE CONSPS HEALC UTIL
TECH 1 0,8002 0,7964 0,6716 0,6456 0,8043 0,7973 0,8401 −0,0852 FINA 0,8002 1 0,9856 0,7466 0,8942 0,9681 0,9807 0,9652 −0,5173 INDU 0,7964 0,9856 1 0,7778 0,9034 0,9786 0,9924 0,9769 −0,5305 ENER 0,6716 0,7466 0,7778 1 0,7899 0,7653 0,7390 0,7612 −0,2802 TELE 0,6456 0,8942 0,9034 0,7899 1 0,8632 0,8758 0,8605 −0,5852 REALE 0,8043 0,9681 0,9786 0,7653 0,8632 1 0,9790 0,9814 −0,5133 CONSPS 0,7973 0,9807 0,9924 0,7390 0,8758 0,9790 1 0,9819 −0,5469 HEALC 0,8401 0,9652 0,9769 0,7612 0,8605 0,9814 0,9819 1 −0,4990 UTIL −0,0852 −0,5173 −0,5305 −0,2802 −0,5852 −0,5133 −0,5469 −0,4990 1 OMXSBGI 0,8089 0,9945 0,9919 0,7731 0,9213 0,9669 0,9840 0,9697 −0,5233
26
Another correlation matrix was made for the crisis period 2007-2008, found in Appendix 5, with beta estimates from Table 4. All sectors correlation to Energy was found insignificant, in line with the OLS regression on beta, showing an insignificant result as well. Furthermore, there is some insignificant correlation between different sectors, but all sectors except Energy showed a significant correlation to the benchmark index at the 0,05 level.
Additionally, all sectors show positive correlations to the benchmark, Financials (0,9873), Consumer Products and Services (0,9771), and Industrials (0,9725) being the highest correlated. In contrast, Telecommunication (0,6527) was the only significant sector that correlates lower than 0,8. On average, the cyclical sectors display a higher correlation to the benchmark index, meaning they have more similar changes in their price movements
compared to defensive sectors. This may be explained by the high average dispersion defensive sectors in Table 4 shows, where cyclical sectors have a more even distribution regarding returns and standard deviations on average. Thus, explaining their tendency for the higher correlation to the benchmark index. In addition, this may be due to the explanation Bartram and Bodnar (2009) provides; during market crises, investments tend to become more correlated to each other. Despite this, a defensive sector like Telecommunications (0,6527) performed the best returns during the crisis, describing that it is not always beneficial to have a high correlation to the overall stock market or benchmark index in all situations.
6.2 Hypothesis 1
The first hypothesis is used to test defensive against cyclical sectors alpha, with the aim to conduct two independent t-tests. The hypothesis states that defensive sectors perform higher alphas than cyclical on average. The results from the full period in Appendix 3 show that the average alpha of defensive sectors is 0,0012, compared to cyclical with an average of 0,0027. However, as found in Appendix 1, no individual sector alphas are statistically significant on the 0,05 level, meaning they are not significantly different from zero. Consequently, we cannot proceed and conduct the independent sample t-test. The results on the crisis period in Appendix 4 show that the average defensive has an alpha of -0,0066 and cyclical 0,0030. Despite this, Appendix 2 shows that all alphas are insignificant in line with previous results. Therefore, we cannot conduct the test either.
27
Consequently, the first hypothesis is invalid and cannot be used to analyze the differences in performance regarding excess return between the classifications. The results imply that investors theoretically cannot beat the market, consistent with theory and previous research, since the theories, EMH in section 4.2 and CAPM section 4.3 states that it is impossible to have alpha above zero over time. Malkiel (2003) confirms the theories by arguing that it is impossible to have alphas deviating from zero in the long run. This can be because Fama (1970) argues that there is no way to get advantages in an efficient market since all
information is publicly available. Therefore, it can be said that the Swedish stock market is found efficient. Therefore, as we found no alphas deviating from zero, it can provide evidence that the Swedish stock market is to some degree efficient.
6.3 Hypothesis 2
The second hypothesis is based on the Sharpe ratio presented in 5.3.2, testing defensive against cyclical, with the aim to find differences in a risk-to-reward relationship between the two classifications, based on values found in Appendix 3 and Appendix 4. The hypothesis states that defensive sectors perform a higher Sharpe ratio than cyclical on average. To verify if the Sharpe ratios are normally distributed a Jarque-Bera test was conducted found in
Appendix 6 and Appendix 7. The results indicate that 𝐻0 cannot be rejected for any test at the 0,05 level, meaning normal distribution. One test is made for the full period 2003-2020 and another for the crisis period 2007-2008, with the results found in Table 6 and Table 7 below. Whether a sector classifies as defensive (mean 1) or cyclical (mean 2) during the different periods is obtained from Table 3 and Table 4. The sample size for both tests is nine observations, calculated using 215 monthly returns for the full period and 24 for the crisis period. The critical value for the one-sided test is found to be -1,895 at the 0,05 level, assuming unequal variance using Nist/Sematech (2012) formulas for t-test and degrees of freedom.
Table 6: Results from equality of mean test, transformed to a one-tailed test on Sharpe ratio, full period 2003-2020.
T-value Mean 1 Mean 2 Variance 1 Variance 2 Defensive ≥ Cyclical −0,1545 0,6059 0,6315 0,1113 0,0206
According to Table 6 above, the average Sharpe ratio for defensive sectors (0,6059) is less than cyclical (0,6315). The defensive sectors' mean is influenced by the Utility sector's low