Faculty of Natural Resources and Agricultural Sciences
Critical thermal minimum of the
embryonic development in the
common frog (Rana temporaria)
Pontus Eriksson
Master’s thesis
Independent project 60 hec Department of Ecology Uppsala 2019
Critical thermal minimum of the embryonic development in
the common frog (Rana temporaria)
Pontus Eriksson
Supervisor: Göran Hartman, Swedish University of Agricultural Sciences, Department of Ecology
Assistant supervisor: Ane Timenes Laugen, University of Agder, Department of Natural Sciences
Examiner: Åsa Berggren, Swedish University of Agricultural Sciences, Department of Ecology
Credits: 60 hec Level: A2E
Course title: Independent project in Biology Course code: EX0778
Course coordinating department: Department of Aquatic Sciences and Assessment
Place of publication: Uppsala Year of publication: 2019 Cover picture: Pontus Eriksson
Online publication: http://stud.epsilon.slu.se
Keywords: Development, Rana temporaria, Anura, Critical Thermal Minimum,
Embryonic, Temperature, Degree-days, Day, Degrees, Oophila, Common frog, Ranidae, Amphibian, Algae.
Sveriges lantbruksuniversitet
Swedish University of Agricultural Sciences
Faculty of Natural Resources and Agricultural Sciences Department of Ecology
The embryonic development of anurans is known to be temperature-dependent and well-studied. Oviposition of Rana temporaria (common frog) in the northern temperate climate zone occurs as soon as the ice melts on water bodies. This early oviposition can take place in waters below 5 °C. The aim of this study was to find the critical thermal minimum of the embryonic life-stage in R. temporaria to use in degree-day calculations and investigate the survivability in low temperatures. The end of the embryonic period for R. temporaria was set to development stage 23 (hatching and tooth development, Gosner 1960). This study used 15 egg clutches, and subjected the embryos to seven constant temperature treatments between 1 – 7 °C. The sampling took place in south-central Sweden (59°N). The aim was achieved by investigating survival and development of the embryos. Studying survival was important to investigate if the critical thermal minimum of populations with no gene-flow between them differed. The maximum development stage was used to determine the developmental temperature threshold (base temperature) for the use of degree-days calculations. Lethal dose 50 (LD50) was used as a measurement of survival, and
maximum development stage (DSmax) was used for development over temperature
treatments. There was a significant local divergence for critical thermal minimum between populations based on survival. Two populations were not significantly different for survival; 4.96 °C, and 4.94 °C, the third population had a significant lower LD50 value of 4.37 °C. Developmental thresholds were temperature-dependent
and there was no singular threshold for the embryonic development of R. temporaria. This might complicate the degree-day usage on anurans; however, this complicates the usage of degree-days on all organisms. When using the degree-day formula on embryonic development of R. temporaria I strongly suggest that 3.89 °C or 2.88 °C is to be used for the calculations, depending on the stopping point of development i.e. stage 23 or stage 20 respectively. Two of three populations had a currently unknown to Europe algae (Oophila) present in the embryo envelope. Embryos with the algae present had significantly higher survival; 64 % vs. 62 %. The populations without this alga had lower development maxima and the presence of alga might have skewed the results. Future studies should focus on the critical thermal minimum over latitudinal clines, distribution of the algae in Europe, and the possible symbiotic relationship between European anurans and Oophila.
Keyword: Development, Rana temporaria, Anura, Critical Thermal Minimum,
Embryonic, Temperature, Degree-days, Day, Degrees, Oophila, Common frog, Ranidae, Amphibian, Algae.
List of tables 6 List of figures 7 1 Introduction 9 2 Method 12 2.1 Field procedures 12 2.2 Laboratory procedures 13
2.3 Physiological and Ecological critical thermal minimum 14
3 Results 15
3.1 Physiological critical thermal minimum 15
3.2 Ecological critical thermal minimum 16
3.3 Observed mortality 17
3.4 Algae Oophila sp. in Europe 18
3.5 Comparisons with earlier studies 19
4 Discussion 20
4.1 Physiological critical thermal minimum 20
4.2 Ecological critical thermal minimum 21
4.3 Method 22 4.4 Conclusions 23 References 24 Acknowledgements 27 Appendix 1 28
Table of contents
6
Table 1. Parameter estimates from the two maximum likelihood models of maximum
development stage reached for the two replicates 15
Table 2. Parameter estimates from the maximum likelihood survival to DS23 models
of the non-heated and heated replicates. 16
Table 3. Embryonic development success of R. temporaria were survival from
development stage 13 to development stage 23 and failure were mortality
between these stages. 18
7
Figure 1. Sample sites of Rana temporaria egg clutches within the city limits of
Uppsala, Sweden (59°N lat. 17°E long.). Collection date for Site 1: 19th of
April, Site 2: 22nd of April, and Site 3: 27th of April 2018. 12
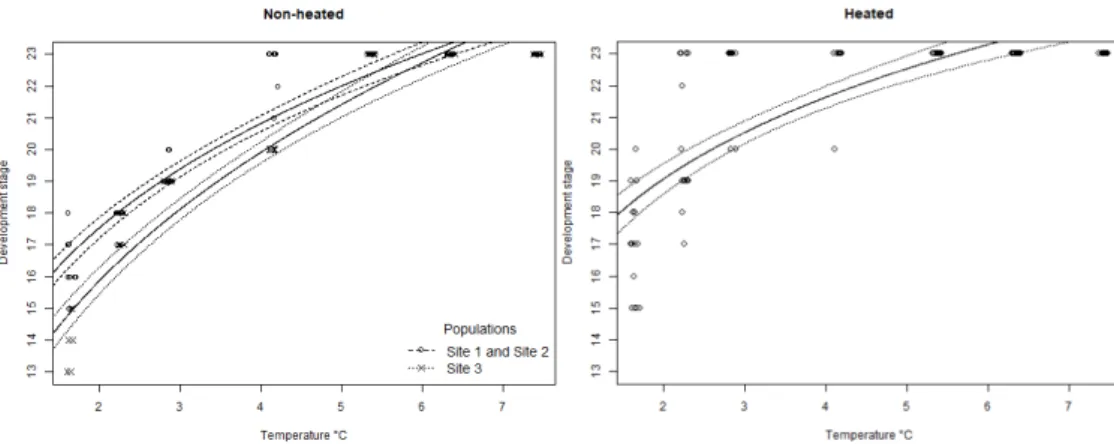
Figure 2. Maximum reached development stage within a family (egg clutch) of R.
temporaria per temperature treatment of the two replicates. The non-heated replicate to the left (Site 1 and Site 2 was grouped), and the heated replicate to the right (no distinction between populations). The difference between the two replicates indicates that the critical thermal minimum lies between 2.24
and 4.15 °C 16
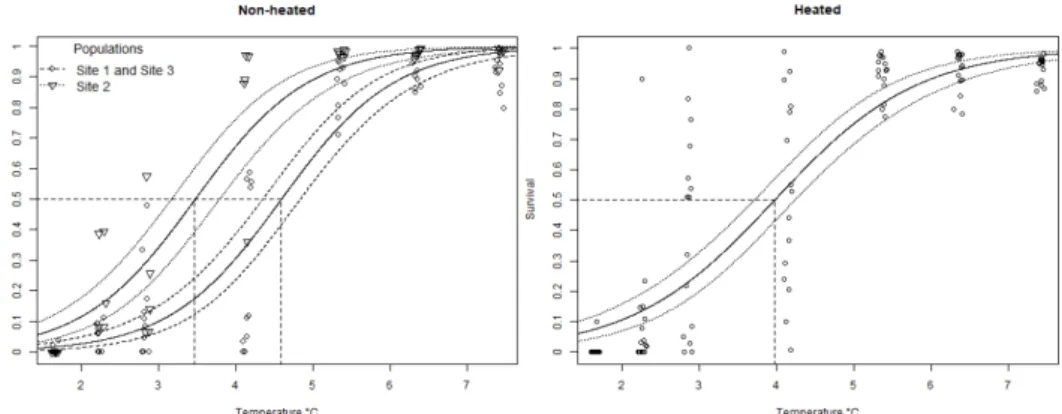
Figure 3. Embryonic survival of R. temporaria under different temperature treatments.
Non-heated (left, Site 1 & 3 grouped) and heated (right, no distinction between populations) replicates with modelled mean (solid lines) survival to DS23 with corresponding confidence intervals (dotted lines) and calculated
LD50 (dashed lines). 17
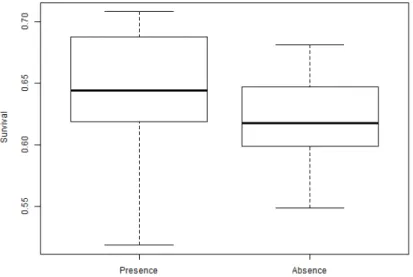
Figure 4. Mean survival of R. temporaria embryos with Oophila present was 0.639,
and mean survival with Oophila absent was 0.618. There is a significant higher mean survival for embryos with Oophila present, p-value = 0.0009***.
18
Figure 5. Maximum reached development stage of DS20 within a family (egg clutch)
of R. temporaria per temperature treatment of the two replicates. Non-heated to the left (Site 1 and Site 2 was grouped), and the Non-heated to the right (no distinction between sites). The difference between the two replicates indicates that the critical thermal minimum lies between 1.61 and
2.85 °C 19
Figure 6. Calculated LD50 up to DS20 for embryonic survival of R. temporaria for the
two replicates. Non-heated to the left (Site 1 and Site 3 was grouped), and the heated to the right (no distinction between sites). The mean was calculated and fitted with corresponding 95 % confidence intervals and LD50
were illustrated with a dotted line. 19
The effect of temperature on embryonic development of anurans (frogs and toads) have been studied for over a century (Hertwig 1898). Hertwig (1898) found with quantitative studies that embryos of Rana temporaria (common frog) had temperature-dependent acceleration of development because of underlying chemical processes. Further studies about embryonic development of anurans in a range of temperatures were made to better understand temperature tolerance and thermal adaptation (e.g. Atlas 1935, Moore 1939, Moore 1951). Moore (1951) studied R.
temporaria and Lithobates sylvaticus (wood frog, former: Rana sylvatica), and if
hybridization was possible between the two. Hybridization was not possible, but the embryonic development was identical over a range of temperatures. R. temporaria were collected from Vosges in eastern France (48°N) and Louvain in Belgium (50°N) and the critical thermal minimum (lower temperature tolerance) for R.
temporaria was set tentative at 5 °C (due to lack of gill circulation in 4.1 °C).
Twenty-six years later Beattie (1977) also investigated the critical thermal minimum for R. temporaria from different altitudes to investigate if there was an embryonic adaptation to temperature. There was a difference between low-altitude (3.8 °C) and high-altitude (2.8 °C) populations at which 50 % of embryos reached development stage 20 (gill circulation, Pollister and Moore 1937).
Thermal tolerance curve is the survivability over a span of temperature that an organism can withstand, and it is equivalent to thermal performance curves. Thermal performance curves have an optimal temperature where performance (e.g. jumping, swimming) is highest, two critical temperatures: one low and one high where the organism will no longer function. Within these two extremes lies the thermal breadth (Angilletta 2009). These curves are helpful to model how the organisms’ fitness compares to temperature and can be applied to any aspect of physiology or life history. Thermal performance curves are asymmetrical, if the body temperature is increased with a value above the optimum the fitness will decrease more than if the body temperature is decreased below the optimum with the equivalent value i.e. the curve is right-skewed (Huey and Kingsolver 1979). This phenomenon of an asymmetrical thermal performance curve along with the fact that ectotherms are not perfect thermo-regulators begs the question if the optimal temperature is indeed the same as optimal fitness. According to Martin and Huey (2008) this is not the case, they argue that a sub-optimal body temperature will yield a higher fitness over time due to the asymmetric nature of the curve. Bachmann (1969) argued that the rate of development of Incilius valliceps (gulf coast toad, former: Bufo valliceps) is linear within the same temperature span that there is 100 % survival. Outside of the 100 % survival he hypothesizes that the curve takes on a sigmoid appearance which corresponds to thermal performance curves. This raises the question how anuran embryos behave in sub-critical temperatures.
To be able to study the critical thermal minimum (lower thermal limit) of R.
temporaria embryos, a stopping point must be decided. The embryonic development
10
of anurans is commonly described in developmental stages by Gosner (1960), there is 20-25 embryonic stages (depending on how you define it) with a total of 46 stages to metamorphosis. Later studies generally use GS25 (Gosner stage 25) as the end of the embryonic life-stage, there are however, some sources in this study that predates 1960. These studies use embryonic stages defined my Arthur W. Pollister and John A. Moore in “Tables for The Normal Development of Rana sylvatica” published 1937 (Pollister and Moore 1937). Before 1978 stage 20 was generally used as the end of embryonic life-stage because American authors had observed that embryos hatched and that gill circulation commences at development stage 20 (e.g. Moore 1951, Volpe 1957) and European authors who studied European anurans used the same stopping point (e.g. Douglas 1948, Beattie 1977). Later studies have used different end-stages for embryonic experiments such as development stage 25 (both gills enclosed in the operculum, Gosner 1960, Laugen et al. 2003a) and development stage 23 (active swimming, Gosner 1960, Lind et al. 2008).
R. temporaria is a widely distributed frog, and it ranges from the Barents Sea 71°N
in the north, to northern Spain 31°N in the south, from the British Isles in the west to western Siberia in the east (Kuzmin et al. 2009). This species lay their eggs in water as soon as the ice retracts from the water bodies in the north, which can be below 5 °C (pers. obs., Loman 2016) and around 5 °C and up (e.g. Haapanen 1982, Muir et al. 2014). The eggs have a black animal pole, a cloudy gelatinous capsule to surround the embryos and they float (Savage 1961). The consequences of the oviposition behaviour of R. temporaria ensures that the temperature amplitude changes are smaller and the period for even temperatures are longer over time. The egg capsule also helps in this regard, as it functions as an isolator, and the black animal pole of the embryo collects energy from the sun. All these factors are keeping the temperature as high as it can with as little variation as possible in nature (Savage 1961). The critical thermal minimum for embryos of R. temporaria is of great importance because it is the widest dispersed, the most northern, and the most common European frog (Fog et al. 1997).
There are conflicting reports of the lower thermal limit of R. temporaria, the lower temperature limit for the embryonic development of R. temporaria spans between: > 8 °C > X > 2.8 °C (Mikulski 1938, Douglas 1948, Moore 1951, Balcells 1956, Grainger 1959, Kobayashi 1962, Guyétant 1969, Beattie 1977). These data are from different populations and biogeographical areas, ranging from Tokyo, Japan (Kobayashi 1962, possibly not R. temporaria) to the English highlands. The average lower thermal limit was calculated to 4.99 °C and the general assumption is that the lower thermal limit for R. temporaria is 5 °C. These studies terminated the experiment when the embryos reached development stage 20 (Pollister and Moore 1937). Douglas (1948) and Moore (1951) assumed a critical thermal maximum for
11
R. temporaria commence breeding one day after mean air temperatures exceeds 5
°C (Haapanen 1982). Because of the breeding sites R. temporaria chooses we can assume that the water temperature follows the air temperature relatively well (Haapanen 1982). This indicates that R. temporaria in general, starts to breed near the critical thermal minimum of their embryos. This behaviour is probably a product of selection, either because they breed in ephemeral ponds (ponds that dry up later in the year) or because they are restricted by the onset of winter (Laurila et al. 2002, Laugen et al. 2003b). With the current levels of climate change and with future-predictions in mind I assume that the phenology of R. temporaria will shift towards an earlier oviposition at high latitudes, like in the United Kingdom (Scott et al. 2008). This might be a problem considering that they breed near critical thermal minimum and with earlier oviposition comes lower temperatures. This is most pressing in low-latitude areas, because of the fast warm-up rate after snow-melt at higher low-latitudes (Ståhlberg et al. 2001). R. temporaria can however, withstand temperatures down to 0 °C for periods < 48 h (Douglas 1948). Despite of their relative high resilience to cold, all it takes is one cold-spell in the gastrulation stage to induce high-levels of mortality (Grainger 1959).
To measure phenology changes (earlier oviposition, earlier hatching) with higher accuracy the usage of degree-days (heat-days, growing degree-days, day-degrees etc.) might prove useful. It is used in several taxa within biology e.g. insects, plants, turtles, and fish (Cross and Zuber 1972, Johnson et al. 1994, Neuheimer and Taggart 2007, Snover et al. 2015). One key aspect for degree-days (°D) is the critical thermal minimum, or base temperature as it is called in degree-day contexts. I have previously suggested that degree-days is a more accurate measurement of time to specific life-history events in anurans with a focus on R. temporaria, but a well-established critical thermal minimum was lacking (Eriksson 2018). This is further supported with the findings by Scott et al. (2008), that hatching is not as early in the year as congregation and spawning.
The aims of this study are two-find to investigate:
1) Determine the physiological critical thermal minimum of R. temporaria, i.e. find the temperature where development cannot continue. This is interesting because of the possible degree-day usage.
2) Investigate the ecological critical thermal minimum of R. temporaria, i.e. calculate the lower temperature which cannot support the development of a viable population. This will be done by modelling LD50 (lethal dose 50 per cent of the
populations).
12
2.1
Field procedures
A total of 15 egg clutches (families) of R. temporaria were collected from three different sites in the city of Uppsala, Sweden (59°N). Five clutches were collected from Site 1 (59.87595, 17.66884), Site 2 (59.84603, 17.60549), and Site 3 (59.80117, 17.63621) on the 19th, 22nd and 27th of April 2018 respectively. The distance between
Site 1 – Site 2 is 5.3 km, Site 2 – Site 3 is 5.3 km and Site 1 – Site 3 is 8.5 km (Figure 1). This should in an urban setting ensure no genetic exchange because of increased number of barriers e.g. roads, or at least a negligible exchange and therefore they can be treated as separate populations (Hitchings and Beebee 1997).
The sampling sites all differ in sun-exposure, size, depth, and population size.
2
Method
Figure 1. Sample sites of Rana temporaria egg clutches within the city limits of Uppsala,
Sweden (59°N lat. 17°E long.). Collection date for Site 1: 19th of April, Site 2: 22nd of April,
13
Site 1 is situated in a pasture with high sun exposure on the north side. The area of the water table was ca. 70 m2 and the maximum depth was around 1 m.
Number of egg clutches in 2018 were 41. This site is a part of a pond complex. Site 2 is an old clay quarry with heavy growth of common reed (Phragmites
australis). The Site was ca. 130 m2 with a depth around 0.5 – 1 m, it is also connected
to another clay pit with a water table that was ca. 550 m2 and a maximum depth of
ca. 2 m. One assumption is that the frogs in this site colonized after the year 1977, since all clay related operations was ceased that year. The site was intermediately exposed and the number of clutches in 2018 were 191.
Site 3 is part of a pond matrix; it is an alder carr-like habitat in a deciduous copse with low exposure where the frogs actively searched for solar exposure. The water table of this site was ca. 250 m2 and it had a maximum depth of ca. 1 m. The
number of clutches in 2018 were 185.
The egg clutches were transported in site-separate 6 l buckets (roughly half-filled with pondwater) with freeze clamps to the lab. This step was to keep the temperature as low as possible to ensure minimum development of the embryos. The embryos were not exposed to the transportation water longer than 30 minutes.
Spawn of Rana temporaria was collected in accordance to the dispensation from the Swedish Preservation Clause in the Species Protection Regulation (2007:845) issued by the County Board of Uppsala. Ref: 522-1708-19. Date of decision: 2018-04-18. In accordance to Swedish legislation there was no other ethical permits needed since the embryos were euthanized before they started to feed.
2.2
Laboratory procedures
Upon arrival to the lab all the spawn was stage determined according to the specific development stage (DS) the embryos were in (Pollister and Moore 1937, Gosner 1960). One egg clutch was in DS1, this is the stage just after the fertilization, when the animal pole (dark side of the embryo) rotates upwards. 12 egg clutches were in DS2, this is recognised by a grey crescent that becomes visible after fertilization. One egg clutch was in DS3, this is the stage where the first cell division becomes apparent. And finally, one egg clutch was in DS7, this is recognised as the first irregular cell division with ca. 32 cell (Gosner 1960).
Post stage determination the egg clutches was divided into 14 smaller clutches. There were two replicates (one was later heated) per climate chamber and seven climate chambers with different temperature treatments: 1.61 °C – 7.42 °C, later one replicate was heated to 10.37 °C (Table A1). The heating of one replicate gave way for interpretations and comparisons of temperature dependency for the different developmental stages. This was done to investigate if the embryos had stopped developing (hit a development threshold) or if they were deceased. The heated replicate was moved from temperature treatments 1.61, 2.24, 2.85 and 4.15 °C to a separate climate chamber on day 57 for Site 1, day 54 for Site 2 and day 49 for Site 3. The difference in days per treatment was because of the time difference of the oviposition in the sites. The new temperature treatment was started at 4.37 °C, the embryos spent 24 h in this temperature to acclimate, then the temperature was increased with 2.0 °C increments per 24 h for 72 h. The final temperature treatment had a temperature of 10.37 °C. The embryos of the heated replicate were left to develop in this new temperature to DS23 (opercular fold).
This division of egg clutches resulted in a total of 210 separate 0.75 l opaque vials containing 95 ± 5 embryos with reconstituted fresh water (APHA 1985). The water was changed every third day (Laugen et al. 2003a), and was aerated and pre-cooled
14
to the same temperature as the climate chamber to ensure minimal temperature fluctuations for the embryos.
The five first days after the spawn was collected the development was checked every day for all the treatments, thereafter the progression of development stages was checked with longer time intervals (1-3 days) depending on temperature treatments and present stage. This was due to the different rate of development for the temperature treatments i.e. it was not necessary to check on the lowest temperature treatment as often as the highest, or the later development stages as often as the earlier stages (Witschi 1956). The development was checked with a microscopic camera with 0.75 – 11 x magnification with 1.0 x increments.
The embryos were euthanized (frozen) at DS23 when the labial tooth start to develop, this was determined when the operculum fold was apparent and when the neck-skin had folded and connected all the way around the “throat” of the embryo. DS23 was chosen as an end to ensure that there was no feeding behaviour of the larvae, and because the embryos hatch at this stage (Gosner 1960, Ståhlberg et al. 2001, Lind et al. 2008).
Mortality was individually recorded and divided into four general categories: “Blastulation” that entailed DS1 – DS9, “Gastrulation”: DS10 – DS12, “Neurulation”: DS13 – DS19, and finally “Transparent fins”: DS20 – DS23.
2.3
Physiological and Ecological critical thermal minimum
All the data analysis was done in R, Version 3.5 © 2018 (R Core Team, 2018) with additional packages MASS for dose.p() and tidyverse for data structure. The map was produced in ArcGIS Desktop, Version 10.6.1.9270 - © 1999 – 2018 Esri, Inc. To determine the physiological critical thermal minimum Maximum development stage (DSmax)was used. I observed and noted the development stage achieved when
ca. 50 % of the sample (vial) had expired. This gives a good approximation of the DSmax because it is a conservative measurement by default. This was done to both
replicates and the difference between replicates could be studied and thus, the physiological critical thermal minimum could be determined. I used the natural logarithm of both response and predictors with a Gaussian error distribution and the full model used was DSmax as response and the function of temperature and the
interaction of populations as predictors, the heated replicate had no significant interaction.
To determine the ecological critical thermal minimum Lethal dose 50 (LD50)was
used. The distribution of survival over the different temperature treatments was used to calculate as the point of the ecological critical thermal minimum.
The data was analysed with logistic regression modelling. There were no interactions in the modelling for the response variable survival as a function of the prediction variable temperature and populations. The full model used to explain the ecological critical thermal minimum was survival as response and a function of temperature and populations with a binomial error structure. Quasibinomial error distribution was used to produce p-values.
15
Fifteen egg clutches (families) of R. temporaria from three populations were collected inside the city limits of Uppsala, Sweden. There were seven temperature treatments and two replicates. Four temperature treatments were subjected to a higher temperature (heated replicate) to see if development resumed. The mortality was individually recorded at DS23, and the time of death < DS23 was grouped within four major physiological events during the embryonic development.
3.1
Physiological critical thermal minimum
Most ova had been successfully fertilized, of 19,723 embryos 569 were unfertilized (97.12 % fertilization). All the families (egg clutches) had under 10 % unfertilized embryos. The mean number of eggs (± SE) in a clutch was 1,315 ± 75. Every egg clutch was divided into 14 sub-clutches for the different treatments and replicates with a mean of 91 ± 5 embryos per sub-clutch.
The maximum development stage (DSmax) achieved was reported as the
general DSmax of a family, temperature treatment, and replicate.
DS23 (opercular fold, labial tooth) was achieved in 5.37 ℃ - 7.43 °C for all the families and replicates. Temperatures below 5.37 ℃ differed significantly in achieved DSmax dependent of the family and replicate (Appendix, Table A3).
The embryos from Site 3 had an overall lower DSmax but the rate of development was
higher with increasing temperatures. Site 1 and Site 2 had no significant differences and were therefor grouped for the non-heated replicate. There were no significant differences between populations of the heated replicate, so no distinctions were made between populations (Table 1).
Table 1. Parameter estimates from the two maximum likelihood models of maximum development stage reached for the two replicates
Non-heated Estimate Standard error T-value P-value
Intercept 2.72093 0.02334 116.586 <0.001*** Log (Temp) 0.23005 0.01633 14.087 <0.001*** Site 2 -0.05554 0.03301 -1.683 0.0956 Site 3 -0.18274 0.03301 -5.537 <0.001*** Log (Temp)×Site 2 0.03459 0.02310 1.498 0.1373 Log (Temp)×Site 3 0.09690 0.02310 4.191 <0.001***
Heated Estimate Standard error T-value P-value
Intercept 2.82219 0.02230 126.55 <0.001***
Log (Temp) 0.18197 0.01561 11.66 <0.001***
16
Every family reached DS23 above 4.15 °C and there was no difference between the non-heated and heated replicate (Table A3), because the embryos in these temperature treatments had all reached DS23 before the heating-experiment had begun. Within the non-heated replicate there was a divergence between populations in 4.15 °C, with Site 3 reaching DS20 and Site 1 and Site 2 mostly (8/10) reached DS23. In 2.85 °C and 2.24 °C there was grouping in DS19-20 and DS17-18 respectively. In 1.61 °C Site 3 had lower DSmax with a range between DS13-15 while
Site 1 and Site 2 ranged between DS15-18. The heated replicate had no distinctions between populations, an overall greater range, and higher DSmax within the
temperature treatments 2 °C. In 1.61 °C the range was the same as in the non-heated replicate but with a higher DSmax. All but one family reached DS23 in 4.15 °C and
all but three in 2.85 °C (Figure 2).
3.2
Ecological critical thermal minimum
Survival was calculated as a proportion based on successes and failures to reach DS23 to establish LD50. Two maximum likelihood models were used, one per
replicate, since one of the replicates was heated.
There was no interaction between the temperature and populations, there was however a significant difference between Site 1 and Site 2. The heated replicate had no significant interactions or population effects; therefor the model for the heated replicate makes no distinction between populations (Table 2).
Table 2. Parameter estimates from the maximum likelihood survival to DS23 models of the non-heated and heated replicates.
Non-heated Estimate S.E. T-value P-value
Intercept -8.41881 0.70218 -11.989 < 0.001*** Temperature 1.69307 0.12899 13.125 < 0.001***
Site 2 1.01145 0.35017 2.888 0.00474**
Site 3 0.05092 0.35583 0.143 0.88650
Heated Estimate S.E. T-value P-value
Intercept -4.97521 0.40830 -12.19 < 0.001*** Temperature 1.16971 0.08948 13.07 < 0.001***
Figure 2. Maximum reached development stage within a family (egg clutch) of R. temporaria per temperature treatment of the two replicates. The non-heated replicate to the left (Site 1 and Site 2 was grouped), and the heated replicate to the right (no distinction between populations). The difference between the two replicates indicates that the critical thermal minimum lies between 2.24 and 4.15 °C
17
The non-heated replicate had a critical minimum temperature of 4.37 ± 0.14 °C for Site 2. Site 1 and Site 3 was grouped since there was not a significant difference between them which resulted in an ecological critical thermal minimum of 4.95 ± 0.10 °C. The ecological critical thermal minimum for the heated replicate was 4.25 ± 0.12 °C and not significantly different between populations (Figure 3).
3.3
Observed mortality
The mortality was also grouped on a family basis over the four physiological stages (Blastulation, Gastrulation, Neurulation, and Transparent fins) for both replicates and all the temperature treatments. There was little difference between the two replicates in four of the seven temperature treatments: 1.61, 5.37, 6.35, and 7.43 °C, but the remaining three were different on a family level (Figure A1, Figure A2). Within the non-heated replicate all 15 families in 2.24 °C had below 12 % survival, the same was true for embryos in 2.85 °C. In 4.15 °C there was a survival range between 0 – 80 % survival, with two families above 50 % survival, one family between 25 – 50 % survival and the remaining 12 families below 20 % survival (Figure A1).
Within the heated replicate at 2.24 °C had all 15 families below 12 % survival. In 2.85 °C there was a boost in survival with a range between 0 – 75 %, with five families between 50 – 75 % survival, four families between 25 – 50 % survival and six families below 10 % survival. In 4.15 °C there was an even greater range between 1 – 99 % survival with four families between 75 – 100 % survival, three families between 50 – 75 % survival, four families between 25 – 50 % survival, and four families between 0 – 25 % survival (Figure A2).
The mortality was also presented in a Site-specific frequency plot to illustrate the differences in mortality between the four previously set physiological stages (DS1-9, DS10-12, DS13-19, DS20-23; Figure A3).
Site 1 and Site 3 both had the bulk of mortality in the neurulation stage with 56 % and 58 % mortality respectively. Second highest mortality had the gastrulation stage with 27 % and 29 % mortality for Site 1 and Site 3 respectively. Site 2 had a different mortality structure, but with the same peak at the neurulation stage with a mortality of 36 %, the second highest mortality stage was however the transparent fins stage with 24 % mortality and the gastrulation stage had 21 % mortality (Figure A3).
Figure 3. Embryonic survival of R. temporaria under different temperature treatments. Non-heated (left, Site 1 & 3 grouped) and Non-heated (right, no distinction between populations) replicates with modelled mean (solid lines) survival to DS23 with corresponding confidence intervals (dotted lines) and calculated LD50 (dashed lines).
18
3.4
Algae Oophila sp. in Europe
Egg capsules of some amphibians are known to become green during the embryonic development. This phenomenon is known to happen in North America and Japan (Orr 1888, Kerney 2011, Muto et al. 2017). The visible green hue in these eggs are a unicellular alga belonging to the monophyletic group Oophila in Volvocales (Kim
et al. 2014). The alga Oophila is divided into five subclades, four of which are the
North American algae, and the fifth is the Japan subclade within the Oophila-clade (Kim et al. 2014, Muto et al. 2017). The symbiotic relationship between Oophila and the spotted salamander (Ambystoma maculatum) is the only known endosymbiotic mutualism between an alga and vertebrate (Kerney 2011). The other amphibians with symbiotic algae are all ectosymbiotic mutualisms, including R.
temporaria (Kerney 2011, Kerney pers. comm.). The amphibian embryos gain
oxygen and the algae gain nitrogen from the developing embryos (Kerney 2011, and references therein).
Algae was observed in eggs from Site 1 and Site 2, but not in Site 3. Samples were collected and shipped to the Kerney Laboratory for analysis of the partial 18S rDNA sequences that is consistent with the Oophila-clade. The alga was verified as Oophila and phylogenetic analyses are on-going (Kerney pers. comm.).
I checked the survival of the embryos from the start of neurulation (DS13) to the development of the labial tooth (DS23) over all temperatures. This subsample of development stages was used to ensure that no mortality before the alga bloom was in the calculations. I used a Fisher’s exact test for count data to check if there was a difference in survival (Table 3).
Table 3. Embryonic development success of R. temporaria were survival from development stage 13 to development stage 23 and failure were mortality between these stages.
The R. temporaria embryos with Oophila present had a significant higher mean survival 64 %, than the embryos without the alga 62 %, p-value = 0.0009 *** (Figure 4). This indicates that R. temporaria also benefits from this alga.
Fisher’s test Presence Absence
Success 6986 2558
Failure 3957 1641
Figure 4. Mean survival of R. temporaria embryos with Oophila present was 0.639, and mean survival with Oophila absent was 0.618. There is a significant higher mean survival for embryos with Oophila present, p-value = 0.0009***.
19
3.5
Comparisons with earlier studies
To be able to compare these results with previously done studies (Mikulski 1938, Douglas 1948, Moore 1951, Balcells 1956, Grainger 1959, Kobayashi 1962, Guyétant 1969, Beattie 1977) in this area I used the same models but with DS20 (gill circulation, Pollister and Moore 1937, Gosner 1960) as the maximum development stage. DS20 also serves a purpose with the emergence of the alga Oophila in Europe, since the embryos from the two populations with it hatched synchronised at DS19-20, contrasting with hatching around DS23-25 (Tattersall and Spiegelaar 2008, Lind
et al. 2008).
All the families developed to DS20 in temperatures above 2.85 °C of the non-heated replicate. All families developed to DS20 in temperatures above 2.24 °C of the heated replicate. The difference between the two replicates strongly indicates that the critical thermal minimum of R. temporaria lies in the vicinity of 1.61 °C ≤ X < 2.85 °C for DS20 (Figure 5).
LD50 to DS20 was also calculated since previously known critical thermal
minimum was measured to developmental stage 20 (gill circulation and hatching, Pollister and Moore 1937, Gosner 1960). There was no significant difference between Site 1 (4.48 ± 0.17 °C) and Site 3 (4.72 ± 0.17 °C), so they were pooled with a critical thermal minimum of 4.59 ± 0.12 °C. Site 2 was significantly lower with a critical thermal minimum of 3.46 ± 0.17°C for the non-heated replicate (Table A2). The heated replicate had no significant difference between populations and the critical thermal minimum was 3.97 ± 0.13 °C (Figure 6).
Figure 5. Maximum reached development stage of DS20 within a family (egg clutch) of R. temporaria per temperature treatment of the two replicates. Non-heated to the left (Site 1 and Site 2 was grouped), and the heated to the right (no distinction between sites). The difference between the two replicates indicates that the critical thermal minimum lies between 1.61 and 2.85 °C
Figure 6. Calculated LD50 up to DS20 for embryonic survival of R. temporaria for the two
replicates. Non-heated to the left (Site 1 and Site 3 was grouped), and the heated to the right (no distinction between sites). The mean was calculated and fitted with corresponding 95 % confidence intervals and LD50 were illustrated with a dotted line.
20
This study suggests that there is not one but several critical thermal minimums dependent on the development stage of R. temporaria, and that there is a genetically divergence on a local scale, visible on distances as short as 5.3 km.
4.1
Physiological critical thermal minimum
The population from Site 3 had a significantly lower DSmax than both populations
from Site 1 and Site 2, however the interaction of Site 3 and temperature was significantly higher (Table 1). This interaction indicates that the population in Site 3 had lower developmental performance in low temperatures then the other two populations, but that Site 3 might have a higher development rate in higher temperatures (Figure 2, Figure A1). The lower developmental performance could depend on the time of oviposition. Site 3 was a shaded pond with almost no sun exposure. Local sources said that R. temporaria do not spawn between late April and the start of May, and that held true for the sampling year. There might be selection towards later oviposition in Site 3 and with it a higher critical thermal minimum because of this, since ambient and water temperatures are higher later in the year. This interaction suggests a trade-off between high performance at higher temperatures vs. low performance in lower temperatures. This became more visible while modelling with developmental stage 20 as the maximum stage. Site 3 intersected Site 1 and Site 2, which indicates a steeper slope i.e. the model predicts that Site 3 will outperform the others in higher temperatures (Figure 5).
Start of oviposition in 2018 was 10 days earlier just 8.5 km north, at Site 1 (high sun exposure) compared to Site 3, and 6 days earlier 5.3 km north-west at Site 2 which had intermediate sun exposure but was situated in a basin. I expected the high exposed pond have a larger temperature variance, the low exposed and shallow pond to have lower temperatures early in the year with a fast warm-up rate, and intermediate exposed pond connected with a large body of water situated in a basin is expected to have a lower mean temperature and narrower temperature range. The population from Site 1 behaved like thermal-generalists with intermediate survival in all temperatures (regards to the other populations). Site 2 and Site 3 both follow the thermal-specialist model better with Site 2 specialising towards lower temperatures and Site 3 towards higher temperatures (Figure 2, Figure 5, Richter-Boix et al. 2015).
The heated DSmax replicate showed no significant differences between populations
or interactions between temperature and populations (Table 1). The difference between the two replicates illustrates temperature thresholds for development stages (Figure 2). In 2.24 °C all the families reached DS17 – DS18, and with heating some reached DS23. In 2.85 °C all families except one from Site 1 (DS20) was in DS19
21
and with the heating 12 families developed to DS23 and 3 stopped at DS20. In 4.15 °C all families developed to DS23 except one from Site 3 (DS20) post heating (Figure 2). This shows that embryos hit the threshold temperatures for the development stages but that they could resume development when the temperatures were increased. Twelve families from 2.85 °C and 14 of 15 families from 4.15 °C reached development stage 23 when the temperature was increased to 10.37 °C (Figure 2).
Development slows down to a near halt around development stage 20 at 2.85 °C. In 4.15 °C development also halts at stage 20 for Site 3, DS21 and DS22 for one family each from Site 1, and the rest reaches DS23. However, development starts up if temperatures are increased.
This strongly implies that the physiological critical thermal minimum to reach development stage 23 is in the vicinity of 2.24 °C ≤ X < 4.15 °C for embryos of R.
temporaria. According to the temperature readings in in Table A1 following the
maximum temperature readings of temperature treatment 2.24 °C (3.19 °C) and the maximum readings of 4.15 °C (4.59 °C), I derivate that the rather conservative physiological critical thermal minimum to use in e.g. degree-days calculation is 3.89 °C for R. temporaria to reach development stage 23 (Figure 2, Table A1). However, the minimum temperatures might lie closer to the truth of the physiological critical thermal minimum, because not all embryos expired. That temperature would be 2.41 °C with a range of 1.29 – 3.53 °C.
Another temperature threshold is at ≤ 2.85 °C for development stage 19-20, and ≤ 2.24 °C to reach development stage 17-18 (Figure 2). At 1.61 °C the spread is too wide to say anything, but the embryos all entered neurula (Figure A3).
The physiological critical thermal minimum to reach development stage 20 follows the same reasoning and I argue that 2.88 °C (maximum temperature range: 2.41 – 3.35 °C) should be used (Figure 5, Table A1). But if the minimum is to be considered it might be 1.37 °C with a range of 0.72 – 2.01 °C.
4.2
Ecological critical thermal minimum
I choose to use LD50 as a measurement for a viable population, therefore the
ecological critical thermal minimum will be the temperature where 50 per cent of the population survives. The population from Site 2 had a significantly lower ecological critical thermal minimum than populations from Site 1 and Site 3 (Table 1). This adaptation could be because of the lower heat-up rate on Site 2, i.e. it is a slower system then the other two sites. Site 2 is an old clay quarry and I assume that all the amphibians colonialized after 1977, it is therefore a relatively young population and gene inflow might have something to do with it.
The ecological critical thermal minimum that was produced with LD50 was 4.37 ±
0.14 °C for Site 2 and 4.95 ± 0.10 °C for Site 1 and Site 3. After I heated half of the replicate there is no significant difference between the populations, the calculated ecological critical thermal minimum was 4.25 ± 0.12°C. The mortality decreased in two temperature treatments; 2.85 °C and 4.15 °C, this decrease in mortality is expected, but there was no decrease in mortality in 2.24 °C. This indicates that temperatures below 2.85 °C (read 2.24 °C) is not something embryos of R.
temporaria can withstand for > 49 days.
Mortality was recorded up to development stage 20 (gill circulation, Pollister and Moore 1937, Gosner 1960), and the same models was applied to calculate where LD50 intersected the temperature. This was done to be able to compare these results
to results from 1977 and before, where development stage 20 was used as the maximum stage (e.g. Beattie 1977, Moore 1951, Douglas 1948).
22
Site 2 had a significantly lower critical thermal minimum to development stage 20, same as with development stage 23. The heated replicate had no significant difference between populations (Table A2). When development stage 20 was used as the maximum development stage there is as much as 1.13 °C difference the population at Site 2 compare with populations from Site 1 and Site 3. The populations from Site 1 and Site 3 had a pooled critical thermal minimum of 4.59 ± 0.12 °C and the population from Site 2 had a critical thermal minimum of 3.46 ± 0.17 °C and the heated replicate had a critical thermal minimum of 3.97 ± 0.13 °C (Figure 6).
I think that using development stage 20 as the end of embryonic life-stage makes sense. The usage of development stage 23 as an end (this study, Lind et al. 2008) or development stage 25 (e.g. Laugen et al. 2002a) is technically correct, but with the emergence of Oophila algae in Sweden (perhaps larger range in Europe) the embryos will change their behaviour towards more synchronised hatching at development stage 20 (pers obs, Kerney 2011). And with synchronised hatching come earlier sun-basking and grouped thermal-regulation behaviour of the embryos (Savage 1961). There were some problems with mortality numbers for the low temperatures in the non-heated replicate is that there was a fungi invasion. The fungi were removed mechanically for 10-15 days, but it was ultimately too effective, and the embryos perished. Fungi infestations are common on frog embryos in low temperatures (Waldman 1981).
4.3 Method
The usage of “The simplified table for staging anuran embryos and larvae with notes on identification” by K. Gosner (1960) gives way for several challenges during experiments with European anurans. Gosner (1960) cites several well-known authors such as Volpe, Shumway, and in extension Pollister and Moore which in turn had based some of their work on Moore’s papers (Gosner 1960 and references therein). One thing all these authors had in common is that they all worked with North American anurans, more specifically mainly temperate anurans. Another thing to keep in mind is that the experiment and stage “construction” were made in water that was 18 °C. When one is checking stage development in colder waters such as 1 – 7 °C, developmental stages have a way to flow together and intertwine. I argue that as simple and easy to use the “Gosner stages” are, they are flawed in more ways than one. It should be noted that these issues exist in low temperatures and in European anurans. One good example of this is Gosner stage 20 which is defined as when the embryos have gill circulation (GS18 – 23) and the event of hatching takes place (GS17 – 20). Gill circulation starts at GS20 but that is highly dependent on temperature, I had massively reduced gill development in temperatures 1 – 3 °C i.e. gill circulation was not visible, there was a continuous O2 flow from the pores in the
skin however (pers obs.). The event of hatching is also attributed to GS20, this makes sense in North American temperate anurans because a lot the study species have a symbiotic alga that synchronises hatching in these species (Tattersall and Spiegelaar 2008, Kerney 2011) and which is currently unknown in Europe (Savage 1961). GS19 is established as the development stage where there is a heartbeat, this physiological event did not occur until the equivalent of DS21 (transparent cornea) in R.
temporaria in low temperatures. The practical usage of this is to use the Pollister and
Moore’s (1937) table of development for Rana sylvatica and assert the shape of the embryo after muscle movements have occurred as DS19. These are all major events in the embryonic development: gill circulation, heartbeat, hatching (Although Savage (1961), argued that hatching is a minor life-history trait in R. temporaria).
23
Gosner attributed GS25 as the end of the embryonic stages because of the feeding nature of the now formed tadpoles. However, to avoid ethical issues I strongly suggests that GS23 set as the end of the embryonic period to ensure that there is no feeding behaviour because of individual rates of development.
Beattie (1977) found two different critical thermal minima for “lowland” and “highland” populations of R. temporaria in England: 3.8 and 2.8 °C respectively, this study such as all before it used DS20 as a stopping point. Beattie concluded that there was a difference in the critical thermal minimum in relationship to altitude. This is however not only true dependent on altitude. I show in this study that there is also a significant local difference (Figure 5, Figure 6). What this difference might depend on is another issue. The more I read about the critical thermal minimum of amphibians: anurans: North American temperate anurans; European temperate anurans, the more convinced I become of the problems with trying to conclude a single temperature as the threshold temperature. Setting one temperature as the critical thermal minimum on any organism seems like an impossible task. I choose
R. temporaria for a multitude of reasons: amphibians are highly susceptible to
changing temperatures and other abiotic changes, and it is sessile in most of the embryonic stages etc. But as I showed in this study there is multiple critical thermal minimum dependent on the developmental stages of the individual and which population the embryo originates from. Grainger (1959) suggested that gastrulation is the most vulnerable stage of development in R. temporaria regarding cold-spells, however I would argue that neurulation (and early organogenesis Gosner stage 13 – 19, Gosner 1960) is the most suggestive stage when talking about cold-induced mortality (Figure A3). Fluid-filled abdomen was by far the most observed abnormality, but this was seemingly random, and affected individual embryos across all different temperature treatments. There was however an observed trend in the lower temperatures that the development of the gills was reduced. I can only speculate in the why of this. My hypothesis is that the oxygen levels in the cold water were at the level that gills were not required to fully develop because of the partial oxygen pressure fulfilled the embryos oxygen needs for development (oxygen saturated water). Moore (1951) observed the same trend in low temperatures. With the colonization of algae in the clade Oophila on so far, a known local scale in Sweden comes old questions in new light. Should the embryonic life-stage in nature be up to developmental stage 20 and not stage 23-25. Is this true for other populations in Europe, or other species of amphibians? Is this divergence in critical thermal minimum between populations only present around latitude 59°? Is this thermal minimum divergence dependent on Oophila? Further studies should focus on these questions.
4.4
Conclusions
I would strongly suggest that the physiological critical thermal minimum of 3.89 °C (maximum temperature range: 3.19 – 4.59 °C) is to be used in degree-days calculations if the end of the embryonic development were to be development stage 23. The ecological critical thermal minimum differs between population on a local scale, 4.37 °C and 4.95 °C for 50 per cent of the populations to survive. However, with the emergence of Oophila the results could be different. The physiological critical thermal minimum could be as low as 2.88 °C (maximum temperature range: 2.41 – 3.35 °C) and the ecological could be between 3.46 °C – 4.59 °C, depending on the population.
24
Angilletta MJ. 2009. Thermal adaptation: a theoretical and empirical synthesis. New York (NY): Oxford University Press.
APHA. (1985). Standard methods for the examination of water and wastewater, 16th ed. American Public Health Association, Washington, D.C.
Atlas M. 1935. The effect of temperature on the development of Rana pipiens. Physiological Zoology. 8:290-310.
Bachmann K. 1969. Temperature adaptations of amphibian embryos. The American Naturalist. 103:115-130.
Balcells ER. 1956. Estudio morfológico biológico y ecologico de Rana temporaria L. Publnes. Inst. Biol. Apl. 24:81-121.
Beattie RC. 1977. Studies on the biology of the common frog Rana temporaria
temporaria (linnaeus) with particular reference to altitude. Durham theses, Durham
University. http://etheses.dur.ac.uk/8333/
Cross HZ, Zuber MS. 1972. Prediction of flowering dates in maize based on different methods of estimating thermal units. Agron. Journal. 64:351-355.
Douglas R. 1948. Temperature and Rate of Development of the Eggs of British Anura. Journal of Animal Ecology. 17: 189-192.
Eriksson P. 2018. Embryonic development of anurans with growing degree-days as an explanatory factor. Bachelor thesis, Swedish University of Agricultural Sciences. Fog K, Schmedes A, de Lasson DR. 1997. Nordens padder og krybdyr. G. E. C. Gad, Copenhagen.
Gosner KL. 1960. A Simplified Table for Staging Anuran Embryos and Larvae with Notes on Identification. Herpetologica. 16:183-190.
Grainger JNR. 1959. The effect on constant and varying temperatures on the developing eggs of Rana temporaria L. Zool. Anz. 163:267-277.
Guyétant R. 1969. Influence du facteur temperature surle development embryonnaire de Rana temporaria L. et Rana dalmatina B. B. vie. Milieu. 20:231-241.
Hertwig O. 1898. Über den Einfluss det Temperatur auf die Entwicklung von Rana
fusca und Rana esculanta. Archiv für Mikrosk. Anat. 51:319-382.
25
Hitchings SP, Beebee TJC. 1997. Genetic substructuring as a result of barriers to gene flow in urban Rana temporaria (common frog) populations: Implications for biodiversity conservation. Heredity. 79:117-127.
Huey RB, Stevenson RD. 1979. Integrating thermal physiology and ecology of ectotherms: discussion of approaches. Am. Zool. 19:357-366.
Johnson D, Bessin R, Townsend L. 1994. Predicting insect development using degree days. ENTFACT-123. University of Kentucky, Collage of Agriculture. Kerney R. 2011. Symbioses between salamander embryos and green algae. Symbiosis. 54: 107-119.
Kim E, Lin Y, Kerney R, Blumenberg L, Bishop C. 2014. Phylogenetic analysis of algal symbionts associated with four North American amphibian egg masses. PloS One. 9: e108915.
Kobayashi M. 1962. Studies on reproductive isolation mechanisms in Brown frogs. 1. Development and inviability of hybrids. J. sci. Hiroshima Univ., Ser. B, Div. 1. 20:147-156.
Kuzmin, S. et al. 2009. Rana temporaria. The IUCN Red List of Threatened Species,2009:e.T58734A86470817.
http://dx.doi.org/10.2305/IUCN.UK.2009.RLTS.T58734A11834246.en
Laugen AT, Laurila A, Merila J. 2003a. Latitudinal and Temperature-dependent Variation in Embryonic Development and Growth in Rana temporaria. Oecologia. 135:548-554.
Laugen AT, Laurila A, Räsänen K, Merilä J. 2003b. Latitudinal countergradient variation in the common frog (Rana temporaria) development rates – evidence for local adaptation. Journal of Evolutionary Biology. 16:996-1005.
Lind MI, Persbo F, Johansson F. 2008. Pool desiccation and developmental thresholds in the common frog, Rana temporaria. Proc. R. Soc. B. 275:1073-1080. Laurila A, Karttunen S, Merilä J. 2002. Adaptive phenotypic plasticity and genetics of larval life histories in two Rana temporaria populations. Evolution 56:617-627. Loman J. 2016. Breeding phenology in Rana temporaria. Local variation is due to pond temperature and population size. Ecology and Evolution. 6: 6202-6209. Martin TL, Huey RB. 2008. Why “suboptimal” is optimal: Jensen’s inequality and ectotherm thermal preferences. The American Naturalist. 171: 102-118.
Mikulski JS. 1938. Experimental studies in thermal ecology of developing eggs of some amphibians (Rana, Bufo, Pelobates). Acad. Pol. Sci. Let. Cracovie, series B. 2:23-45.
Moore JA. 1939. Temperature tolerance and rate of development in the eggs of amphibia. Ecology. 20:459-478.
Moore JA. 1951. Hybridization and embryonic temperature adaptation studies of
26
Muir AP, Biek R, Mable BK. 2014. Behavioural and physiological adaptations to low-temperature environments in the common frog, Rana temporaria. BMC Evol. Biol. 14:110.
Muto K, Nishikawa K, Kamikawa R, Miyashita H. 2017. Symbiotic green algae in eggs of Hynobius nigrescens, an amphibian endemic to Japan. Phycological Research. 65: 171-174.
Neuheimer AB, Taggart C. 2007. The growing degree-day and fish size-at-age: the overlooked metric. Canadian Journal of Fisheries and Aquatic Sciences. 64: 375-385.
Orr H. 1888. Note on the development of amphibians, chiefly concerning the central nervous system; with additional observations on the hypophysis, mouth, and the appendages and skeleton of the head. Quart. Jour. Mier. Sci., N.S. 29: 295-324. R Core Team (2018). R: A language and environment for statistical computing. R Foundation for Statistical Computing, Vienna, Austria. URL: https://www.R-project.org/.
Richter-Boix A, Katzenberger M, Duarte H, Quintela M, Tejedo M, Laurila A. 2015. Local divergence of thermal reaction norms among amphibian populations is affected by pond temperature variation. Evolution. 69: 2210-2226.
tSavage RM. 1961. The ecology and life history of the common frog (Rana
temporaria temporaria). Sir Isaac Pitman & Sonsm Ltd. London.
Scott AW, Pithart D, Adamson JK. 2008. Long-term United Kingdom trends in the breeding phenology of the common frog, Rana temporaria. J. of Herpetology. 42:89-97.
Snover ML, Adams MJ, Ashton DT, Bettaso JB, Welsh Jr. HH. 2015.Evidence of counter-gradient growth in western pond turtles (Actinemys marmorata) across thermal gradients. Freshwater Biology. 60:1944-1963.
Ståhlberg F, Olsson M, Uller T. 2001. Population divergence of developmental thermal optima in Swedish common frogs, Rana temporaria. Journal of Evolutionary Biology. 14: 755-762.
Tattersall GJ, Spiegelaar N. 2008. Embryonic motility and hatching success of
Ambystoma maculatum are influenced by a symbiotic alga. Can. J. Zool. 86:
1289-1298.
Volpe PE. 1957. Embryonic temperature tolerance and rate of development in Bufo
valliceps. Physiological Zoology. 30:164-176.
27
I would like to express my utmost gratitude and appreciation to my two supervisors Göran Hartman and Ane Laugen for their continuous help and support.
I would also like to thank Tomas Pärt and the Institution of Ecology at the Swedish University of Agricultural Sciences for supplying laboratory space, and their hospitality, Anssi Laurila and Katja Räsänen for equipment and chemicals loans and Ryan Kerney (and Lab) for the help regarding Oophila.
Finally, I would like to thank Stiftelsen Oscar och Lili Lamms Minne for the financial support.
28
Appendix 1
F ig u re A 1 . Sur vi val of t he non -he at ed r epl ic at e gr oupe d by f am il ie s ( n= 15) , ov er t he f our phy si ol ogi cal s tage s bl as tul a, g as tr ul a, ne ur ul a, a n d t rans par ent f ins , f or al l t he t em pe rat ur e t re at m ent s. R ed c ol our l ine s ar e f am il ie s w it hi n Si te 1, gr ee n i s f or Si te 2 and bl ue ar e f or Si te 3.29 F ig u re A 2 . Sur vi val o f th e h ea te d r ep lic a te gr oupe d by f am il ie s ( n= 15) , ov er t he f o ur phy si ol ogi cal s tage s bl as tul a, gas tr ul a, ne ur ul a, and t rans pa re nt f ins , f or al l t he t em pe rat u re t re at m ent s. R ed c ol our l ine s ar e f am il ie s w it hi n Si te 1, gr ee n i s f or Si te 2 and bl ue ar e f or Si te 3.
30
Figure A3. Frequency mortality for the physiological grouping of developmental stages with grouped mortality over the three populations: Site 1, Site 2 and Site 3 for the non-heated replicate.
No. Mean Median S.D. Max Min
1 1.61 1.62 0.378 2.41 0.72 2 2.24 2.30 0.396 3.19 1.29 3 2.85 2.94 0.394 3.35 2.01 4 4.15 4.27 0.271 4.59 3.53 5 5.37 5.46 0.320 5.88 4.82 6 6.35 6.42 0.279 6.86 5.83 7 7.43 7.43 0.088 7.57 7.18 8 10.37 - - - -
Table A1. Eight temperature treatments with corresponding mean, median, standard deviation, maximum, and minimum temperatures [°C].
31
Table A2. Parameter estimates from the four models that was calculated to development stage 20.
Table A3. Tukey multiple comparisons of means 95% family-wise confidence level of ANOVA, maximum development stage over temperature treatments. Significant levels; p<0.001 ***, 0.01 **, 0.05 *. Temperature treatments Difference mean Lower CI Upper CI P-value adjusted Significant levels 2.26 - 1.65 2.20 1.30 3.10 0.0000000 *** 2.85 - 1.65 3.67 2.77 4.56 0.0000000 *** 4.15 - 1.65 6.30 5.44 7.23 0.0000000 *** 5.37 – 1.65 7.53 6.64 8.43 0.0000000 *** 6.35 – 1.65 7.53 6.64 8.43 0.0000000 *** 7.42 – 1.65 7.53 6.64 8.43 0.0000000 *** 2.85 – 2.26 1.46 0.57 2.36 0.0000689 *** 4.15 – 2.26 4.13 3.24 5.03 0.0000000 *** 5.37 – 2.26 5.33 4.44 6.23 0.0000000 *** 6.35 – 2.26 5.33 4.44 6.23 0.0000000 *** 7.42 – 2.26 5.33 4.44 6.23 0.0000000 *** 4.15 – 2.85 2.67 1.77 3.56 0.0000000 *** 5.37 – 2.85 3.86 2.97 4.76 0.0000000 *** 6.35 – 2.85 3.86 2.97 4.76 0.0000000 *** 7.24 – 2.85 3.86 2.97 4.76 0.0000000 *** 5.37 – 4.15 1.20 0.30 2.10 0.0020710 ** 6.35 – 4.15 1.20 0.30 2.10 0.0020710 ** 7.42 – 4.15 1.20 0.30 2.10 0.0020710 ** 6.35 – 5.37 0.00 -0.90 0.90 1.0000000 7.42 – 5.37 0.00 -0.90 0.90 1.0000000 7.42 – 6.35 0.00 -0.90 0.90 1.0000000
DSmax Estimate SE T-value P-value
Intercept 2.79281 0.01692 165.073 <0.001 ***
Temperature 0.11657 0.01184 9.847 <0.001 ***
Site 3 - 0.16278 0.02930 -5.555 0.0021 ***
Temperature*Site 3 0.09640 0.02051 4.701 0.0203 ***
DSmax Heated Estimate SE T-value P-value
Intercept 2.84630 0.01497 190.09 <0.001 ***
Temperature 0.08864 0.01048 8.46 <0.001 ***
LD50 Estimate SE T-value P-value
Intercept -6.3105 0.5025 -12.557 <0.001 ***
Temperature 1.3740 0.1018 13.503 <0.001 ***
Site 2 1.5364 0.3033 5.066 0.0045 ***
LD50 Heated Estimate SE T-value P-value
Intercept -4.28568 0.39855 -10.75 <0.001 ***


![Table A1. Eight temperature treatments with corresponding mean, median, standard deviation, maximum, and minimum temperatures [°C]](https://thumb-eu.123doks.com/thumbv2/5dokorg/3043636.6059/30.892.171.742.769.977/temperature-treatments-corresponding-standard-deviation-maximum-minimum-temperatures.webp)

