Department of Animal Nutrition and Management
Effects of red and blue LED light on feed
intake, feed selection and milk yield in dairy
cows
Maria Bunu
Effects of red and blue LED light on feed intake, feed selection
and milk yield in dairy cows
Effekter av rött och blått LED ljus på foderintag, foderselektion och mjölkmängd hos mjölkkor
Maria Bunu
Supervisor: Sigrid Agenäs, Swedish University of Agricultural Sciences, Department of Animal Nutrition and Management
Examiner: Horacio Gonda, Swedish University of Agricultural Sciences, Department of Animal Nutrition and Management
Credits: 30 credits
Level: Second cycle, A2E
Course title: Independent project in Animal Science
Course code: EX0870
Programme/education: Animal Science
Course coordinating department: Department of Animal Nutrition and Management
Place of publication: Uppsala
Year of publication: 2019
Cover picture: Maria Bunu
Online publication: https://stud.epsilon.slu.se
Keywords: Sorting, Particle size, 2-screen PSPS, roughage
Swedish University of Agricultural Sciences Faculty of Veterinary Medicine and Animal Science
The aim of this study was to evaluate how red and blue LED light during the daytime affects dry matter intake, feed selection, and milk yield in dairy cows. Ten multipa-rous pregnant Swedish Red cows in post-peak lactation were used. Cows were housed in a tie stall barn. They were subjected to a 33-day red or blue LED light treatment during a long day photoperiod with 16 hours day and 8 hours night. Cows were fed silage and concentrates separately. Silage was fed three times a day ensuring ad
libi-tum intake with 5-10% orts. Concentrate was fed four times per day. Samples of
si-lage were collected thrice a day and individual orts were collected at the end of the day and at the end of the night. Data for eating behaviour and milk yield was collected five days before and five days after the treatment period. Eating behaviour was de-termined using the difference in distribution of fractions of different straw length in the silage that was fed and orts during daytime and night time. A 2-screen Penn State Particle Separator (PSPS) (19mm and 8mm) with a solid bottom pan was used to determine distribution of large, medium and short silage fractions. Treatments did not affect total DMI. Overall, cows sorted for the large fractions, against the medium and short fractions. During the LED period there was a difference (P<0.001) in sort-ing between Red and Blue cows dursort-ing the daytime. Cows on the Red LED light sorted for the short fractions during daytime. Blue cows showed different sorting (P<0.05) during day and night. Their sorting for the large fractions was more pro-nounced during daytime than night. Milk yield did not change during the trial and did not differ between the Red and Blue groups. In conclusion, sorting activity was greater during the daytime in the LED period, which could have been influenced by the LED light. Interestingly cows seem to have better vision in red than blue LED light. Furthermore, it also possible that the LED light maintains milk yield, since no change was observed during the four-week trial in post peak lactation.
Keywords: sorting, particle size, 2-screen PSPS, roughage
Syftet med studien var att utvärdera hur rött och blått LED-ljus påverkar foderintag, foderselektion och mjölkmängd hos mjölkkor. Tio dräktiga kora v rasen Svensk Röd Boskap i andra eller högre laktation ingick i studien. Korna inhystes i en stallavdel-ning för uppbundna kor. Behandlingarna var 33 dagar med rött eller blått LED-ljus under 16 timmar dag och svagt ljus från lysrör under åtta timmar på natten. Korna utfodrades med ensilage i fri tillgång med 5-10 % rester. Ensilagegivan fördelades på tre utfodringstillfällen och koncentrat på fyra tillfällen. Ensilageprover togs tre gånger per dag och individuella foderrester vägdes och provtogs i slutet av dagen och i slutet av natten under fem dagar innan och fem dagar efter behandlingsperioden. Ätbeteende beskrevs som skillnaden i strålängdsfraktioner mellan utfodrat ensilage och foderrester. Ensilagets strålängd separerades i fraktionerna kort, medium och lång med en Penn State partikelseparator (19 och 8 mm). Det var ingen skillnad mel-lan behandlingarna i torrsubstansintag. Korna sorterade för lång strålängd, emot me-dium och korta strån. Under LED-ljusperioden sorterade kor som behandlades med rött ljus för korta strålängd under dagen (P<0.001). Korna som behandlades med blått ljus visade mer omfattande selektion för den långa strålängden på dagen än på natten (P<0.05). Mjölkmängden förändrades inte under försöksperioden och skiljde heller inte mellan grupperna. Sammanfattningsvis sorterade korna mer uttalat under dagen än natten under LED-perioden. Det verkar som att korna såg bättre i rött än blått dagsljus. Det är möjligt att LED-ljuset stimulerade mjölkmängd eftersom mjölk-mängden inte förändrades under försöket trots att korna hade passerat topplaktation.
Nyckelord: foderselektion, partikelstorlek, strålängd, grovfoder
My abiding gratitude to the following people and institution, whose contribu-tions made this study a success: Special thanks to my supervisor, Sigrid Agenäs for the valuable continuous help in my research and moral support during my difficult moments. Torsten Eriksson for the help in understanding the particle separator box and choosing samples for chemical analysis. Mats Pehrsson for allowing me to use your Penn State Particle Separator box. Sofia Lindkvist for the help in understanding light measurements and for help in the barn. Gunilla Helmersson for the help in the barn. Mwenya Mubanga for believing in me and being there for me whenever I needed a shoulder to lean on. Special thanks to my family and friends for support. The Swedish Farmer’s foundation who funded the LED project. Finally, the Swedish In-stitute for granting me a full scholarship for my master studies.
List of tables 7
List of figures 8
Abbreviations 9
1 Introduction 11
2 Literature Review 13
2.1 Eating behaviour of dairy cows 13
2.2 Factors that influence eating behaviour 13 2.2.1 Eating behaviour of cows during day/night time 14
2.3 Sorting 14
2.3.1 What causes sorting 14
2.3.2 Ways of measuring sorting 15
2.3.3 Methods used for reducing sorting 15 2.4 Types of lights used in dairy and the newly available light sources 18
2.4.1 Advantages of LED lights 19
3 Materials and Methods 20
3.1 Animals, Housing and Diets 20
3.2 Treatment & Sampling 21
3.3 Light measurements 22
3.4 Feeding 23
3.5 Particle size separation 24
3.6 Chemical analysis 25
3.7 Calculations & Statistics 26
5.1 Methodology discussion 38
5.2 DMI 39
5.3 Sorting 39
5.3.1 Short feed particle fraction (<8 mm) 39 5.3.2 Medium fractions (<19 mm, ≥8 mm) 40 5.3.3 Large fractions (≥19 mm Fraction) 41
5.4 Milk yield 42
6 Conclusion & Recommendation 43
References 44
Table 1 Chemical composition of silage1 and silage fraction12 25 Table 2.Mean dry matter intake per hour and standard deviation 28 Table 3. Mean ME/ KgDM intake for the Red and Blue cows during baseline and
LED period1 28
Table 4. Mean ort in KgDM per hour and standard deviation 28 Table 5. Mean NDF % in orts for the Red and Blue cows during baseline and LED
period (expressed in DM basis)1 29
Table 6. Least square means sorting % for the Red and Blue cows in baseline and
LED period 31
Figure 1 Feed bunk with dividers to separate neighbouring cow’s feed and fronts that closes the front of the feed bunk. Photo by Sofia Lindkvist 21 Figure 2 Barn design with marked positions for cows in red and blue LED light
treatment 22
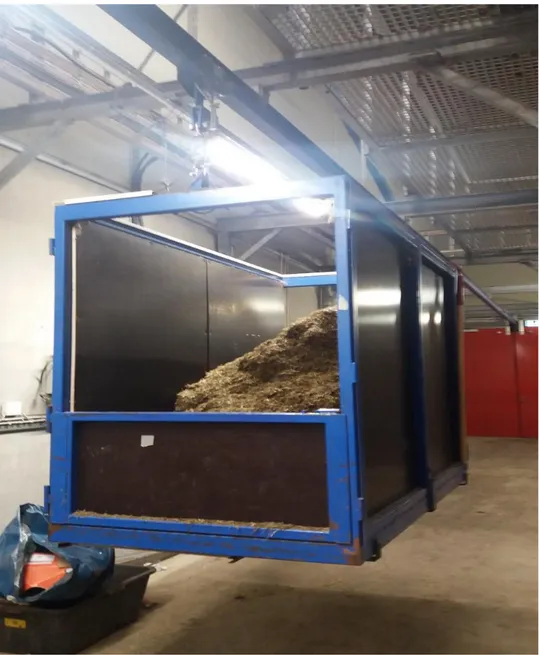
Figure 3 Silage handmade delivery cart 24
Figure 4 Dry matter intake (kg/day) day and night for the baseline and LED period. 27 Figure 5 Least square means sorting % of short fractions by cows in baseline
(fluorescent light) top graph and red/blue LED light bottom graph 32 Figure 6 Least square means sorting % of medium fractions by cows in baseline
(fluorescent light) top graph and red/blue LED light bottom graph 33 Figure 7 Least square means sorting % of large fractions by cows in baseline
(fluorescent light) top graph and red/blue LED light bottom graph 34 Figure 8 Least square means sorting % of short fractions by cows in baseline
(fluorescent light) red/blue LED light 35 Figure 9 Least square means sorting % of medium fractions by cows in baseline
(fluorescent light) red/blue LED light 35 Figure 10 Least square means sorting % of medium fractions by cows in baseline
(fluorescent light) red/blue LED light 36 Figure 11 Milk yield in Kg ECM per day/night time for the baseline and LED period 37
List of figures
LED PSPS
Light Emmiting Diode Penn State Particle Separator DMI
DM OM
Dry Matter Intake Dry Matter Organic Matter
NDF Neutral Detergent Fibre pef Physical effectiveness factor
peNDF Physically effective Neutral Detergent Fibre CP Crude Protein
ADF Acid Detergent Fibre TMR Total Mixed Ration ECM Energy Corrected Milk
Ruminant nutritionists formulate rations that are balanced according to the nutri-tional needs for the ruminant at a specific production level e.g. lactating dairy cow. The assumption being that the cows will eat everything they offered. However, cat-tle can select their feed, as they put together feed using their tongue and lips (re-viewed by Llonch et al., 2018). Sorting has been studied most in cows that are fed a total mixed ration (TMR) since it often is fed ad libitum which allows cows to pick the feed particles they prefer and still reach the total dry matter (DM) they want. The reports on TMR show that the most likely sorting is in favour of the short par-ticles (mostly concentrate) and against the long parpar-ticles (forages)(Leonardi & Ar-mentano, 2003). Feeding behaviour of the cow therefore, modulate the amount of feed she eats, the nutrients she gets, rumen health and ultimately her milk produc-tion.
Several methods have been used to try and reduce feed sorting in dairy cows (DeVries & Gill, 2012; Eastridge et al., 2011; DeVries et al., 2005; Leonardi et al., 2005). Recently, long day photoperiod has been reported that could lower feed sort-ing against long particles (MacMillan et al., 2018). In their study they used metal halide light (personal communication, Oba. 2019). Today advanced LED light equipment is available for commercial use. Their wavelength can be adjusted to the desired output (Morrow, 2008).
Blue and red wavelength light has attracted interest for dairy barns. The cow eye is not sensitive to red light (Sjaastad et al., 2016; Jacobs et al., 1998) and therefore red light has been suggested as an option for illumination when people need to work with the animals during a time of the day when the cows have night. In humans blue light is known to cause a carryover effect with increased activity also after the light is turned off (Tosini et al., 2016). If cows respond similarly to blue light it may be interesting to include blue light in the dairy barns in the late afternoon or evening in order to stimulate activity during the night. This is of particular interest for auto-matic milking systems since they require cow activity around the clock. Solutions for dairy barns that include periods of the day with more red or blue LED light are already available on the market, as we now have fixtures of white LED light. To our knowledge there is no data published yet about LED lights and their effects on feeding behaviour and milk production in dairy cows.
Therefore, this paper aims to evaluate how the red and blue LED lights during the day affects dry matter intake, feed selection, and milk yield in dairy cows. We hy-pothesize that feed sorting will not differ between LED (red and blue) and fluores-cent light and that selection will not differ between day and night. We also hypoth-esize that cows show a higher fed intake during the night when exposed to blue LED-light during the daytime.
2.1 Eating behaviour of dairy cows
Encouraging DMI to promote milk production is one of the primary objectives for dairy farmers. The daily eating time, selection, number of meals per day, duration and number of eating occasions per day are important aspects of feeding behaviour (Azizi, 2008).
2.2 Factors that influence eating behaviour
The environment, age of cattle, teeth condition, feed composition and processing influence eating behaviour (Albright, 1993). Just like grazing cattle, group housed cows synchronise their behaviour including eating when kept indoors (Azizi, 2008). Eating behaviour of cows is controlled by social interactions, management practises, the environment and health (Grant & Albright, 2001). Long ago dairy cows were thought to be crepuscular eaters, motivated by sunrise and sunset timing to go for grazing (Albright, 1993). However, DeVries and von Keyserlingk (2005) reported that fresh feed delivery timing had more influence on the feeding behaviour of dairy cows kept indoors, than the time of day. DeVries et al. (2005) found that daily eating time distribution changed following an increase in feed delivery frequency in group housed dairy cows. The first hour and half after fresh feed delivery is the period of peak eating activity (von Keyserlingk & Weary, 2010). Little effect on cow behav-iour was observed when feed push ups was done whilst there was still some feed in the trough (DeVries et al., 2003). The design of the feed trough also affects feeding behaviour as cows prefer eating from feed trough that allow their head to be in a natural grazing position than having their head in an elevated position (Albright, 1993).
2.2.1 Eating behaviour of cows during day/night time
Feeding more than once a day has been reported by DeVries et al. (2005) to increase time spent feeding late evening and early morning around 0600 to 2000 h. Also, day length or light may have an effect since supplementary light after evening milking increased eating time between 1600 h to 1900 h (Macmillan et al., 2018).
2.3 Sorting
Sorting for or against particle size fractions of the feed is referred to as feed sorting and it is known to occur in dairy herds (Gonzalez et al., 2015; Stone, 2004). Sorting is a part of feeding behaviour, but research on sorting has been focused on the con-sequences of the behaviour (e.g. on temporal nutrient distribution of feed left in the feeder) than the behaviour itself (von Keyserlingk & Weary, 2010). Leonardi and Armentano (2003) reported that cows select the components of a total mixed ration (TMR), in favour of short particles (grain) than longer particles (forages). The de-gree of sorting in favour of shorter particles is higher in primiparous cows than mul-tiparous cows (DeVries et al., 2011). For TMR feeding systems to work it is essen-tial that feed intake is the same as the feed offered. Sorting in favour of or against certain particle fractions will affect nutritional composition of the feed that is eaten and the feed remaining in the trough will divert from the offered feed as time pro-gresses after feed delivery (DeVries et al., 2005). If the ration was formulated to meet minimum requirements of the cow, sorting may affect physically effective par-ticles intake, chewing activity and giving rise to a reduction in rumen pH (Leonardi & Armentano, 2003). In group housing systems sorting by dominant cows will af-fect the subordinate cows too, as they will get access to feed with imbalanced nutri-ents (DeVries et al., 2007).
acidosis sorted for long particles of the diet and against shorter particle in a study by DeVries et al. (2008).
2.3.2 Ways of measuring sorting
Sorting can be measured chemically or physically thus assessing the differences in nutritional composition and particle size distribution in feed offered and that in orts. When only the chemical method is used, sorting is determined by comparing the NDF in delivered feed and that in orts, if the percentage in orts decreases or in-creases it represents sorting. Separator boxes are used for particle size distribution these are the Penn State Particle Separator (PSPS) and American Society of Agri-cultural and Biological Engineers (ASABE)/ Wisconsin Particle Size Separator (Crossley et al., 2018; Esmaeili et al., 2016; Maulfair & Heinrichs, 2010; DeVries
et al., 2007; Leonardi et al., 2005; Leonardi & Armentano, 2003). The PSPS
sepa-rator box size is portable, allows quick analysis, and easy to use than ASABE (Lammers et al., 1996). Hence, the PSPS is the commonly used separator box (Lammers et al., 1996). After using the separator, sorting is then calculated as de-scribed by Leonardi & Armentano, (2003) by observed/actual DMI per respective fraction that would be expressed as a percentage of the estimated DMI for that frac-tion as shown by the equafrac-tion;
Sorting % = 100 × (DM intake of fraction n/predicted DM intake of fraction n). Where n is the particle size of the fraction.
The observed intake per PSPS fraction is calculated as the difference of each PSPS fraction DM amount in offered TMR and that in orts. The estimated DMI per PSPS fraction is calculated as product of total diet DM intake by the cow, multiplied by DM percentage that specific PSPS fraction in the TMR offered to the cow. The sorting index, with values equal to 100 indicate no sorting, greater than 100 repre-sented sorting in favour, and below 100 reprerepre-sented sorting against a specific feed fraction (Leonardi & Armentano, 2003).
Sorting is avoided by feeding management, nutrition and housing (Miller-Cushon & DeVries, 2017).
2.3.3.1 Addition of water
Leonardi et al. (2005) used the addition of water to TMR altering DM from 80.8 to 64% (dry and wet) in chopped hay as forage. Both diets had 24% NDF, with 81% of the NDF from forages. Feeding was done twice daily ensuring 10-15% orts. Ort samples were collected for 5 days, dried and analysed for DM and NDF. Delivered feed TMR samples were analysed for DM, OM, CP, NDF, ADF and fatty acids. Two days samples were used for both orts and TMR diet for particle size distribution with the Wisconsin Particle Size Separator with 5 screens (26.9mm, 18mm, 8.98mm, 5.61mm, and 1.65mm). When feeding the wet diet, they found a reduction for sorting in favour of short fractions and reduced sorting against the large fractions whereas DMI was not affected.
Miller-Cushon and DeVries (2009) findings did not agree with Leonardi et al. (2005). In their study they observed an increase in sorting against large particles and a lowered DMI when they fed wet TMR (48% DM). Their treatment diets had dif-ferent DM from 58% (dry) to 48% (wet) by adding water. Both the wet and dry diet had 30%NDF, with 72% of the NDF from forages. However, their forage source in TMR were fermented haylage and corn silage. Feeding ad-libitum once daily ensur-ing 15% orts. Samples were collected for 7 days. Samples for particle size distribu-tion analysis were separated by a 3-screen PSPS (19, 8, and 1.18mm). Their findings agreed to Felton and DeVries (2010) who observed an increase in sorting against large fraction and reduction in DMI as more water was added to the TMR. The diets in their study had 60% DM (dry) control diet, they added water to control diet mak-ing two other diets with 54% DM (wet) and 48% DM (wetter). All diets had 33% NDF, with 69% of the NDF from forages. They used the same sources of forage for their TMR, particle separator, and feeding frequency (Miller-Cushon & DeVries,
Eastridge et al. (2011) had 5 TMR diets with same DM of approx. 65%, control with steam flaked corn, and four other diets with finely ground corn with or without liq-uid feed sugar source supplementation and coarsely ground corn with or without liquid feed sugar source supplementation. Finely ground corn feed with liquid sugar and coarsely ground corn with liquid sugar had 34% and 39%NDF, with 61% and 53% of NDF from forages respectively. Feeding was done twice per day ad-libitum ensuring 10% orts. TMR and ort collection was done daily, for 4 days. Composite samples for orts and TMR were made before analysis. Particle size distribution was done as in Miller-Cushon and DeVries (2009). They found no effect on sorting when 1.8% sugar in the diet was supplemented by liquid feed (Eastridge et al., 2011). DeVries and Gill (2012) however observed a decrease in sorting against long parti-cle when molasses-based liquid feed was added to TMR with 51%DM. In their study the diet with molasses had 30% NDF and the control had 29% NDF, with 73% and 78% of the NDF from forages respectively. They had 7 days data collection period. Feeding once per day ensuring 10% orts. Samples were analysed for DM, nutrient composition and particle size distribution. Particle size distribution was done as in Miller-Cushon and DeVries (2009). It is to be noted that the TMR in Eastridge et al. (2011) was too dry >60% DM which could have hindered the effect of liquid feed addition on sorting.
2.3.3.3 Feeding frequency
DeVries et al. (2005) investigated the effects of feeding frequency delivering feed once, twice, thrice and 4 times per day and feed push ups was done for all treatments. The feed had 36%NDF, with 72% of the NDF from the forages. Samples from TMR, push up and ort were collected for four days. Sorting was determined by NDF con-tent in TMR and that in orts. It was concluded that feeding twice reduced sorting against NDF than once per day. Endres and Espejo (2010) also have suggested that feeding twice a day reduces variation in NDF content of feed remaining in the bunk than feeding once, even though their study was not designed to perfectly report sort-ing. This agrees with Sova et al. (2013) who found that feeding twice per day re-duced sorting against large fractions than feeding once, with an increase in DMI and remaining TMRs’ NDF content in the feed bunk varied less for the whole day. When they measured sorting using both particle size distribution and NDF values respec-tively. In their study samples of TMR and orts were collected for seven days each, in two seasons winter and summer on 22 herds. The TMRs fed by the 22 farmers had similar forage sources alfalfa/grass haylage and corn silage.
However, in a recent study by Crossley et al. (2018) no effect was found on sorting or DMI, when low and high TMR feeding frequency was used (twice and 6). Feed-ing ad-libitum ensurFeed-ing 10% orts. The TMRs had 35% and 36%NDF, with 84% and 69% of the NDF from forages respectively. In their study samples of TMR and orts were collected for five days. Sorting was measured using 3-screen PSPS.
Therefore, feeding frequency can affect feed sorting however the contrasting results reported by Crossley et al. (2018) could have been brought about by the differences in methodology used.
2.3.3.4 Photoperiod management
Long day photoperiod (LP) 16 h light and 8 h darkness and short-day (SP) photo-period 8 h light and 16 h darkness treatments were used to test feed sorting behav-iour by Macmillan et al. (2018) they had 21 d light treatment followed by 3 days data collection for TMR and orts. Their light source was metal halides lights (per-sonal communication, Oba. 2019). NDF for their diet was 25.6%NDF, 56% of the NDF is from forages. The source of forages in their TMR was barley and alfalfa silage. The ort samples were pooled to form one sample per cow. Cows were fed once daily in the morning ensuring 5-10% orts. Particle size distribution was done the same as in Miller-Cushon and DeVries (2009) and sorting was calculated ac-cording to Leonardi & Armentano (2003). They observed that total eating time and total DMI was not different between the LP and SP groups. However, from 1600-1900h eating time increased for LP as cows favour eating in light. Sorting in favour of short particles was reduced, in addition to that cows increased intake of the large fractions even though overall, they were still sorting against the large fractions in the LP group than SP group. However, they did not measure sorting for period day or night but rather for the entire 24h.
the Haitz’ Law as projected by Steigerwald et al., (2002 cited in Morrow 2008) has come to action, that every decade their cost will decrease by a factor of 10 whereas their performance advances by factor of 20. Now they have become affordable and advanced white LED lights thereby increasing their potential use in animal houses commercially.
2.4.1 Advantages of LED lights
It is possible to adjust the light intensity and spectral composition of LED lights mimicking that of natural day sunrise and sunset (Yeh & Chung, 2009; Morrow, 2008), making it possible to control colour combinations e.g. green, blue and red. The lifespan of a LED light is longer than that of fluorescent lights, around 100 000h compared to 8000 h (Yen and Chung, 2007). Furthermore, LEDs thermal output is low hence saving energy, contains no mercury, has efficient photoelectric conver-sion and are easy to connect to digital control systems making photoperiod manage-ment easy (Yeh & Chung, 2009; Morrow, 2008), for example in dairy barns. Due to their long life span they have potential to decrease costs of production as they do not need regular replacement and cuts off labour costs and the often-high risk work task of replacing lights, since most barns have very high celling. In addition, the white LEDs produce light in the wavelength that cows can detect better, with peaks of emission around 460nm and 550 (Tosini et al., 2016; Jacobs et al., 1998). To our knowledge the effects of different light colour on eating behaviour has not been investigated.
3.1 Animals, Housing and Diets
The study was conducted at the Swedish Livestock Research Centre (Uppsala, Swe-den) from January to March 2019 and it was part of a larger project on effects of light wavelength on endocrinology, activity and milk production in dairy cows. The larger study included 20 pregnant multiparous Swedish red cows that were between 129-294 DIM with 20-25 kg daily milk yield at the onset of the study. Based on the pregnancy stage and the number of lactations the cows were blocked, and randomly assigned to one of two treatments. For the feed selection study, five cows were re-cruited from each treatment group. Inclusion criteria were that cows handled their water bowl without soaking the feed and that they ate without throwing a significant proportion of their feed out of the trough. Behaviours that were observed and were reasons for not including cows were: tossing feed to the front by action of moving head upwards or sideways after digging in feed, drinking water whilst leaving tongue or lips pushing the water release valve till it overflows into the feed trough and drinking water whilst the head is on the wrong position too far from the water
position like that of grazing when cows were eating feed. The barn had no access to natural day light.
Prior to the onset of the experiment, all cows were fed three different silages mixed together, one from whole crop barley, one 2nd cut grass and one with a mix of 3rd cut
grass (>50%) and clover (<50% clover) with the barn lighting program of 16 hours daylight and 8 hours night using fluorescents lights.
All animal handling and experimental procedures were approved by the Uppsala local ethics committee (Dnr 5.8.18-12172/2018).
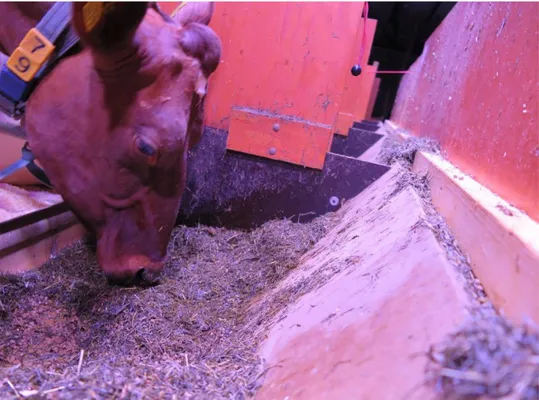
Figure 1 Feed bunk with dividers to separate neighbouring cow’s feed and fronts that closes the front of the feed bunk. Photo by Sofia Lindkvist
3.2 Treatment & Sampling
Cows had eleven days of acclimatisation to the experimental barn after moving there. During this period the light was provided by 14 fluorescent lights for daytime lighting, in a long-day photoperiod light programme with 16 hours light from 05:00 till 21:00 and only three of the 14 fluorescent lights were used during night-time (8 hours night from 21:00 till 05:00). These lights were switched on and off manually.
Baseline data was collected during the last five days of the acclimatization period. These samples are referred to as control samples.
During the 33 days treatment period red and blue LED light during daytime were tested. Test data was collected during the last five days of treatment period. LED light was provided by 22 Grow light LED lights (ELIXIA LX602G Heliospectra AB, Sweden) that were placed between cows (Figure 2).
3.3 Light measurements
Two methods were used to measure light - the lux meter and environmental field method (ELF). We used a Hagner Screenmaster lux meter, and a Jaz 2053 spectro-photometer with calibration 2018-09-10 respectively. Only vertical measurement was taken to ensure that every cow in the trial have the same light at her forehead. Measurements were taken at a height of 125cm in the middle of each feeding trough where the cows’ head will be (this amounts to 20 positions). For the fluorescent lights the daytime lighting varied from 87-397 lux and night light from 2.4- 139.4 lux. Using the spectrophotometer daytime light varied 0.72-4.97 𝜇𝑚𝑜𝑙 ∗ 𝑚−2∗ 𝑠−1 and night light had 0.02-1.47 𝜇𝑚𝑜𝑙 ∗ 𝑚−2∗ 𝑠−1 .
Red light in total had 31-35 𝜇𝑚𝑜𝑙 ∗ 𝑚−2∗ 𝑠−1 including 93 ± 2 % exclusively red light. Blue light 31-35 𝜇𝑚𝑜𝑙 ∗ 𝑚−2∗ 𝑠−1 including 84±1 % exclusively blue. For the night-time white LED light had 0.16 𝜇𝑚𝑜𝑙 ∗ 𝑚−2∗ 𝑠−1 with approx.10-14
3.4 Feeding
On the onset of the trial cows were fed silage from a single silo (silo 2) made up of 2nd cut grass. The chemical composition for this silage is shown in (Table 1). Ten
minutes prior feeding silage was mixed whilst adding minerals and salt using DeLa-val VSM10 mixer. The feed was then put into the handmade delivery cart whilst mixer is still running. The delivery cut was operated manually using rails and it had a built-in scale (Scale electronic unit WE 2108N16 combined with 2s-loadcell)
(Fig-ure 3). Concentrate was fed on top of the silage. Silage feeding was done thrice per
day at 05:45, 13:00 and 19:00 hours ad lib ensuring 5-10% orts, adjusted daily per individual, whereas concentrate was fed according to individual production four times per day at 06:10, 13:30, 16:30 and 19:30 hours. Cows did not have access to feed all 24h/day, we used an hour in the morning and another hour in the evening for removing orts.
Three silage samples per day were collected, one from each feeding time, morning, afternoon and evening. Samples of the fed silage were taken from different points in the feeding cart into a plastic bag. The sample was then split into two sub samples weighing 250g each for particle size separation and chemical analysis. The morning and afternoon silage samples were pooled to form one daytime silage sample. On the fifth day of data collection in each period (baseline/LED) an additional silage sample was taken for particle size separation and chemical analysis of each fraction. The daytime feed intake was 15.41±2.27 kgDM and 9.01±1.35 kgDM during night-time. Orts per cow were taken every day end at 18:00 and night end at 05:05. First orts were mixed manually whilst in the bunk, then handfuls were taken into a plastic (this initial sample was weighed) and the rest of the orts was removed from the bank into the electric waste cart machine Herborg with a built-in scale (Carlliden type 400 Nr 2287). The weight from the cart was recorded and added to the initial sample weight taken from the bank to have the total orts value per each respective cow. Then each cows’ initial sample was split into two 250g samples for particle size separation and chemical analysis. All sample were stored at -20˚C until further analysis.
Cows were milked between 06:15 -08:15 and 17:00 - 1900. Milk yield per cow was recorded automatically by hand milking machine (DeLaval DelPro MU480) at each milking. During five consecutive days in the beginning and end of the trial individ-ual milk samples were taken at morning and evening milking using the DeLaval sampling cups (product number 90636484). Samples were put in plastic bottles con-taining bronopol and kept in a refrigerator until determination of protein, lactose and fat content (Fourier transform infrared spectroscopy (FTIR) interferometer) and somatic cell count (fluorescence flow-cytometer) at Department of Animal Nutri-tion and Management laboratories SLU Uppsala.
five shakes. A shake moved the PSPS box forward and backwards on a flat surface over a 17 cm distance with enough force to make particles move horizontally on the surface of the sieve but not vertically jumping up and down so that we could avoid large fractions passing through the sieve to the small fractions sieve.
3.6 Chemical analysis
Samples for silage delivered were pooled per period control and LED having one for each. Orts samples were pooled per cow per day/night and period. Thus having 2 samples per cow per period control/LED. These samples were dried at 60°C over-night and grounded to pass through a 1-mm screen using a hummer mill. DM, ash and acid detergent fibre (ADF) was done according to AOAC (1990) and neutral detergent fibre (NDF) using method by Chai and Udén (1998), crude protein (CP) using Kjeldahl method. A 2520 Digestor, Kjeltec 8400 Analyser unit and 8460 sam-pler unit (all from Foss) was used. For NDF analysis sodium sulphite and α-amylase were used. In addition, for silage and silage fractions in-vitro organic matter digest-ibility was analysed using method by Lindgren (1979) and ME was calculated using the equation (0.16*VOS-1.91)*OM. All samples were analysed at the Department of Animal Nutrition and Management laboratories, Swedish University of Agricul-tural Sciences, Uppsala. The physical effectiveness factor (pef) for the silage was calculated as the proportion of DM retained on two PSPS sieves 19 mm and 8 mm. The physically effective NDF (peNDF) was calculated as a product of NDF in silage by pef on DM basis.
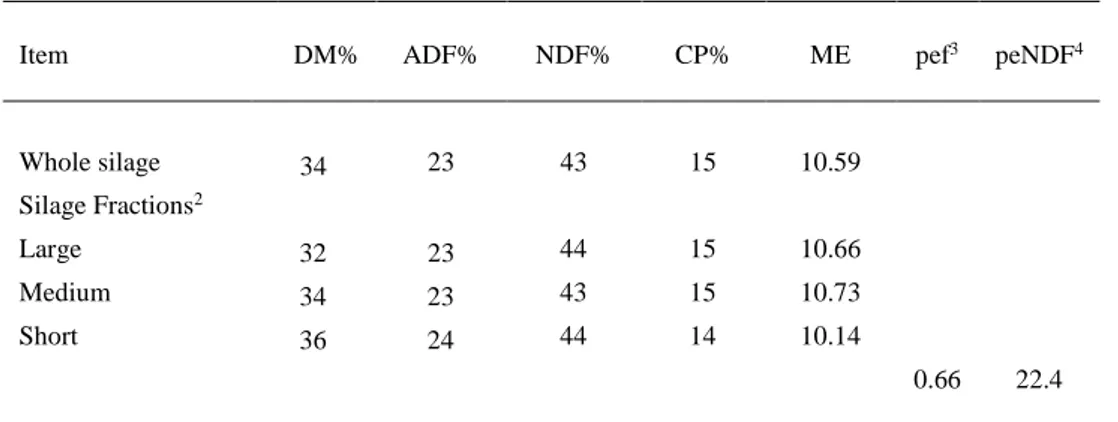
Table 1 Chemical composition of silage1 and silage fraction12
Item DM% ADF% NDF% CP% ME pef3 peNDF4
Whole silage 34 23 43 15 10.59 Silage Fractions2 Large 32 23 44 15 10.66 Medium 34 23 43 15 10.73 Short 36 24 44 14 10.14 0.66 22.4 1 DM at 103℃
2 Fraction distribution determined by 2-screen PSPS with 19 mm and 8 mm sieves and bottom pan separating fractions into large, medium and short fractions
3pef= Proportion of DM retained on two PSPS top sieves 4peNDF= pef *NDF in silage (DM basis)
3.7 Calculations & Statistics
The DM at 60℃ was used when calculating sorting. The degree of sorting was de-termined by calculating the sorting index as a ratio of observed/actual DMI per PSPS fraction that would be expressed as a percentage of the estimated DMI for the respective fraction (Leonardi & Armentano, 2003) as shown by the equation below:
Sorting % = 100 × (DM intake of particle size n/predicted DM intake of particle size n).
The statistical analyses were performed using the SAS software (ver. 9.2); SAS Inst. Inc., Cary, NC). Uncorrected means were calculated using PROC MEANS, and the tests of significance of fixed factors was performed using analysis of vari-ance (PROC MIXED). The statistical model included the fixed factors of treatment (RED/BLUE), time of the day (DAY/NIGHT), period (pre-experimental /experi-mental), and the 3-way interaction between these factors. The random effects of animal nested within treatment, and of date nested within period were also included in the statistical model. Residuals were tested for normality (PROC UNIVARI-ATE). Analysis of the variable 'sorting' was performed within 'size-strata' (per PSPS fraction). The calculations for mean; DMI/h, Ort/h, NDF in orts, ME, and all graph-ical illustrations were done by Microsoft Excel.
4.1 DMI
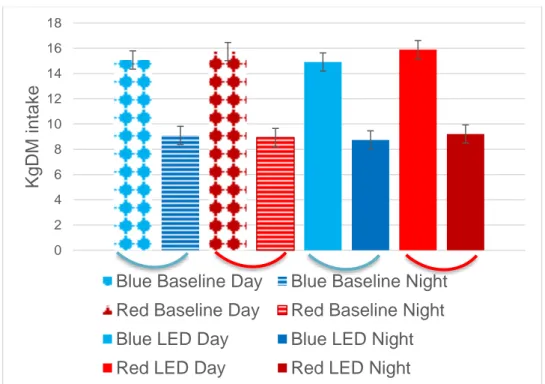
There was no difference in DMI between fluorescent and LED light or between red and blue LED light (Figure 4) and there were no interactions. The total intake was higher during the day than night (P<0.001) but the intake per hour was similar for both day and night (Table 2). The mean ME intake during daytime and night-time is presented on (Table 3).
Figure 4 Dry matter intake (kg/day) day and night for the baseline and LED period. 0 2 4 6 8 10 12 14 16 18
K
g
DM
int
a
ke
Blue Baseline Day
Blue Baseline Night
Red Baseline Day
Red Baseline Night
Blue LED Day
Blue LED Night
Red LED Day
Red LED Night
Table 2.Mean dry matter intake per hour and standard deviation
Mean DMI/h SD
Blue Baseline Day 1.25 ± 0.24
Red Baseline Day 1.31 ± 0.11
Blue Baseline Night 0.91 ± 0.11
Red Baseline Night 0.89 ± 0.12
Blue LED Day 1.24 ± 0.23
Red LED Day 1.33 ± 0.14
Blue LED Night 0.87 ± 0.18
Red LED Night 0.92 ± 0.14
DMI/h Day =Cow DMI Daytime/12h, Cow DMI/h Night=DMI Night time/10h. For each period data for 5 cows was averaged for the Red and Blue cows respectively.
Table 3. Mean ME intake for the Red and Blue cows in baseline and LED period during daytime and night-time1
BBD BBN RBD RBN BLD BLN RLD RLN
ME 80.50 71.21 80.98 60.17 78.27 67.43 84.45 63.05 1 ME= (0.16*VOS-1.91)OM
BBD-Blue Baseline Day, BBN-Blue Baseline Night, RBD-Red Baseline Day, RBN-Red Baseline Night BLD-Blue LED Day, BLN-Blue LED Night, RLD-Red LED Day, RLN-Red LED Night
Table 4. Mean ort in KgDM per hour and standard deviation
Mean ort/h SD
Blue Baseline Day 0.33 ± 0.19
Red Baseline Day 0.28 ± 0.12
Blue Baseline Night 0.26 ± 0.14
Red Baseline Night 0.30 ± 0.09
Table 5. Mean NDF % in orts for the Red and Blue cows during baseline and LED period during daytime and night-time (expressed in DM basis)1
BBD BBN RBD RBN BLD BLN RLD RLN
NDF % 47.24 48.46 45.19 48.51 43.89 43.78 41.75 44.07 1 DM at 103℃
BBD-Blue Baseline Day, BBN-Blue Baseline Night, RBD-Red Baseline Day, RBN-Red Baseline Night BLD-Blue LED Day, BLN-Blue LED Night, RLD-Red LED Day, RLN-Red LED Night
4.2 Sorting
There was interaction between the fixed effects of colour of light (Red/Blue), the time of day (Day/Night) and the time period (Baseline/LED) on sorting behaviour for all fractions (short P< 0.05, medium P<0.001, long P<0.001) (Figure 5-7).
4.2.1 Short fraction (<8 mm)
Overall, the cows sorted against the short feed fraction (Figure 8). During the base-line period, the Red and Blue cow groups already had differences in sorting before they were exposed to the LED lights P<0.01 and P<0.05 for red and blue respec-tively. Red cows sorted more against the short fractions during daytime than at night, when there was almost no sorting (86% and 98% respectively). Blue cows sorted against (92%) the short fractions but did not sort either for or against the short fraction (100%) at night (Figure 8). There was no change in sorting in the short fractions during the night time for either Red or Blue cows between the baseline and LED period. Furthermore, there was no difference in sorting of the short fraction during daytime between the baseline period and the LED period in the blue group. Red cows on the other hand, decreased their sorting against the short fraction during daytime in the LED light (P<0.01). Their sorting against short fractions decreased from 86% during baseline period to 102% in LED period. In the LED period, during night time Red and Blue cows did not differ in sorting against the short fractions. In the same period, the Red cows had difference (P<0.05) in sorting between day and night time, the same was for the blue cows (P<0.01). Red cows sorted for (102%) short fractions during daytime and sorted against (93%) the same fraction at night. Blue cows sorted against (82%) the short fraction to a greater extend during daytime than at night time (96%)(Figure 8). In LED period there was a difference (P<0.001)
in sorting between Red and Blue cows during the daytime. Red cows sorted less for the short fraction whilst the Blue cows sorted more against the same fraction
(Fig-ure 8).
4.2.2 Medium fractions (<19 mm, ≥8 mm)
Overall, the cows sorted against the medium fraction (Figure 9). There was no over-all effect of the LED light on sorting of the medium fraction, but the Blue cows showed different sorting of the medium fraction between day and night (P<0.001) during the baseline period but this was not seen in Red cows. In the LED period there was no difference in sorting of the medium fraction between day and night time.
4.2.3 Large fractions (≥19 mm)
Overall, the cows sorted in favour of the large fraction (Figure 10). No change in sorting was observed for the night time either for Red or Blue cows between the baseline and LED period. Blue cows had difference (P<0.05) in sorting of the large fraction between daytime in baseline and LED period. They did not sort for/against the long fractions during daytime in baseline period but in LED period they sorted for the same fraction (Figure 10). In the baseline period, Blue cows had no differ-ence in sorting between day and night time. In the same period, the Red cows had difference (P<0.05) in sorting between day and night. During daytime Red cows sorted for large fractions more than at night time (Figure 10). In the LED period, the Red cows had no difference between day and night time. In the same period, Blue cows had difference (P<0.05) in sorting between day and night time. They sorted for large fractions more than the night time (Figure 10).
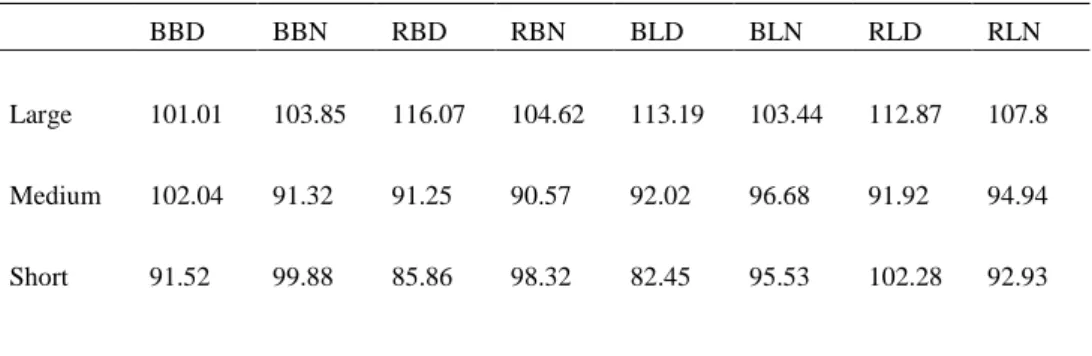
Table 6. Least square means sorting % for the Red and Blue cows in baseline and LED period
BBD BBN RBD RBN BLD BLN RLD RLN
Large 101.01 103.85 116.07 104.62 113.19 103.44 112.87 107.8
Medium 102.04 91.32 91.25 90.57 92.02 96.68 91.92 94.94
Short 91.52 99.88 85.86 98.32 82.45 95.53 102.28 92.93
Sorting % = 100 × (DM intake of particle size n/predicted DM intake of particle size n. For each treatment data for 5 cows was averaged and reported, over a period of 5 days during baseline and 5 days during test period. Sorting values equal to 100 indicate no sorting, greater than 100 indicate sorting in favour of that fraction and below 100 indicate sorting against that fraction.
BBD-Blue Baseline Day, BBN-Blue Baseline Night, RBD-Red Baseline Day, RBN-Red Baseline Night BLD-Blue LED Day, BLN-Blue LED Night, RLD-Red LED Day, RLN-Red LED Night
60 70 80 90 100 110 120 26/1/2019 27/1/2019 28/1/2019 29/1/2019 30/1/2019 S orti ng % Date
<8 mm Fraction Baseline
BLUE Baseline Day BLUE Baseline Night RED Baseline Day RED Baseline Night
60 70 80 90 100 110 120 130 140 28/2/2019 1/3/2019 2/3/2019 3/3/2019 4/3/2019 S orti ng %
<8 mm Fraction LED
Figure 6 Least square means sorting % of medium fractions by cows in baseline (fluorescent light) top graph and red/blue LED light bottom graph
Sorting % = 100 × (DM intake of particle size n/predicted DM intake of particle size n. For each treatment data for 5 cows was averaged and reported, over a period of 5 days during baseline and 5 days during test period. Sorting values equal to 100 indicate no sorting, greater than 100 indicate sorting in favour of that fraction and below 100 indicate sorting against that fraction. .
60 70 80 90 100 110 120 26/1/2019 27/1/2019 28/1/2019 29/1/2019 30/1/2019 S orti ng % Date
<19 mm, ≥8 mm Fraction Baseline
BLUE Baseline Day BLUE Baseline Night RED Baseline Day RED Baseline Night
60 65 70 75 80 85 90 95 100 105 110 28/2/2019 1/3/2019 2/3/2019 3/3/2019 4/3/2019 S orti ng % Date
<19 mm, ≥8 mm Fraction LED
BLUE LED Day BLUE LED Night RED LED Day RED LED Night
70 80 90 100 110 120 130 140 26/1/2019 27/1/2019 28/1/2019 29/1/2019 30/1/2019 S orti ng % Date
≥19 mm Fraction Baseline
BLUE Baseline Day BLUE Baseline Night RED Baseline Day RED Baseline Night
70 80 90 100 110 120 130 28/2/2019 1/3/2019 2/3/2019 3/3/2019 4/3/2019 S orti ng %
≥19 mm Fraction LED
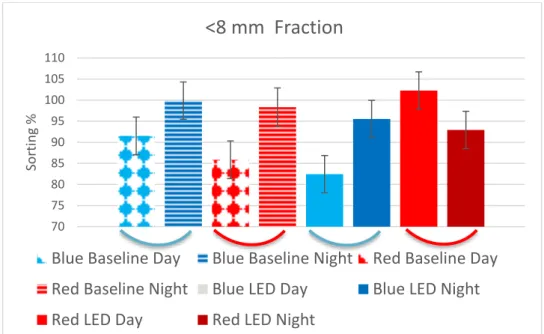
Figure 8 Least square means sorting % of short fractions by cows in baseline (fluorescent light) red/blue LED light
Figure 9 Least square means sorting % of medium fractions by cows in baseline (fluorescent light) red/blue LED light
Sorting % = 100 × (DM intake of particle size n/predicted DM intake of particle size n. For each treatment data for 5 cows was averaged and reported, over a period of 5 days during baseline and 5 days during test period. Sorting values equal to 100 indicate no sorting, greater than 100 indicate sorting in favour of that fraction and below 100 indicate sorting against that fraction.
70 75 80 85 90 95 100 105 110 Sort in g %
<8 mm Fraction
Blue Baseline Day
Blue Baseline Night
Red Baseline Day
Red Baseline Night
Blue LED Day
Blue LED Night
Red LED Day
Red LED Night
70 75 80 85 90 95 100 105 110 S orti ng %
<19 mm, ≥8 mm Fraction
Blue Baseline Day
Blue Baseline Night
Red Baseline Day
Red Baseline Night
Blue LED Day
Blue LED Night
Red LED Day
Red LED Night
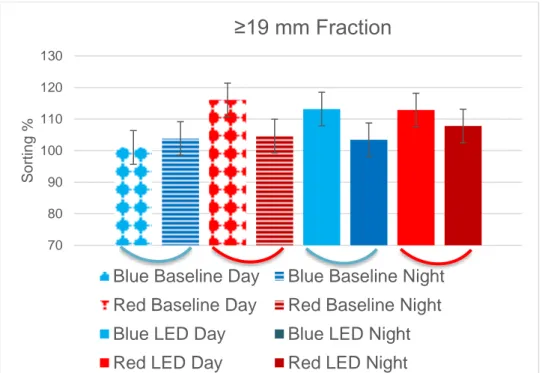
Figure 10 Least square means sorting % of medium fractions by cows in baseline (fluorescent light) red/blue LED light
Sorting % = 100 × (DM intake of particle size n/predicted DM intake of particle size n. For each treatment data for 5 cows was averaged and reported, over a period of 5 days during baseline and 5 days during test period. Sorting values equal to 100 indicate no sorting, greater than 100 indicate sorting in favour of that fraction and below 100 indicate sorting against that fraction.
4.3 Milk yield
Milk yield was on average 20-25kg/day at the onset of the trial and did not change during the four weeks between the baseline and LED period. There was no signifi-cant difference in milk yield when cows were treated with red and blue LED light
70 80 90 100 110 120 130 S orti ng %
≥19 mm Fraction
Blue Baseline Day
Blue Baseline Night
Red Baseline Day
Red Baseline Night
Blue LED Day
Blue LED Night
Red LED Day
Red LED Night
Figure 11 Milk yield in Kg ECM per day/night time for the baseline and LED period
0 5 10 15 20 25 K gE CM
ECM
Blue Baseline Day
Blue Baseline Night
Red Baseline Day
Red Baseline Night
Blue LED Day
Blue LED Night
Red LED Day
Red LED Night
5.1 Methodology discussion
The PSPS box is a commonly used particle separator (Esmaeili et al., 2016; Miller-Cushon & DeVries, 2009; DeVries et al., 2007; Yang & Beauchemin, 2006) and it is easier to use than American Society of Agricultural and Biological Engineers (ASABE) (Lammers et al., 1996). However, there is a risk of effect of person car-rying out the separation and it was therefore a strength in this project that the same person did the separation for all samples, in both the baseline and LED period. The particles separated by the PSPS are good for calculating physically effective NDF (peNDF). We used n = 5 cows and a data collection period of 5 days in each period and were able to get significant result. The number of days for data collection in literature varies a lot from 3 to 7 days (Crossley et al., 2018; Macmillan et al., 2018; Fish & DeVries, 2012; DeVries et al., 2007).
We were able to reach the target value of orts for the whole experiment, but we had a lot more than the intended 5-10%. This may have influenced the results. In a study by Miller-Cushon & Devries, (2010) approx. 20% orts caused cows to select
period and then allocate them to one of the two treatment groups. There was con-tamination of data for the night time sorting, as it included 2 hours of LED light from time of night feeding 1900 hours to the end of daytime light 2100 hours. ME values for silage fractions and cow intake (Table 3) could be a little different because the equation used to calculate them was for whole silage not silage fractions.
In our study DMI and sorting was evaluated for daytime and night time sepa-rately, to allow conclusions of effects of the daytime light on night time activity. There are no other studies available with a similar design which makes it difficult to compare our data with published literature.
5.2 DMI
The difference reported in DMI for daytime and night time (Figure 4), could have arisen from the difference in length of hours for the two periods. For the light treatment day hours were 16 and night hours were 8, however for the actual feeding part daytime was 12 hours (feeding at 0600 and orts collected at 1800 hours), while night time was 10 hours (feeding at 1900 and orts collected next morning at 0500 hours). Hence, the feed intake rate calculated per hour would therefore give more insight when comparing DMI differences. Cows ate the same amount of DMI/h dur-ing the daytime and night time (Table 2).
5.3 Sorting
The cows had equal chance to sort during daytime and night time since their DMI/h and ort/h was the same (Table 2 & 4).
5.3.1 Short feed particle fraction (<8 mm)
Cows sorted against the short fraction during daytime in baseline period. This was an unexpected response because cows fed TMR commonly sort for the short fraction (Macmillan et al., 2018; DeVries & Gill, 2012; DeVries et al., 2011; DeVries et al., 2005; Leonardi & Armentano, 2003). However, in this study we did not feed TMR but silage and concentrate separately and sorting of silage alone may not be comparable to sorting of a TMR. Also, cows have been reported to select against the short fraction of their ration when fed a TMR twice or 6 times per day
with 60%DM and NDF 36% (Crossley et al., 2018). When fed a high forage diet (41%DM and NDF 43%) and low forage diet (47%DM and NDF 38%) the cows sorted for short fractions in low forage diet (DeVries et al., 2007). In the present study our silage had 34%DM and 43% NDF. We could not attribute the behaviour of sorting against the short fraction to the diet composition since the sorting by the Red and Blue cow groups changed differently in LED period during daytime
(Fig-ure 8). Sorting by Red cows changed from sorting against short fractions in baseline
period to sorting for the same fraction in LED period during the day. There was a peak in sorting for the short feed fraction on the fourth day of the measuring period in red LED daytime (Figure 5 bottom graph). The effect of this one day may have caused the day effect observed for the Red cows during daytime (Figure 8). All five cows in the Red group showed the same pattern, with the highest level on the fourth day. Hence maybe five days of data collection is not enough, and it would be inter-esting to see what happens if more days were to be used.
Blue cows showed more pronounced sorting against the short fractions in the LED period, compared to the baseline. Hence, we could say the LED lights influ-enced sorting. The blue LED light during the day did not seem to affect the sorting at night since there was no significant difference between sorting in Red and Blue cows at night during the LED period. This may contradict our hypotheses that hav-ing blue LED light durhav-ing daytime would increase cow activity durhav-ing the night. To fully evaluate this, we need to analyse DMI for daytime and night time separately and add the activity data that was recorded during the trial. This will be done in another part of the larger project.
5.3.2 Medium fractions (<19 mm, ≥8 mm)
Cows sorted against the medium fraction during both day and night time in the baseline period, except for the Blue cows who sorted for medium fractions during
the LED period. This may contradict our hypotheses that having blue LED light during daytime would increase cow activity during the night.
5.3.3 Large fractions (≥19 mm)
Cows in this study overall seemed to favour the long fraction of the silage which contradicts what most other sources reports (Macmillan et al., 2018; Fish & DeVries, 2012; Miller-Cushon & DeVries, 2009; DeVries et al., 2005; Leonardi & Armentano, 2003). In our study the NDF content in all fractions was similar (Table
1) hence, cows could have been selecting in favour of the peNDF. The NDF content
of the diet affects sorting behaviour of large fractions since less variation in chemi-cal NDF was observed in orts (Table 5). DeVries et al. (2007) reported that a low forage diet with 38% NDF resulted in sorting against large fractions. We fed our cows thrice per day in this study. Feeding ad libitum but ensuring for less orts (not feeding too much in excess) and frequency of feeding twice per day has been re-ported to give less sorting against large fractions than once per day feeding (Sova et
al., 2013; DeVries et al., 2005). However, in a recent study by Crossley et al. (2018)
no effect of feeding frequency on sorting was found cows did not sort for or against large fractions. We assume that LED light is therefore influencing sorting since be-haviour of sorting changed from baseline to LED, whereas no change was made on diet fed to the cows or frequency of feeding. Blue cows increased their daytime sorting in favour of the large fraction from almost no sorting (101%) in baseline period to (113%) in LED period. During the baseline period one of the Blue cows showed extreme sorting against the large silage fractions (31%, data not shown) on day three of the baseline period. This value alone would not be very interesting but during the LED period all cows in the Blue group showed a slight sorting against the large fractions on day three. As discussed above, these results indicate that the five-day measuring period may have been insufficient.
Red cows reduced their sorting for the long fraction numerically, from 116% in the baseline period to 113% in the LED period even though the difference was not significant. Blue LED light did not affect sorting during night as there was no sig-nificant difference between sorting in Red and Blue cows during the night period, which again contradicts our hypothesis that having Blue LED light during daytime would increase cow activity during the night.
The cow eye is reported have better vision of the short to medium wavelength light that is around the blue to yellow-green, but not in long wavelengths of red light (Jacobs et al., 1998). However, it was very surprising to observe that cows seem to
see better in red LED light than the blue LED light, as the cows sort in favour of both the short and the large feed fraction during daytime meaning they saw well in order to select for those feed fractions while the Blue LED cows group tend to only select for the large feed fraction. Metal halide lights has more red than blue light in their spectra (Hörndahl et al., 2013). Hence the effect on sorting during a long day photoperiod observed by MacMillan et al. (2018) may have been caused by the red light, like in our study, since they used metal halide lights.
5.4 Milk yield
Milk yield is expected to go down 2% per week post-peak lactation (Knight, 2001). This means an expected loss of 1.6 kg during our trial. The fact that milk yield was maintained suggests that the LED light stimulated a more persistent lac-tation. This was probably fuelled by the DMI that did not change during the period and linked to a more positive energy balance. The differences in sorting does not seem to have caused a difference in milk yield between the two groups. However, the group size in this trial may have been too small to find such effects.
Our findings suggest that LED lights could have influenced feed sorting, to a greater extend during the daytime. It is also possible that LED lights-maintained milk yield as there was no observed difference after a month post peak lactation. The response of the cows to red LED light is very interesting as scientific literature argues con-vincingly that cows have poor vision for red colour. This needs further investigation.
Albright, J. (1993). Feeding behavior of dairy cattle. Journal of Dairy Science, 76(2), pp. 485-498. Azizi, O. (2008). Relationships between feeding behaviour and feed intake in dairy cows during
early lactation.
Crossley, R.E., Harlander-Matauschek, A. & DeVries, T.J. (2018). Mitigation of variability between competitively fed dairy cows through increased feed delivery frequency. Journal of Dairy Science, 101(1), pp. 518-529.
Dahl, G.E., Elsasser, T.H., Capuco, A.V., Erdman, R.A. & Peters, R.R. (1997). Effects of a long daily photoperiod on milk yield and circulating concentrations of insulin-like growth factor-I. Journal of Dairy Science, 80(11), pp. 2784-2789.
DeVries, T.J., Beauchemin, K.A. & von Keyserlingk, M.A.G. (2007). Dietary forage concentration affects the feed sorting behavior of lactating dairy cows. Journal of Dairy Science, 90(12), pp. 5572-5579.
DeVries, T.J., Dohme, F. & Beauchemin, K.A. (2008). Repeated ruminal acidosis challenges in lactating dairy cows at high and low risk for developing acidosis: Feed sorting. Journal of Dairy Science, 91(10), pp. 3958-3967.
DeVries, T.J. & Gill, R.M. (2012). Adding liquid feed to a total mixed ration reduces feed sorting behavior and improves productivity of lactating dairy cows. Journal of Dairy Science, 95(5), pp. 2648-2655.
DeVries, T.J., Holtshausen, L., Oba, M. & Beauchemin, K.A. (2011). Effect of parity and stage of lactation on feed sorting behavior of lactating dairy cows. Journal of Dairy Science, 94(8), pp. 4039-4045.
DeVries, T.J., von Keyserlingk, M.A.G. & Beauchemin, K.A. (2003). Short communication: Diurnal feeding pattern of lactating dairy cows. Journal of Dairy Science, 86(12), pp. 4079-4082. DeVries, T., Von Keyserlingk, M. & Beauchemin, K. (2005). Frequency of feed delivery affects the
behavior of lactating dairy cows. Journal of Dairy Science, 88(10), pp. 3553-3562. DeVries, T.J. & von Keyserlingk, M.A.G. (2005). Time of feed delivery affects the feeding and lying
patterns of dairy cows. Journal of Dairy Science, 88(2), pp. 625-631.
References
Felton, C.A. & DeVries, T.J. (2010). Effect of water addition to a total mixed ration on feed temperature, feed intake, sorting behavior, and milk production of dairy cows. Journal of Dairy Science, 93(6), pp. 2651-2660.
Fish, J.A. & DeVries, T.J. (2012). Short communication: Varying dietary dry matter concentration through water addition: Effect on nutrient intake and sorting of dairy cows in late lactation. Journal of Dairy Science, 95(2), pp. 850-855.
Gonzalez, F.H.D., Olmo, D.M.d., Muino, R., Benedito, J.L., Hernandez, J., Castillo, C. & Pereira, V. (2015). Feed sorting and intake affected by the physical form and composition of the total mixed ration in dairy cows. Revista Brasileira de Saude e Producao Animal, 16(3), pp. 736-745.
Grant, R.J. & Albright, J.L. (2001). Effect of Animal Grouping on Feeding Behavior and Intake of Dairy Cattle. Journal of Dairy Science, 84, pp. E156-E163.
Hörndahl, T., Wachenfelt, E.v. & Wachenfelt, H.v. (2013). Belysning i stallbyggnader. (Landskap, trädgård, Jordbruk, Rapportserie 2013:8). Alnarp: Sveriges Lantbruksuniversitet. Available at: https://pub.epsilon.slu.se/9487/1/horndahl_et_al_130308.pdf [2019-05-31].
Jacobs, G.H., Deegan, J.F. & Neitz, J.A.Y. (1998). Photopigment basis for dichromatic color vision in cows, goats, and sheep. Visual Neuroscience, 15(3), pp. 581-584.
Knight, C.H. (2001). Lactation and gestation in dairy cows: flexibility avoids nutritional extremes. Proceedings of the Nutrition Society, 60(4), pp. 527-537.
Lammers, B.P., Buckmaster, D.R. & Heinrichs, A.J. (1996). A simple method for the analysis of particle sizes of forage and total mixed rations. Journal of Dairy Science, 79(5), pp. 922-928.
Leonardi, C. & Armentano, L.E. (2003). Effect of quantity, quality, and length of alfalfa hay on selective consumption by dairy cows. Journal of Dairy Science, 86(2), pp. 557-564. Leonardi, C., Giannico, F. & Armentano, L.E. (2005). Effect of water addition on selective
consumption (sorting) of dry diets by dairy cattle. Journal of Dairy Science, 88(3), pp. 1043-1049.
Llonch, P., Mainau, E., Ipharraguerre, I.R., Bargo, F., Tedo, G., Blanch, M. & Manteca, X. (2018). Chicken or the Egg: The Reciprocal Association Between Feeding Behavior and Animal Welfare and Their Impact on Productivity in Dairy Cows. Frontiers in Veterinary Science, 5.
Macmillan, K., Espinoza, O.S. & Oba, M. (2018). Case study: the effects of photoperiod on feeding behavior of lactating dairy cows in tie-stalls. Professional Animal Scientist, 34(1), pp. 103-107.
Maulfair, D.D. & Heinrichs, A.J. (2010). Technical note: Evaluation of procedures for analyzing ration sorting and rumen digesta particle size in dairy cows. Journal of Dairy Science, 93(8), pp. 3784-3788.
Miller-Cushon, E.K. & DeVries, T.J. (2009). Effect of dietary dry matter concentration on the sorting behavior of lactating dairy cows fed a total mixed ration. Journal of Dairy Science, 92(7), pp. 3292-3298.
Miller-Cushon, E.K. & DeVries, T.J. (2017). Feed sorting in dairy cattle: Causes, consequences, and management. Journal of Dairy Science, 100(5), pp. 4172-4183.
Morrow, R.C. (2008). LED lighting in horticulture. HortScience, 43(7), pp. 1947-1950.
Sjaastad, O.V., Hove, K. & Sand, O. (2016). Physiology of domestic animals. 3rd ed. Scandinavian Veterinary Press, Oslo.
Sova, A.D., LeBlanc, S.J., McBride, B.W. & DeVries, T.J. (2013). Associations between herd-level feeding management practices, feed sorting, and milk production in freestall dairy farms. Journal of Dairy Science, 96(7), pp. 4759-4770.
Stone, W. (2004). Nutritional approaches to minimize subacute ruminal acidosis and laminitis in dairy cattle. Journal of Dairy Science, 87, pp. E13-E26.
Tosini, G., Ferguson, I. & Tsubota, K. (2016). Effects of blue light on the circadian system and eye physiology. Molecular vision, 22, pp. 61-72.
Velasco, J.M., Reid, E.D., Fried, K.K., Gressley, T.F., Wallace, R.L. & Dahl, G.E. (2008). Short-day photoperiod increases milk yield in cows with a reduced dry period length. Journal of Dairy Science, 91(9), pp. 3467-3473.
von Keyserlingk, M.A.G. & Weary, D.M. (2010). Review: Feeding behaviour of dairy cattle: Meaures and applications. Canadian Journal of Animal Science, 90(3), pp. 303-309.
Yang, W.Z. & Beauchemin, K.A. (2006). Physically Effective Fiber: Method of Determination and Effects on Chewing, Ruminal Acidosis, and Digestion by Dairy Cows. Journal of Dairy Science, 89(7), pp. 2618-2633.
Yeh, N. & Chung, J. P. (2009). High-brightness LEDs—Energy efficient lighting sources and their potential in indoor plant cultivation. Renewable and Sustainable Energy Reviews, 13(8), pp. 2175-2180.
Personal communication
Oba, Masahito., 2019-04-30. masahito.oba@ualberta.ca Professor Agricultural Life and Environmental Sciences. University of Alberta