Master
's thesis • 30 credits
Environmental Economics and Management - Master's Programme Degree project/SLU, Department of Economics, 1243 • ISSN 1401-4084
Green Technology Innovation
-
the Perspectives of Venture Capital
Green Technology Innovation -the Perspectives of
Venture Capital
Nathan Hans Corning
Supervisor:
Examiner:
Per Anders Langendahl, Swedish University of Agricultural Sciences, Department of Economics Richard Ferguson, Swedish University of Agricultural Sciences Department of Economics
Credits: Level: Course title: Course code: Programme/Education: Responsible dep.: Faculty: Place of publication: Year of publication: Name of Series: Part number: ISSN Online publication: Key words: 30 hec A2E
Master Thesis in Business Administration EX0904
Environmental Economics and Management - Master's Programme 120,0 hec
Department of Economics
Faculty of Natural Resources and Agricultural Sciences
Uppsala 2019
Degree project/SLU, Department of Economics 1243
1401-4084
http://stud.epsilon.slu.se
clean tech, drivers, environment, green tech, innovation, investment, perspectives, risk, valley of death, venture capital
Acknowledgements
A special thank you to everyone that made this research possible. Those who made themselves available for interviews proved to be invaluable assets in this research.
Colleagues and others who provided support have helped to nurture this project through its development.
Abstract
Technology has contributed greatly to our environmental problems, but also has a key role to play in solving those problems. While proper financing is an enabler for development, lack of financing is an important constraint. Innovations reach the so-called valley of death after demonstration of a commercially viable product - when capital demands are high but there is a low ability to obtain funding. Understanding investors’ perspectives in this space enables more effective legislation to incentivize investment, addresses the disconnect between investor and innovator, and provides a framework for other investors who wish to engage. This research develops a grounded theory to describe the perceived risks and drivers of early stage venture capital investors. Theory was developed through a combination of literature review and semi-structured interviews. The findings reveal the complexity of the topic and that perspectives vary between investors. Common drivers include financial return and
solving important issues. Quality entrepreneurs, policy, and defensibility can be either drivers or risks depending on the circumstances. Other perceived risks are technology risk, market risk, incumbent actors and capital intensity. Further research can serve to confirm and build upon these results.
Table of Contents
1 Introduction ... 1
1.1 Background ... 1
1.2 Problem Statement ... 3
1.3 Aim and Research Questions... 3
1.4 Delimitations ... 4 1.5 Contributions ... 4 1.6 Report Structure ... 5 2 Methods... 6 2.1 Research Methodology... 6 2.2 Data Collection ... 7 2.3 Analysis... 8 2.4 Research Issues ... 9
2.5 Reliability and Validity ... 10
2.6 Ethical Considerations ... 11
3 Theoretical Perspectives, Conceptual Frameworks & Existing Knowledge ... 12
3.1 Theoretical Perspectives and Conceptual Frameworks ... 12
3.1.1 Valleys of Death ... 12
3.1.2 Stages of Technology Maturity... 12
3.1.3 Impact Investment Framework for Decision Making... 13
3.1.4 Perception and Decision Making ... 14
3.1.5 Behavioral Finance ... 14
3.2 Existing Knowledge ... 15
3.2.1 Technological Risk... 15
3.2.2 Market Risk ... 16
3.2.3 Incumbent Technology ... 16
3.2.4 Policy and Regulation ... 16
3.2.5 Capital Requirements... 17
3.2.6 Entrepreneurial Knowledge and Skills ... 18
3.2.7 Insufficient Returns ... 18
3.2.8 Investment Timeframe ... 18
3.2.9 Returns and Impact ... 19
3.2.10 Impact Measurement ... 19
3.2.11 Summary ... 20
4 Primary Data & Analysis ... 21
4.1 Sample... 21
4.2 Coding Manual and Schedule ... 22
4.3 Coded Data ... 26
5 Further Analysis & Discussion ... 29
5.1 Initial Discussion ... 29
5.1.1 Investor Variability ... 29
5.1.2 Return-First Impact Investing ... 30
5.1.3 Complex Interrelationships Between Drivers and Risks ... 31
5.2 Drivers ... 32
5.2.1 Strong Financial Returns ... 32
5.2.2 Risk Reduction ... 32
5.2.3 Solving Societal Issues ... 33
5.2.4 Impact Measurability ... 33
5.2.5 High Quality Entrepreneurs ... 34
5.3 Risks ... 36
5.3.1 Capital Intensity ... 36
5.3.2 Technological Risk... 37
5.3.3 Market Risk ... 37
5.3.4 Target Market Conditions ... 38
5.3.5 Incumbents ... 39
5.3.6 Time Frame... 40
5.3.7 Myopic Risk... 40
5.4 Situation Dependent Factors ... 42
5.4.1 Policy ... 42
5.4.2 Downstream Investor Support ... 43
5.4.3 Duplicability or Defensibility ... 43
5.5 Further Discussion ... 44
5.5.1 A Comparison: Traditional VC vs. GTI VC ... 44
5.5.2 Summary of Important Findings ... 45
6 Conclusions ... 47
References... 48
List of Figures
Figure 1. Report Structure... 5
Figure 2. The Valley of Death in the Innovation Chain ... 13
List of Tables
Table 1. Literature Review Summary ... 20Table 2. Sampled Organizations with Descriptions ... 22
Table 3. Coding Schedule ... 23
Table 4. Coding Manual ... 26
Table 5. Coded Data ... 27
Abbreviations
ESG: Environmental, Social, & Governance EU: European Union
GTI: Green Tech Innovation ROI: Return on Investment
SDG: Sustainable Development Goals SEK: Svenska Kronor / Swedish Crowns UN: United Nations
USD: United States Dollars VC: Venture Capital VOD: The Valley of Death
1 Introduction
This introductory chapter lays the foundation on which this report is built. It is broken into 6 sections. The chapter provides background and context in section 1, before stating the empirical problem in section 2. The aim and research questions are stated in section 3, and the limitations of the study are described in section 4 to explain what will be excluded from this paper. Section 5 explains how the knowledge created from this research contributes to the world. The chapter ends with a general overview of the remainder of the report.
1.1 Background
A transition to a sustainable economy is becoming increasingly urgent (IPCC, 2014). The anthropogenically enhanced greenhouse effect is causing and will continue to cause disruptions in the climate for decades, or even centuries, bringing with it many adverse effects including higher temperatures, severe weather patterns, sea level rise, and disruption to the ecological systems (Cook et al. 2016; NASA, 2019). Within the context of this
scientific consensus, the global population is expected to hit 9 billion by 2050, putting higher demand and stress on finite resources (UN, 2017). As the problems continue to worsen, we come closer to the point where effects on even the global scale are irreversible (Steffen et al. 2015). The UN warns that at the current rate, there are approximately 11 years remaining to prevent irreparable damage to the climate and avert a catastrophe (UN, 2019b). A sustainable transition is imperative for mitigating and adapting to the effects.
Fagerberg (2017) affirms that innovation must play an important role in the transition towards a sustainable society. Schumpeter (1942) considers innovation as “a process of industrial mutation that incessantly revolutionizes the economic structure from within.” Put simply, innovation is “a new way of doing things” (Porter, 1990). The kind of innovation needed in a sustainable transition is eco-innovation. The EU commission (2019a) defines eco-innovation as
“any innovation that makes progress towards the goal of sustainable development by reducing impacts on the environment, increasing resilience to
environmental pressures or using natural resources more efficiently and responsibly”
Eco-innovation is regarded not only as a catalyst for a sustainable transition, but also as a key element of EU policy for sustainable development (Sarkar, 2013). Eco-innovation is in fact vital for delivering strategic climate objectives (EU Commission, 2019b).
Modern technology has been a large contributor to our environmental problems; however, it also has a key role to play in solving those problems (Berkhout, 2002). A critical element of achieving a sustainable transition is the development and diffusion of clean technologies (IPCC 2014). If we consider Ehrlich & Holdren’s (1971) equation known as IPAT, we can describe in simple terms humanity’s effect on the environment:
Each of these three factors influence the overall impact on the environment, but they also influence each other. Advancements in Technology can reduce Affluence, thus compacting its influence on overall Impact (Chertow, 2000). Notably, Ehrlich and Holdren convey with conviction that ignoring any one of these will not comprehensively address impact (Chertow, 2000). With this in mind, green technologies, or green-tech (also known as clean-tech), is the focus of this paper.
The urgent need to drastically reduce burdens on the environment implies that adaptation within existing technologies is not enough (Rennings, 2000). Changing a technology as a whole, or changing the system in which it operates, has a far greater potential for sustainable development. (Mulder, Ferrer & Van Lente, 2011). For instance, energy storage has potential disrupt the energy market by acting as an enabling technology for renewables; carbon capture and storage is a technology that could provide significant aid in achieving Paris Climate Agreement goals; water desalination technologies increase the accessibility and abundance of fresh water (Evans, Evans & Strezov, 2012; UNFCCC, 2015; Miller, 2003). Radical
innovations produce the market disruption necessary to displace the mainstream product (Christensen, 1997).
While green technology innovation (GTI) is recognized as an important aspect for
transitioning to a sustainable economy, financing this innovation is an important constraint (Hall, 2010; Schumpeter, 1934). In his theory of innovation, Schumpeter (1939) describes financing as an “essential element of the economic process,” a process which would otherwise be “logically incomplete.” Proper investment can significantly catalyze
development and market diffusion of new technologies (Kortum & Lerner, 2000). A lack of this investment can be limiting, or even devastating for any innovation. As such, proper financing is central to the success of any innovation process (Fagerberg, Mowery & Nelson, 2006).
In January of 2016, the UN set 17 Sustainable Development Goals (SDG) to guide policy and funding. These goals are listed in Appendix A. Within the SDGs lies vast investment
potential within trillions of dollars (UN, 2019a). However, a significant financing gap remains. In the EU alone, an annual 180 billion Euro investment gap needs to be closed in order to achieve 2030 goals within the Paris Climate Agreement (EU Commission, 2019b). Naturally, a significant amount of public funding is already going toward these goals; however, the scale of the investment challenge is too large for the public sector to handle alone (ibid). Affirmed by the UN (2018), the public sources of funding in all countries, both rich and poor, “clearly do not suffice to fund the SDGs”. Private finance plays an important role in contributing to SDGs, and is an essential component of the financing of the 2030 Agenda (UN, 2018).
This paper aims to further develop the understanding of investors decision making when investing in green-tech innovation. From an impact perspective, there is an important link between private investment and impact as it helps to speed up scaling and uptake of these technologies. From an investment perspective, it shows potential for opportunity; Di Serio & Silva (2016)consider sustainability to be a coming transition on a scale comparable to the
industrial revolution. This paper aims to further develop the understanding of investors decision making when investing in green-tech innovation.
1.2 Problem Statement
There are numerous challenges associated with bringing an innovation to the market,
including research and funding to ensure function, quality, cost, efficiency, and other aspects that ensure the ability to survive market competition (Auerswald & Branscomb, 2003). Perhaps the most difficult challenge is to cross the Valley of Death (VOD), the middle phase of the innovation chain where a successful prototype tries to successfully penetrate the market (ibid). The challenge exists in an urgent need for funding, but a low ability to raise funding (Murphy & Edwards, 2003). This is due, in part, to an information gap between investor and innovator (Auerswald & Branscomb, 2003). Ventures often fail because of the gaps between what ventures are offering to investors and what the investors are looking for (Murphy & Edwards, 2003). This failure to understand one another represents a major market failure.
In addition to these obstacles, policy and regulation have both a direct and an indirect influence on the ability of these technologies to succeed (Burer & Wustenhagen, 2009). The International Energy Agency highlights the need for effective policy in incentivizing
investment, as well as the shortfall in current policy effectiveness (IEA, 2017). Other research shows that there is not a lack of capital investment available for these technologies, but rather a lack of appropriate policy measures to attract it (Masini & Menichetti, 2012; Leete, Xu, & Wheeler, 2013). Policy makers need to understand how investors behave and how they make decisions, in order to pass more effective legislation (Burer & Wustenhagen, 2009).
1.3 Aim and Research Questions
This project aims to contribute to the academic discourse to develop an understanding of the decision making of investors. It focuses specifically on venture capital (VC) investors. It examines both what makes these investors eager to invest in green tech innovation, and what makes these investors wary to invest. The project is framed to examine the investor
perceptions. This is because of the strong link between perception and decision making; decisions are based on perceptions of reality, rather than objective reality. This paper explores the perceptions of these investors when it comes to the investment risks and opportunities in early stage green tech innovation. This leads to the following research questions:
1) What are the perceived drivers for investment into early stage green-tech innovation?
1.4 Delimitations
This paper focuses on private venture capital investors. This is because of the degree of involvement by venture capital in early stage businesses and startups. Other sources or forms of financing are not considered; sources of debt such as bonds or loans, government grants, programs, and other sources of public funding are excluded, along with retained earnings, or other mechanisms used by a firm. VC Investors must also be involved to at least a significant extent in green technology innovation. This research is focusing on perceptions, the actual risks of investment that are not perceived by investors, although considered, are not
admissible in this report. Research is generalizable only to private venture capital investors involved in green tech innovation when considering its conclusions.
It is important to specify what this report considers to be “green-tech innovation”. Definitions for this term tend to vary from person to person. In this paper, the definition is derived from the EU definition of eco-innovation. Green-tech innovation is therefore defined as: any technology innovation that makes progress toward the UN Sustainable Development Goals by reducing impacts on the environment or by increasing resilience to environmental
pressures directly or indirectly. As an added constraint, incremental improvements will not be considered to be green-tech innovation. These do not create the necessary market disruption. Furthermore, improvements in efficiency are excluded. The Jevons Paradox, more commonly known as The Rebound Effect, implies that efficiency improvements boost consumption, thus adding further to resource depletion (Freeman, 2018) Innovations that change a technology as a whole, or that change the systems in which they operate, will qualify.
Important to note is the difference between invention and innovation. Shumpeter (1934) affirms in his Theory of Innovation that “as long as they are not carried out in practice, inventions are economically irrelevant”. The gap between invention and innovation is of interest in this paper. This project focuses on only particular steps in the innovation chain, specifically where a successful prototype attempts to enter the market. This is the space after research and development, but before commercialization. Innovations approaching or within what is widely referred to as the “Valley of Death” are highlighted in this report.
1.5 Contributions
By understanding investors’ perceptions of risk and opportunity in early stage green-tech innovation, we can develop an understanding of their point of view when making decisions. This knowledge helps in several ways. It will allow innovators and entrepreneurs to better understand investors when they try and seek funding. It also gives policy makers tools to create stronger legislation and policy instruments to incentivize more investment into green-tech innovation. This will help to nurture more investment, and more innovations through to commercialization. Thirdly, this knowledge can act as a framework for other investors that are not involved in green-tech innovation, but want to engage.
1.6 Report Structure
The report is structured as shown in Figure 1 below. This chapter has introduced the topic and described the aim of this report. Chapter 2 describes the research methodology and the methods for collecting and analyzing data. Chapter 3 investigates what is already known about this topic, and describes the theories and frameworks used in the report. Primary data used in this report is made available in Chapter 4, along with initial analysis. Chapter 5 discusses and analyzes in greater detail what the primary data shows, appropriates investor views, and compares and contrasts primary data with the pre-existing knowledge presented in Chapter 3. Chapter 6 draws conclusions based on the analysis of the data.
Figure 1. Report Structure
Introduciton Method
Theories, Frameworks, &
Existing Knowledge
Primary Data & Analysis
Further Analysis
2 Methods
This section provides the research strategy and method used in this project. This gives the research a transparency that enables scrutiny over the project. This chapter also provides an evaluation of the quality of this research, and the extent to which it is valid and generalizable. Section 1 describes the overall methodology on which the research strategy is based. Section 2 describes how data was collected for the study while section 3 describes the analysis of that data. Section 4 describes the steps taken to minimize research error. Section 5 describes the reliability and validity of the conclusions drawn from the study. Finally, section 6 states the ethical consideration of the study and the steps taken to address concerns.
2.1 Research Methodology
This report is a qualitative study. The research will analyze words and semantics as opposed to numerical data in quantitative research. This research will use an interpretivist and
constructionist approach. Interpretivism is an epistemological approach stipulating that there are differences between people, and a strategy must be used that respects the subjectivity of perception, action and meaning (Bryman & Bell, 2015). Constructionism is an ontological position that considers social phenomena and their meanings are continually being
accomplished by social actors, and that social phenomena are not only produced through social interaction but are constantly in revision (Bryman & Bell, 2015). Constructivism assumes reality is constantly being constructed through each individual’s interpretations. This implies a high level of subjectivity on behalf of all individuals involved in the study,
including the researcher. This highlights the importance and the role of the researcher’s thinking both in the collection and analysis of data.
This research will use a grounded theory approach. Grounded theory guides the researcher to develop a theoretical framework that explains the studied process (Charmaz, 2001). With this approach, a researcher collects data and analyzes it simultaneously from the initial phase of research to study the social and psychological process of the sample participants (ibid). The logic of the grounded theory method calls for the emerging analysis to direct data gathering, in a self-correcting, analytic, expanding process; early leads shape later data collection (ibid). The study will result in a mid-range theory based on the evidence that answers the research questions.
By nature, grounded theory uses inductive reasoning. As opposed to deductive reasoning, inductive reasoning starts with a question and collects data relevant to the question; the data is analyzed for patterns and themes that result in generalizations and a descriptive theory (O’Leary, 2007). Although the research questions remained consistent throughout the research process, the aim was slightly updated in order to make the aim narrower and thus better align the aim with the data and results.
2.2 Data Collection
This thesis will collect both primary and secondary data. The collection of this data will be conducted with a planned-systematic approach, as according to Alvesson (2003). To begin, secondary data was collected in the form of a literature review. This process was desk-based research primarily through internet databases like Google Scholar, among others. Scholarly articles and peer reviewed research were focal points, as well as information from reliable sources such as the UN. This shows what is already known about the area of study. It also provides a basis for comparison to green-tech investment where sustainability is not
necessarily a factor. As the first step in the data collection process, the literature review acts as a starting point for the development of a grounded theory. It acts as data to help answer the research questions, and it will help to develop questions for interviews in the primary data collection phase. The literature review process is key because it provides a basis comparison for primary data, and can support or refute aspect or themes derived from primary data with triangulation. Literature review is therefore an invaluable step within this research. The data collected through literature review is provided in section 3.2 under Pre-Existing Knowledge. Primary data collection begins in this research after the literature review process. The primary data process involved a series of semi-structured qualitative interviews. The unit of analysis in this process is the investor. Semi-structured interviews consist of an interview guide, along with probing questions and/or prompts that allow discussion of interesting topics that arise. The interview guide is not strictly followed in each interview. Rather, the interviews embraced a natural flow of conversation with the investor, allowing for more topics to be addressed. This flexibility is one of the benefits of this form of research. The guide served to ensure that a particular range of topics was covered in each interview.
Interview guide questions were drafted with the intention to uncover information relevant to the research question. These questions were drafted with the literature review in mind. That is, the literature review had an influence on the creation of interview questions. This allows the interview to delve deeper into the interviewees knowledge of interesting topics already discovered. The interview guide is available in Appendix B. Before each interview,
respondents were made familiar with the aim and purpose of the research. This allows them to be more prepared for the discussion. The interviews consisted mainly of open-ended questions, thus allowing for responses that might not have been anticipated. With open ended questions, interviewees are not forced into preconceived notions of the researcher, and the respondent’s understanding of the topics can be ascertained (Bryman & Bell, 2015). Ambiguous terms, double leading questions were avoided in the interview guide in an attempt to control for bad questions. It is not possible to fully control for this in a semi-structured interview because questions asked on the spot are impulsive and not subject to scrutiny.
All interviews were audio recorded, and then later transcribed. This is beneficial because it creates a perfect record of what was said. Notes taken on-site cannot capture the full scope or depth of what was said during an interview. Furthermore, memory is a somewhat unreliable source psychologically speaking, as memory is subject to loss and distortion. Audio
examinations of responses, and therefore offer for a more thorough analysis of what people say (Bryman & Bell, 2015). Thus, more information can be mined and discussed in the report.
This study uses Purposive Sampling to select interviewees. This sampling approach
references the goals of the research when making a sample, and therefore, interviewees were selected in terms of criteria that will allow the research questions to be answered (Bryman & Bell, 2015). It would not make sense to interview someone who is not involved in sustainable financing about their decision making. The sample consists of investors in relevant firms. The firms that are listed in the sample are the firms that agreed to be included in the study. More firms were contacted, but not all were willing and/or able to contribute. A list of the firms included in this study is available in Chapter 5.
2.3 Analysis
Data will be analyzed with content analysis, which Holsti (1969) defines as a “technique for making inferences by objectively and systematically identifying specified characteristics.” The analysis seeks to uncover latent content. This goes beyond the semantic content of the data and starts to identify underlying ideas, conceptualizations and ideologies that shape the semantic content (Braun & Clarke, 2006). Altheide (1996) emphasizes the role of the
investigator, or researcher, in the construction of meaning of and in texts. In other words, the researcher determines what is meaningful and what is not - subjectivity is unavoidable. This researcher bias is a necessary source of error in this research.
The meaningful content in the literature review is included at the end of Chapter 3, and was determined by the researcher as such. Content analysis is applicable in semi-structured interviews. It allows results to be analyzed in a systematic and repeatable way. As per
grounded theory, analysis is continuously conducted throughout the research process. Content analysis was conducted through a process of transcription, re-reading of transcriptions,
coding, and a thematic analysis.
Resulting transcriptions from semi-structured interviews was first read casually without taking any notes or making any efforts for interpretations. The text was re-read, along with note taking and an effort to recognize significant observations. After an initial analysis, a coding schedule and coding manual was drafted and applied to the transcribed text. The coding schedule, as shown in Table 3, is the form into which data from interview text was entered. The coding manual, shown in Table 4, specifies the rules by which the text was analyzed, and what categories are used to classify the text. The coding manual and schedule were drafted several times throughout the research process: once after each interview, only being finalized when applied to all interviews at the end. The coding system was drafted with the intent to extract meaningful information from the data through codes. Thus, the coding manual and schedule only include dimensions and categories that are relevant to the data as determined by the researcher. The codes reflect the researcher’s interest and perspectives just as much as they reflect what information lies within the data (Charmaz, 2001). That is, the codes may not show everything within the data, but will only show what the researcher
decides to look for. The coding schedule and manual were designed with the research questions in mind; they are intended to uncover information that will help answer the research questions.
Resulting coded data will then be analyzed through thematic analysis. This is a method for identifying patterns and themes within data (Evans, 2018). Themes capture important aspects of the data in relation to the research question and represent patterns within the data sets (Braun & Clarke, 2006). Thematic analysis is popular as an analytic method because it is independent from any particular theoretical approach or epistemology persuasion, and is useful for researchers within constructionist approaches (ibid).
Coded data and related data was gathered into candidate themes for further analysis. These themes will be discussed and supported with more detailed information from the interviews. The threshold for a theme, the pattern’s frequency of appearance in the data, is very
subjective. It will be up to the researcher to determine what subjects will qualify as themes; this once again highlights the subjectivity of this research. Themes will then be reviewed and discussed in more detail. Themes in the primary data will be compared with pre-existing knowledge in the literature review.
Because analysis is integrated into data collection, as per grounded theory, conclusions were constantly being developed throughout the entire research process. The resulting conclusions represent a mid-range theory that generalize to venture capital investors in green tech
innovation. Because the phenomenon being described is so complex, and because the population being described is so large, conclusions are forced to contain fewer details. This enables the conclusions to be better abstracted to the greater population.
2.4 Research Issues
It is impossible to review all of the literature on any given topic. To suggest this would be absurd, especially given the 20-week time constraint. There is simply too much volume out there to read it all. So, there will be a significant amount of relevant literature not included in the review. It is thus assumed that some aspects of what is already known about the topic may be missed and therefore not included in the report. This possible absence of information could have an influence the conclusions.
All of the data collection and analysis was done by the same researcher. However, there is an element of inter-interview variability in this study. Semi-structured interviews are meant to allow for a flow of conversation which results in a variety of responses. Furthermore, interviewees varied in the enthusiasm for participation as well as in their availability. Some investors were more sensitive in regards to time, resulting in some interviews being rushed or even cut short. In contrast, interviews that were able to fully play out were more thoroughly developed.
There is an unavoidable human factor in this research. The boundaries and pitfalls human psychology apply to the researcher, as it does all researchers. Limits such as bounded
rationality, and obstacles like confirmation bias and anchoring bias influence this research. Confirmation and anchoring bias are especially applicable to this research, where a theory is consistently under development and initial findings influence the perception of later findings. These cognitive boundaries could lead to distortions or partially complete results. This is not to say that the conclusions are invalid, but that cognitive factors put constraints and influence on the logic that resulted in those conclusions. Furthermore, it is impossible to be completely free of bias. Researcher bias will be an unavoidable source of research error. However, this is an inherent assumption of constructionism, and is embraced as a part of this research.
This paper has given a definition of green-tech innovation in Chapter 1. This definition is not the same for everyone. However, what some investors consider to be green-tech might not qualify under this paper’s definition. This could mean that some perspectives may not fully apply. However, all investors observed in the sample had technologies in their portfolio that do qualify, making all perspectives relevant and valid.
Even when the observations themselves are of high quality, the sample is small. The sample size for grounded theory needs to be large enough to reach what Corbin & Strauss (1998) describe as theoretical saturation. Theoretical saturation occurs when no new or relevant data seem to emerge, categories are well developed in terms of properties and dimensions, and the relationships among categories are “well established and validated” (Corbin & Strauss, 1998). Research should continue until new observations show no new data. If grounded theory does not meet the requirements for theoretical saturation, conclusions are at risk of drawing conclusions with low validity or reliability (Thomson, 2010). This threshold of theoretical saturation is not a threshold that this study is able to meet. Due to limited resources and time constraints, primary observations (interviews) were limited to investors accessible by the researcher within the time limit who were also willing to contribute. This resulted in a small sample. Because the topic is so complex, it would take far more interviews until no new relevant data could be found. Accordingly, theoretical saturation is simply beyond the capabilities if this research. It is reasonable and acknowledged that this research could be ignorant to relevant topics. Thus, the findings are not capable of being exhaustive. Also, because of the limited sample size, the conclusions risk of having low external validity when describing all investors in GTI.
2.5 Reliability and Validity
Reliability considers the extent to which a study’s results are consistent over time, are representative of a population, and repeatable with similar methodology (Bryman & Bell, 2015). Reliability is more of a concern in quantitative research than in qualitative research, and measuring reliability in qualitative method is difficult (ibid). This study is not repeatable in its exact form because of the high level of difficulty associated with getting interviews with these investors. The process can be repeated as it has been described, but because of the freedom granted to the researcher in analysis, researcher biases and heuristics constitute a form of error.
Validity considers the integrity of conclusions drawn from research, and weather the research measures what it is supposed to measure (Bryman & Bell, 2015). The remainder of this section discusses various relevant aspects of validity and how they apply to this research. Ecological validity concerns weather findings within a study apply in the real world (Bryman & Bell, 2015). In the context of this study, ecological validity questions whether the
perceptions that investors express in interviews are the same as their perceptions when considering real life investments. This difference is difficult to measure. For research purposes, this paper assumes that there is no difference between reported and actual views. Internal validity considers the degree to which observations match the theoretical ideas developed by the study. LeCompte and Goetz (1982) considered internal validity to be a strength in qualitative research. The conclusions derived from this study are applicable within the context of the study itself.
External validity, on the other hand, refers to the degree to which findings can be generalized outside of the context of the study. (Bryman & Bell, 2015). This is a particular problem for this research because of the small sample that was used, and the sample was not able to reach theoretical saturation. It is the nature of qualitative method to generate depth rather than breadth, and findings tend to be situated to the context of the study (Bryman & Bell, 2015). This is true in this study as well. Perspectives of each investor are examined with great detail in this report. Guba & Lincoln (1994) argue that this provides others the ability to make judgements on the generalizability of the findings. Furthermore, as constructionism considers each individual to have their own construct of reality, there are always going be exceptions to the rule.
2.6 Ethical Considerations
The questions asked in this research are not designed to extract “sensitive information”. However, privacy is an important and valid issue which can be concerning to investors. Any individual who contributes to the study remains anonymous. However, the organization are included in a description of the sample. The reason for this is to give legitimacy to the data. Any information obtained in interviews is not be directly linked to any organization. Rather, patterns between interviews are discussed. When quotations are used, they are quoted as “an investor” as opposed to the individual’s name, or the organization to which they belong. All interviewed investors were provided with informed consent, allowing for an audio recording and presentation of analyzed data as described. All primary data was handled in accordance with GDPR.
3 Theoretical Perspectives, Conceptual
Frameworks & Existing Knowledge
This chapter is broken into two major sections. The first section provides the theories and frameworks used in this paper. The second section lays out the pre-existing knowledge surrounding the topic gathered through literature review. This chapter serves as a starting point in the development towards a grounded theory.
3.1 Theoretical Perspectives and Conceptual Frameworks
This section lays out the theoretical perspectives and conceptual frameworks used in this research. It is broken into five sub sections. Each sub section will describe the theory or framework in detail in its relation to this research. The Valley of Death, and the Stages of Technology Maturity help to understand the context and the problems being addressed. Perception and decision making establishes the link between the two. The Impact Investment Framework for Decision Making helps to understand investors perspectives when evaluating particular kinds of investment. Behavioral Finance explains the impact of psychology on financial decisions. All are relevant and meaningful in the context of this research, and all are described in detail below.
3.1.1 Valleys of Death
The Valley of Death, as described by Auerswald & Branscomb (2003) the space within the innovation chain which is most challenging to cross. After a commercial concept is verified, demands for cash flows are intensified. At the same time, access to this essential cash flow is very poor. Because of this, many innovations or startups fail. The valley of death extends until penetration of the target market. A product’s potential for success is irrelevant in the VOD. The product needs ample investment from private sources. VOD is illustrated in figure 2 below; the dotted line representing VOD and the blue line representing cash flow.
Part of the cause for VOD is a disconnect between investors and innovators. The two have different knowledge, goals, experience, and expectations. Inventors are familiar with science, and the technological feasibility and novelty of their invention. In contrast, investors have an understanding of bringing a technology to market and the financing behind it. This is a clash between technology push and market pull. The ability or inability for investors and
entrepreneurs to understand each other influences the success of crossing VOD.
3.1.2 Stages of Technology Maturity
Foxon et al. (2005) develops a dynamic framework for technology maturity. In this model, a technology moves through several stages of maturity over time. It moves through Research and Development to Demonstration, followed by Pre-Commercial and Supported
Commercial, and ends at the Fully Commercial stage. This does not imply a linear flow, as information moves in both directions; technology pushes from early stages and market pulls
through commercial demand. Technologies make progress toward technical and commercial maturity through the “systemic interaction of a complex network of actors” (Foxon, et al. 2005). Sometimes, these systems break down and a technology will fail to reach maturity (not least of these, VOD).
With each stage, the technology gains varied amounts of market penetration. Market penetration follows a pattern similar to a sigmoid curve. After the demonstration phase, market penetration rises exponentially. After supported commercial, penetration reaches the inflection point. A technology reaches the highest market penetration in the fully commercial phase, where the money is made. Market penetration is represented in figure 2 below, along with VOD. The phases of technology maturity are not named in figure 2 according to Foxton et al. (2005). Rather, figure 2 illustrates the relationship between market penetration and VOD; when enough market penetration is reached, the product becomes economically self-sustaining.
Figure 2. The Valley of Death in the Innovation Chain
3.1.3 Impact Investment Framework for Decision Making
Johnson & Lee’s (2013) framework defines impact investment as investments made to generate a market-based solution to a social or environmental challenge. Impact investing goes beyond traditional approaches of maximizing returns and minimizing risks. It also considers the social/environmental effect that an investment has. It is a strategy chosen by investors specifically because of its ability to generate social and/or environmental returns.
This framework is not specific to innovation, or any type of investment for that matter (debt, equity, stocks, etc.).
Impact investing is very investor specific. While there are so many challenges that an investor may choose from, it is important to remember that the challenge needs to be something that the investor wants to address; it is the investor’s intent that matters. Social return objectives can vary from person to person; it is up to each investor to decide how much impact they want their investments to have toward their goal. The same can be said about financial objectives. Some investors might be content accepting below market rate returns as long as they are satisfied with the social impacts. Others strive for or even expect their investments to generate market rate returns.
3.1.4 Perception and Decision Making
Robbins & Judge (2013) give a good explanation of perception and its relationship with decision making, which is key to this study. Perception is a process by which individuals organize and interpret their impressions in order to give meaning to their environment. However, our perceptions can be different from objective reality. The perception of reality is what decisions are based on, not reality itself.
Factors that shape or distort perception of reality include the perceiver, the object or target, and the context or situation. The perceiver’s interpretation is heavily influenced by their personal characteristics, such as their attitudes, personality, expectations and experiences. The characteristics of the target influence what is perceived. Because we don’t look at targets in isolation, the relationship between the target relative to the context influences perception.
Every decision requires us to interpret and evaluate information. The data considered relevant to a decision is determined by perceptions. Perceptual distortions can often lead to bias conclusions. However, it is these perceptions that determine decisions, not reality itself.
3.1.5 Behavioral Finance
Behavioral finance incorporates psychological and emotional factors in its attempt to explain the reasoning of investors (Ricciardi & Simon, 2000). After all, investment decisions are made by humans. The main focus of behavioral finance is on the limitations of cognitive ability of investors and the role of emotions and social psychology (Bergset, 2015). Rather than some objective aspects of risk and return, a behavioral perspective would suggest that perceptions matter, and that perceptions of risk and return are influenced by cognitive factors (Wustenhagen & Menichetti, 2012). Several of these limitations and biases are discussed in this section.
Investment decisions are made by humans that act under bounded rationality (Simon, 1955). Bounded rationality is often cited as a constraint for decision making. Humans have limited information-processing capability, leading to uncertainty (Robins & Judge, 2013). This is related to prospect theory, which states that people do not always behave rationally, but psychological biases influence choice under uncertainty (Ricciardi & Simon, 2000). People
rely on a set of heuristics when making judgements under uncertainty, and this can lead to systematic errors in decision making (Tversky & Kahneman, 1974).
Other common biases in decision making include optimism bias, anchoring bias,
confirmation bias, and risk aversion. With optimism bias, or overconfidence bias, we tend to overestimate our own skills and predictions for success (Ricciardi & Simon, 2000).
Anchoring bias refers to our tendency to overvalue and fixate on initial information without properly adjusting our opinions and perceptions with subsequent information (Robinson & Judge, 2013). This has relation to confirmation bias, our tendency to seek information that confirms our past choices or beliefs and discount contradictory information (Robinson & Judge, 2013). Humans also have a tendency to be risk averse; people tend to avoid risk and select an outcome with more certainty (Robins & Judge, 2013). Kahneman & Tversky (1979) demonstrated that losses are weighted differently form gains, and expected gains/losses better explain investor behavior compared to final assets.
These biases and limitations are descriptions of human psychology and behavior, not of financial behavior. Behavioral finance uses these psychological factors to help describe the actions within a financial setting.
3.2 Existing Knowledge
This section includes data and information from the desk-based literature review portion of data collection. It shows secondary data, and things that are already known about the research area. It is focused on the perceived drivers and risks in an effort to address the research questions. Included in the review are articles of similar nature to this research, perspectives of venture capital and private equity in general, and other relevant information. Each section states and explains a driver or risk. The final section summarizes the literature review.
3.2.1 Technological Risk
Technology risk refers to whether a technology will achieve its expected performance, efficiency and/or cost reductions (Foxon et al. 2005). In other words, it is the risk that the technology will not actually do what it is supposed to, and is one of the major risks in technology innovation. Confidence in the capability of a technology is fundamental to investment decision of investors (Leete, Xu & Wheeler, 2013). Investors want to see a credible track record of good performance over time (ibid).
Technology risk also relates to lock-in and path dependency from previous development and investment (Polzin, 2016) Developers (and investors) can be tied into sub-optimal designs due to previous decisions and investments (Leete, Xu & Wheeler, 2013). This can result in large losses for investors.
3.2.2 Market Risk
A green-tech innovation is worthless unless it is able to survive in the market. Market risk refers to the uncertainty of the innovation’s ability to succeed in the market, and uncertainty about future levels of reward (Foxon et al. 2005). An inability to comprehend signals from the market such as demand or biases for incumbents or alternatives hinder diffusion of technologies into the market (Polzin, 2017). Investors prioritize market criteria, such as expected demand – a major obstacle when it is lacking (ibid) It is also a common flaw of investors, however, to fail to understand the target market for the technologies (Udwin, 2015) Start-ups that are able to recognize that an entire market is not exactly up-for-grabs, but instead target niche markets, might have a better chance of success (ibid).
Local and environmental acceptance is imperative; negative attitudes or social values about a technology can hinder diffusion technologies (Polzin, 2016). This is of course only the case when there is rejection from the market. If investors perceive a high risk of social acceptance, it can result in early rejection of investment for a technology (Hu et al.2018).
3.2.3 Incumbent Technology
Investors recognize that incumbent firms provide an important barrier to a young firms success (Bocken, 2015). In order to succeed, an innovations business model needs to significantly outperform the incumbent industry (31% of interviewees) (Bocken, 2015). However, economic barriers make this challenging. Economic lock-in and path-dependence due to a history of investments in old technologies can put incumbents at a large advantage (Negro, Alkemade & Hekkert, 2012). For example, fossil-fuel energy dominates the market with the help of decades worth of investment, and an economy built around its use.Investors are often involved in financing both new entrants and established actors, and are thus prone to lock-in because the incumbent technologies provide stable return (Bocken, 2015).
Investment into Green-tech innovation, such as renewables, can suffer further. disadvantages due to environmental externalities (Wustenhagen & Menichetti, 2012). When negative environmental effects of incumbents are not incorporated into costs, a fossil-fuel based technology benefits from the absence of these costs (Polzin, 2017).Furthermore,artificially low energy prices due to subsidies for fossil-fuels can spoil the energy (and cost) savings that many clean technologies depend on (Polzin, 2016). This indirectly puts green-tech at a disadvantage. Green-tech can in fact suffer a double blow from externalities as the positive externalities created are not sufficiently reflected in prices (Bergset, 2015).
3.2.4 Policy and Regulation
There is strong evidence in the literature that government policy and regulation have a strong influence on eco-innovation, and green-tech innovation (Faucheux & Nicolai, 1998).
Regulation and policy are likely the most direct forms of risk for an investment, as many technologies are directly or indirectly dependent on these policies to be in their favor (Polzin, 2016). Proper legislation is paramount in impeding or enabling investment in green-tech. Investors are unlikely to invest in riskier technologies without effective policy support
(Arrow, 1962). It is important to keep in mind the complex dynamic between policy and investment flow; sometimes even the most ambitious policy targets are unable to mobilize the proper investments (Masini & Menichetti, 2012).
There is a debate as to whether innovations have been driven by a technological push or by demand factors (market pull), while evidence shows relevance for both (Rennings, 2000). The way regulations are written can influence this dynamic. Those advocating for market push policies articulate the need for technological breakthrough innovation (Burer &
Wustenhagen, 2009). The rationale behind market-pull policies is that new technologies only make an impact if they are applied in a marketplace, and that a higher demand provides economic incentives to apply them (Dowlatabadi, 1998). Some investors believe that there should be a mix of both technology-push and market-pull instruments to stimulate investment along the entire innovation chain (Burer & Wustenhagen, 2009).
However, factors of technology push and market pull alone do not seem to be strong enough, green-tech and other sustainable innovations need specific regulatory support (Rennings, 2000). Feed-in-Tariffs is a particular mechanism highlighted in the literature. It is a more effective policy scheme in comparison to market-based approaches in reducing investment risk (Butler & Neuhoff, 2008). Feed-In-Tariffs have been shown to be highly effective in achieving deployment targets (Leete, Xu & Wheeler, 2013), and are favored by both investors and entrepreneurial firms (Toke & Lauber, 2007).
Massini & Menichetti (2012) quote Ecofys (2008) in saying “commitment, stability,
reliability and predictability are all elements that increase confidence of market actors, reduce regulatory risks, and hence significantly reduce the cost of capital”. Clarity, consistency and predictability of the regulatory environment are all critical factors for investors (Leete, Xu & Wheeler, 2013; Burer & Wustenhagen, 2009). The more frequently regulations change, the more risk investors assume. Where the regulatory risk associated with policy changes is perceived to be high, investors will be less willing to factor the support mechanisms into their calculations (Burer and Wustenhagen, 2009). It is imperative that investors have confidence in the long-term stability of support mechanisms (Leete, Xu & Wheeler, 2013).
3.2.5 Capital Requirements
Given the nature of other risk factors, high capital requirements factor in as an important element in investment decisions (Gaddy et al. 2017; Flotow, Polzin & Klerkx, 2016). High costs for deployment is also mentioned by scholars as a barrier (Polzin, 2017). This acts as a barrier when firms do not have the necessary capital to execute an investment. However, there are some arguments that capital intensity is not a barrier. As referenced in Udwin (2015), after the 2008 crisis, “capital became incredibly scarce for anything perceived as having even the least bit of risk”. This would explain the lack of investment into more risky ventures during the last decade.
It is not just the scale of the investments, but the associated uncertainty and unpredictability that accompanies it (Leete, Xu & Wheeler, 2013). High levels of capital acts as an amplifier
of risk; if the probability of associated investment risks remains constant, the stakes are raised when capital requirements are high.
3.2.6 Entrepreneurial Knowledge and Skills
The knowledge and skills of the entrepreneur of business is of high importance to investors; things like leadership potential, industry experience, track record are taken into account (Burer & Wustenhagen, 2009). These skills reflect the firm’s ability to be successful. This is the case with start-ups of any kind, and often ads an element of risk. Taking a technology from the lab to the market involves many challenges requires a wide variety of skills from developers; it is unlikely that any one entrepreneur or business will have all of these necessary skills (Leete, XU & Wheeler 2013).
Entrepreneurs in green start-ups can be knowledgeable in environmental issues associated with their business, but also lack proper business qualification (Bergset, 2015). This can be perceived as a lack of needed skills by investors. Green start-ups consider sustainability-related information central to the market in which they operate, even if the investor does not (Bergset, 2015). Bad business plans in which there is too much focus on environmental issues and not enough on financial planning creates a disincentive for investment (ibid).
Furthermore, innovators tend to have an optimism bias in the performance, time frames, and development costs (Leete, Xu & Wheeler, 2013).
3.2.7 Insufficient Returns
Naturally, if a project is unable to generate the necessary return, it is considered an
investment risk. Causes for insufficient return in green-tech innovation are linked to the other risks discussed in this section. Additionally, green-tech and other environmentally focused businesses may be subject to a misconception that sustainability is an added cost (Huhtala, 2003). While this is not the case, as shown by Khan, Sefarim & Yoon (2016) in section 3.2.9 along with other researchers, it is an important point because it is still a perspective held by some investors.
Innovation and start-ups are high risk investments due to the fact that the majority of them fail. The higher level of risk associated with these investments leads to higher rates of required returns (Ciccozzi, Checkenya & Rodriguez, 2003). Investors such as VCs that specialize in innovations and start-ups expect successful investments to have pay-backs high enough to compensate for investments in failed companies (Gaddy et al. 2017). This puts the start-ups under high stress to generate acceptable high levels of return.
3.2.8 Investment Timeframe
One of the obstacles discussed extensively in literature is a long payback period (Polzin, 2017). Sustainable businesses are typically developed within longer timeframes; however, a short-term mindset is prevalent among many investors (Bocken, 2015). A project’s
timeframe, planning and duration are closely linked to budgeting, risk management and cash flows associated with investments in innovation (Scarpellini, Valero-Gill, &
Portillo-Tarragona 2016). Most investments are generally illiquid until there is an exit, usually through acquisition or IPO (Gaddy et. al., 2017). Thus, time to ROI is a significant
consideration for any investor in start-ups (Udwin, 2015). A tolerance for a longer time-frame is needed for investments in sustainable entrepreneurship (Bergset, 2015)
3.2.9 Returns and Impact
Investors committed to sustainability usually believe that there is a dimension of
accountability; they feel responsible for the well-being of future generations (Antarciuc et al. 2018). There is also a sense that business can be used as a force for sustainability, and be good for business (Bocken, 2015). Ethics and virtue are a factor, as there is a desire to solve society’s major issues. They search for radical new approaches due to a disagreement with the status quo (ibid).
One of the major drivers for investment is a competitive advantage (Burer & Wustenhagen, 2009). Innovation can lead to the creation of new products and markets, resulting in new demand and vast opportunity (Antarciuc et al. 2018). New markets result in what Kim and Mauborgne (2005) describe as “blue oceans”. As opposed to competing for market share in the existing “red sea” market, disruptive innovations create whole new markets where no competitors exist.
Contrary to the common misconception that sustainability is a cost, scholars suggest that there is a positive relationship between environmental, social, and governance (ESG) involvement and financial performance (Dowell, Hart & Yeung, 2000). In particular, firms that perform strongly on material topics outperform firms who perform poorly on material topics (Khan, Serafeim & Yoon, 2016). This is evidence that investment into material issues as being value enhancing (ibid). Performance on immaterial topics was shown to be at the very least not value destroying (ibid). This makes it imperative to distinguish between material and immaterial issues. It is more than often the case that ESG is material to green-tech. The misconception noted in section (insufficient returns) that environmentally focused businesses suffer lower returns is not the perspective of all investors. In fact, according to Connaker and Madsbjerg (2019), more than $11.6 trillion USD were invested into ESG investment strategies.
3.2.10 Impact Measurement
Impact measurement is needed to understand the ‘additionality’ of an investment, whether the impact was a result of the investment, or if it would have occurred anyway (EU Commission, 2016). Impact investors often want to know about the performance of their investments in terms of social impact just as much as they want to know about the financial performance. Generating meaningful and understandable performance indicators can help entrepreneurs to generate quality reports, measure improvements over time, and attract new funding (Keyte & Ridout, 2016).
However, this measurement comes with a lot of associated challenges. As found in a study of investors in Silicon Valley, there is a lack of clarity and an inconsistency in the measurement
of impact investment success, creating more confusion for social entrepreneurs when seeking funding, finding traction, and balancing profit and impact (Rustique & Winter-Hoelzl, 2017). Measurable performance indicators are not always the most important things to investors as they are not always meaningful measurements. While impact measurement is undeniably a challenge, it is something investors get excited to see. The ability to measure impact with meaningful performance indicators is a driver for investment. “the better we get at measuring impact, the more money will flow into impact investment” (EU Commission, 2016).
3.2.11 Summary
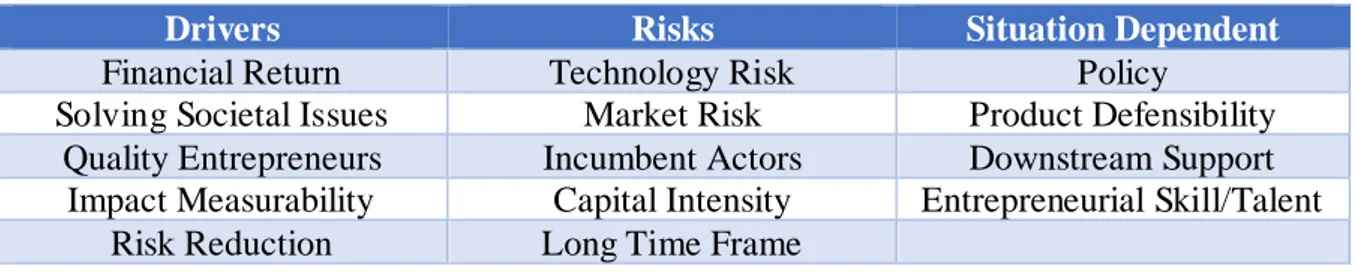
Table 1 below summarizes the major drivers and risks discussed in this section. It summarizes the drivers and risks described in this section as well as those that are both drivers and risks depending on the situation. This initial analysis aids in the development in a mid-range theory to describe perspectives of VC GTI. This is used in a comparison with the primary data to strengthen the findings.
Table 1. Literature Review Summary
Drivers Risks Situation Dependent
Financial Return Technology Risk Policy
Solving Societal Issues Market Risk Entrepreneurial Talent
Impact Measurement Capital Requirements
Timeframe Insufficient Return
4 Primary Data & Analysis
This chapter discusses the data from the primary sources of this research, and the initial coding analysis of that data. The primary data sample, who was interviewed in the study, is presented and discussed in section 1. The coding template used to analyze the transcribed interviews is presented and described in section 2. This section provides clarity in how the data was analyzed and reduces ambiguity. The interview transcriptions themselves will not be provided. The resulting coded data is provided in section 3.
4.1 Sample
The sample size of this study is quite small, with only four observations. This is largely due to the fact that interviews were so difficult to come by. Investors of this variety that meet a good standard are difficult to find. Even more difficult is getting your foot in the door. Investors were often either unable or unwilling to contribute, thus resulting in a small sample size. This is taken both a benefit and a burden. It is a burden because it is difficult to have statistically significant results with such a small sample; four investors are not able to fully represent all investors in GTI. This is not enough to reach the threshold of theoretical saturation that strongly supports a grounded theory. Thus, the external validity or
generalizability of the results suffer. The small sample is also benefit because it allows for more detailed analysis to unpack what investors say in the interviews, and generate results that are more thorough.
Perhaps more notable about the sample is the list of observations themselves. The strength of this sample might not lie in the quantity of observations; rather, the strength lies in the quality of the observations. Each investor was successful, experienced, and involved, to various degrees, within GTI. Not every technology in every company’s portfolio qualifies under the definition of GTI given in Chapter 1. Some investors operate in other spaces in addition to GTI. Every company’s portfolio had at least some technologies that do qualify under that that definition. Some GTI’s within the collective portfolio include electric airplanes, power grid optimization, heat-generated electricity, grid connected smart homes, bioplastics, bio fuels, sub-surface pumped hydro energy storage, ocean wave energy, and many more
The investors showed great insight relevant to the research aim and research questions, as well as demonstrated depth in understanding of the complex subject. The perspectives of each and every investor are valid, reliable, and highly valuable in regards to this research. While the investors themselves are not included in the sample in respect for privacy, the
organizations in which they are involved are provided in alphabetical order in Table 1 below. The reason for this is to legitimize the sample’s strength. The unit of observation is the investor, not the firm!
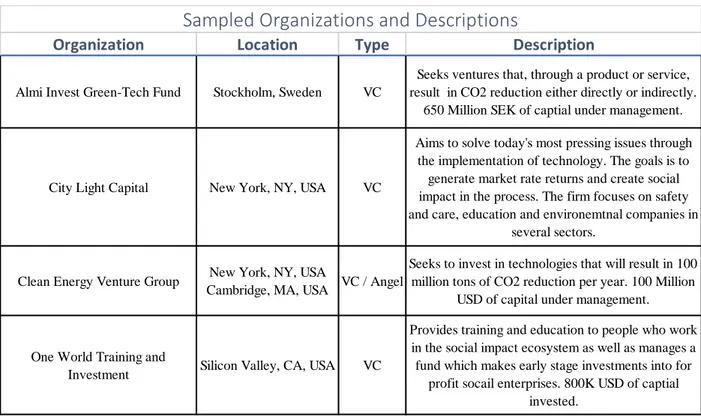
Table 2. Sampled Organizations with Descriptions
4.2 Coding Manual and Schedule
The following tables, Table 2 and Table 3, show the coding schedule and coding manual respectively. These were used in the coding of each interview. They went through a drafting process throughout initial coding, and the final coded interviews are based on these tables. The coding schedule shows the dimensions of information mean to describe each
interviewee, and the manual provides the guide to how each interviewee can fit into each dimension. Each category is associated with the code at the top of the manual, and that code, if it applies, is placed into its respective dimension in the schedule. In general, categories and dimensions were added if it applied to the data in some way. Dimensions within the coding schedule and categories within the coding manual that do not result in any meaningful information are removed or excluded. It is possible to have more than one code for a
dimension. The dimensions and their associated codes are described in the remaining text of this section. The description of the coding scheme is provided to account for ambiguity, to ensure agreement on the terms that are used, as well as to better clarify the analysis of the data. The order of the dimensions or the codes in the tables has no important meaning.
Organization Location Type Description
Almi Invest Green-Tech Fund Stockholm, Sweden VC
Seeks ventures that, through a product or service, result in CO2 reduction either directly or indirectly.
650 Million SEK of captial under management.
City Light Capital New York, NY, USA VC
Aims to solve today's most pressing issues through the implementation of technology. The goals is to generate market rate returns and create social impact in the process. The firm focuses on safety and care, education and environemtnal companies in
several sectors.
Clean Energy Venture Group New York, NY, USA
Cambridge, MA, USA VC / Angel
Seeks to invest in technologies that will result in 100 million tons of CO2 reduction per year. 100 Million
USD of capital under management.
One World Training and
Investment Silicon Valley, CA, USA VC
Provides training and education to people who work in the social impact ecosystem as well as manages a fund which makes early stage investments into for
profit socail enterprises. 800K USD of captial invested.
Table 3. Coding Schedule
Dimension 1 describes the professional position held by the investor within their respective organization. Only titles that apply to the sample are included as possible codes. It is possible to have more than one if it applies to that investor. Dimension 2 places each investor on the impact investor scale. As discussed in section 3.1.3, an investor can be impact focused when the goal of investment is to generate as much impact as possible even if it means sacrificing return, or an investor can be return focused where the goal of investment is to generate (at least) a market rate of return, even if it means reduced impact. As it is a scale, an investor can fall anywhere in between. Investors can fall between 1 and 5, 1 being impact focused, and 5 being return focused.
Dimension 3 describes which investment stage the investors are involved in. Seed and Pre-Seed Capital refer to the earliest stages of investment. Capital in these stages are meant to get the venture off the ground, Seed Capital being the first official stage for equity funding (Reiff, 2019). Series A further develops and optimizes a business after key performance indicators develop a track record (ibid). Series B funding builds and expands and scales the well-established business (ibid). Series C funding focuses on scaling an already quite successful company (ibid). Pre-Public Stage is quite self-explanatory in that it is the stage before the company goes public (ibid).
Dimension 4, Investment Criteria, describes what qualities a technology or entrepreneur should have in order for the investor to seriously consider it. If an entrepreneur does not meet one or more of the criteria it will severely diminish investor confidence. Possible codes for Dimension 4 evaluate whether the firm has high quality entrepreneurs, (code #1), if they have the ability to scale (code #2), if they have a proven commercial potential, usually through
Dimension
Code
1 -2 -3 -4 -5 -6 -7 -8 -9 -10 -11 Desired Policies -Percieved Drivers Percieved Risks Percieved Barriers Ideal EntrepreneursCoding Schedule
Investor Information
Professional Title Investment Stage Impact Investor ClassificationOptimal Time Frame Optimal Market Conditions