https://doi.org/10.1007/s11282-020-00493-4 ORIGINAL ARTICLE
A rater agreement study on measurements in cross‑sectional CBCT
images exploring the association between alveolar bone morphology
and craniofacial height
Anna Klinge1 · Ayman Al‑Okshi1,2 · Jonas Becktor1 · Christina Lindh3
Received: 2 June 2020 / Accepted: 10 November 2020 © The Author(s) 2020
Abstract
Objectives To investigate rater agreement regarding measurements of height and width of the maxilla and mandible using cross-sectional images from CBCT examinations. Furthermore, to explore the association between vertical craniofacial height and alveolar bone morphology.
Methods Pre-treatment CBCT scans from 450 patients referred for treatment to a private clinic for orthodontics and oral surgery in Scandinavia were available and of these, 180 were selected. Lateral head images were generated from the CBCT volumes to categorise subjects into three groups based on their craniofacial height. Cross-sectional images of the maxil-lary and mandibular bodies at three locations in the maxilla and mandible, respectively, were obtained and measured at one height and two width recordings by five raters. One-way analysis of variance with a Tukey post hoc test was performed. A significance level of 5% was used.
Results Rater agreement was mostly excellent or good when measuring height and width of the maxilla and mandible in cross-sectional CBCT images. For height (of the alveolar bone/bodies), there were statistically significant differences between the low- and the high-angle groups for all the observers when measuring in the premolar and midline regions, both in the maxilla and in the mandible.
Conclusion The high agreement found ensures a reliable measurement technique and confirms the relation between crani-ofacial height and alveolar bone height and width.
Keyword Facial bones · Cephalometry · Radiography · cone beam CT · Observer variation
Introduction
Knowledge of the morphological features of the alveolar bone is of great importance for orthodontic tooth move-ment as well as for the planning and thus, the outcome of dental implant treatment. In orthodontics, movements of teeth in a narrow alveolar bone may cause bone dehis-cence, root resorption and gingival recessions, especially in the lower midline region [1]. In implant treatment, sufficient bone volume is a prerequisite for satisfactory outcome and the underlying bone structure plays a key role in the establishment of an acceptable aesthetic result, especially in the anterior maxilla. The bone surrounding an implant site must be of sufficient height and thickness to obtain and keep a harmonious gingival margin [2]. For these clinical situations, assessments and often measure-ments in radiographs are performed. Before assessment tools can be used for a clinical situation, the reliability of Supplementary Information The online version contains
supplementary material available at https ://doi.org/10.1007/s1128 2-020-00493 -4.
* Christina Lindh christina.lindh@mau.se
1 Faculty of Odontology, Department of Oral
and Maxillofacial Surgery and Oral Medicine, Malmö University, Malmö, Sweden
2 Faculty of Dentistry, Department of Oral Medicine and Radiology, Sebha University, Sebha, Libya
3 Faculty of Odontology, Oral-and Maxillofacial Radiology, Malmö University, 205 06 Malmö, Sweden
the tool must be established [3] where reliability can be seen as the ability of a measurement to differentiate among subjects or objects. Furthermore, agreement between measurements is an important concept to provide infor-mation about the quality of measurements [4].
Several studies have provided evidence that there is a significant association between craniofacial height and the morphology of the alveolar bone [5–7]. A majority of these studies have used lateral cephalometric radiographs to analyse the vertical and the sagittal dimensions of the face [8, 9] and to some extent, these studies have used radi-ographs obtained with a posterior–anterior projection [9,
10]. The drawbacks of these two imaging techniques are that the three-dimensional structure of an object is imaged two dimensionally which causes a loss of information. The use of tomographic imaging provides the possibility to assess the alveolar bone morphology in three dimensions as well as different regions in detail. Computed tomogra-phy (CT) of dry skulls has been used to study the associa-tion between mandibular structures and craniofacial type as well as between craniofacial type and bucco-lingual molar inclination [11, 12]. Gracco and co-workers used cone beam CT (CBCT) images of patients to investigate associations between the morphology of the upper jaw, the position of the upper incisors, and craniofacial type as well as the association between the morphology of the mandibular symphysis and the various craniofacial types [13, 14]. Also, based on measurements in CBCT images, significant relationships have been found between crani-ofacial height and alveolar bone height and width in differ-ent tooth-bearing regions of the maxilla and mandible [15,
16]. With regard to measurements of alveolar bone height and width and the association to craniofacial height, some studies present intrarater agreement [11, 15]. However, presentation of interrater agreement is infrequent.
The aim of this study was, therefore, to investigate rater agreement regarding measurements of height and width of the maxilla and mandible using cross-sectional images from CBCT examinations. Furthermore, to explore the association between vertical facial height and alveolar bone morphology.
Materials and methods
This is a retrospective rater-based study on agreement of measurements of the maxilla and mandible in CBCT images obtained in patients before orthodontic treatment. It was conducted, analysed, and reported in accordance with the Guidelines for Reporting Reliability and Agreement Stud-ies (GRRAS) [4]. An initial study protocol was prepared, including data collection, raters and statistical analyses. The protocol was discussed and accepted by the raters.
Subjects
Pre-treatment CBCT scans from 450 patients, females over 15 years and males over 16 years, referred for treatment during 2008–2013 to a private clinic for orthodontics and oral surgery in Scandinavia were available. Either CBCT scans from individuals with missing permanent teeth, other than third molars, periodontal disease visually detected on the radiographs, major asymmetries of the jaws or previous orthodontic treatment was excluded.
Radiography and categorization of subjects
CBCT examinations were performed using an i-CAT CBCT 17–19 (Imaging Sciences International, LLC 1910 N Penn Road, Hatfield, PA 19440, US). The patients were seated in an upright position during scanning. With the aid of laser markers, the midsagittal and occlusal planes were adjusted perpendicular to each other. Field of view (FOV) was set to 16 cm × 13 cm with a voxel size of 0.3 mm. Exposure was set at 120 kVp and 18.54 mAs with a scanning time of 17.8 s. Calibration of this machine was regularly performed according to the manufacturer’s requirements twice a year.
Lateral head images were generated from the CBCT scans using the i-CAT software program. Cephalometric analysis of lateral images was done using the computer software program Total Interactive Orthodontic Planning System [17] (TIOPS, www.tiops .com). Mouse-click on the points of landmarks was used to classify subjects into three groups based on their craniofacial height using the angle of the lower mandibular border (Mandibular line, ML) in rela-tion to cranial base (Nasion-Sella line, NSL). The inclina-tion of the angle formed between the NSL line and the ML line was used to categorize the subjects into the following: low-angle < 27°, average/normal-angle 27–37° and a high-angle group > 37°. After identifying 60 individuals in the low-angle group, this number of scans was set as the limit for the number to be included in the normal- and high-angle group for equal comparisons giving a total of 180 subjects, as described previously (16).
Using i-CAT Vision software (Imaging Sciences Interna-tional, Hatfield, Pennsylvania, USA), a fully reconstructed three-dimensional image with sagittal, coronal, and axial slices was generated.
Raters and rating (measurements)
Five raters performed measurements on the CBCT images. Of the raters, one is a specialist in oral and maxillofacial radiology (with 29 years of experience), and one is a post doc in oral and maxillofacial radiology (with 5 years of
experience). Furthermore, the raters consisted of one spe-cialist in oral and maxillofacial surgery (with 16 years of experience), one resident at the same department and one general dental practitioner. All raters were aware of the pur-pose of the study and performed the same measurements independently of each other. Prior to the measurements, an information session and calibration exercise took place with all the raters, and the assessment instructions were specified both verbally and in writing. Thus, the instructions were pro-vided to all the raters. All raters were familiar with handling CBCT images.
All measurement sessions took place in the same room and a BARCO (MFGD 1318; BARCO, Kortrijk, Belgium) 18.10 greyscale liquid crystal display monitor was used with a luminance of 400 cd/m2 and resolution of 1280 × 1024
pixels. The observation room was dimly lit and kept constant below 50 lx as recommended by American Association of Physicists in Medicine Task Group 18 [18]. The distance to the screen was approximately 50 cm. There was no restric-tion on the observarestric-tion time. The raters were allowed to use the zooming tool. All raters were blinded to clinical features such as craniofacial height and sex.
Before beginning to measure, raters had the possibility to adjust for small deviations in the patient´s head posi-tion during exposure by re-aligning the skull through an adjustment of the images in the sagittal, coronal and axial planes, respectively. The nasion line of the subject was ori-ented horizontally prior to measurements in the maxilla. For mandibular measurements, the mandibular base line was set horizontally. For every group of patients (low, normal, high angle) 3 sites (molar, premolar, and midline region) in maxilla and mandible, respectively, were measured by each rater in rotation (Fig. 1a). Sites were chosen within the three groups of patients to obtain an even distribution between molar, premolar and midline regions. Measurements were performed, with one height and two width measurements between the teeth at selected cross-sectional sites (Fig. 1b). The measurements were performed using the measurement tools in the software program i-CAT vision. For calcula-tion of intrarater agreement, 10% of the sites were randomly selected in IBM SPSS software (version 22.0; IBM Corp Armonk, NY, USA) and measured by all raters in a second session after approximately 2 months.
The measurements were simultaneously and manually documented in an Excel (Microsoft Office Excel® 2010;
Microsoft Corporation, Redmond, WA) file by the respon-sible researcher.
Data analysis
All computations necessary for the statistical analysis were performed using IBM SPSS software (Version 22.0; IBM Corp Armonk, NY, USA). For all variables, the three groups
(low, normal, high angle) were compared using a one-way analysis of variance with a Tukey post hoc test. A signifi-cance level of 5% was used in all comparisons.
Inter- as well as intrarater agreement of measurements in selected cross-sectional sites was calculated as intra-class correlation coefficients (ICCs 2.1) with 95% confidence interval (CI). Only measurements from the first measure-ment session performed by each rater were used to calcu-late interrater ICC. The level of agreement was interpreted according to the guideline proposed by Koo and Li [3] as follows: < 0.50, poor; between 0.50 and 0.75, fair; between 0.75 and 0.90 good; above 0.90, excellent agreement.
Results
Characteristics of individuals belonging to the three groups of craniofacial height is seen in Table 1. Height and width of the maxillary and mandibular alveolar bone/bodies were measured by all raters at all selected sites giving a total of 1080 measurements per rater. For calculation of intrarater agreement, re-measurements were performed by all raters at 10% of the sites giving 108 measurements per rater. Interrater agreement
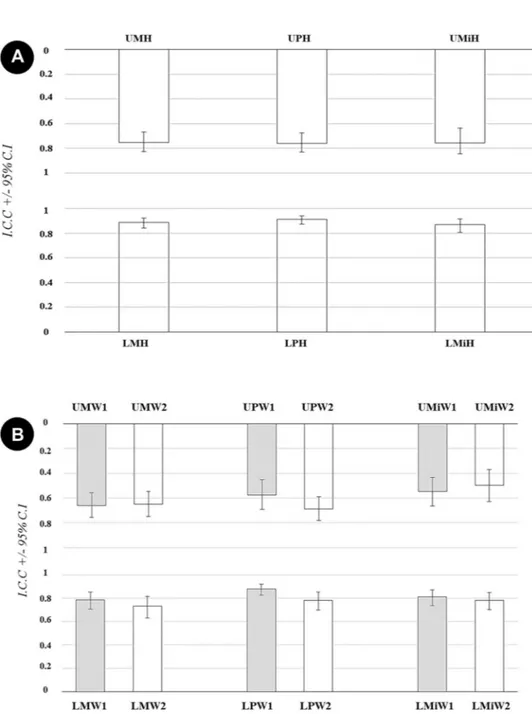
Overall interrater agreement ICC for height measurements was in general excellent or good and varied between 0.75 and 0.91 (CI 0.67–0.83 and 0.88–0.94) depending on the measured site. The values were higher for measurements in the mandible compared with the maxilla, and the high-est value was recorded in the mandibular premolar region (Fig. 2a).
Corresponding ICC values for width measurements were in general lower than for height measurements. In all sites but one, coronal measurements showed higher ICC than apical measurements. Overall interrater agreement ICC for coronal measurements varied between 0.55 and 0.88 (CI 0.43–0.66 and 0.83–0.92) with the highest value in the mandibular premolar region. For apical measurements, ICC varied between 0.50 and 0.78 (CI 0.37–0.63 and 0.70–0.85) with the highest value also being found in the mandibular premolar region (Fig. 2b).
For pairwise interrater, the highest ICC values were also achieved for measurements in the mandible compared with the maxilla. The values for height measurements were in general higher and when comparing coronal and apical width measurements, the highest values were seen for coro-nal measurements. Taking all pairwise interrater agreements into consideration, 8% was interpreted as excellent, 47% as good, 39% as fair and 5% as poor agreement according to the suggested guidelines for interpretation of ICC values by Koo and Le [3] (Supplementary Table S1).
Fig. 1 a When selecting sites for measurements, the steps performed
by the raters when adjusting the volumes for small deviations in the patient´s head position during exposure. b Measurements of height and width in cross sectional CBCT images of the maxilla and
mandi-ble. One height and two width measurements at each site were meas-ured. The sites were named according to location of the neighboring teeth, e.g. upper molar = UM
Intrarater agreement
No rater consistently presented the highest or the lowest
intrarater agreement, but the CI was somewhat wider for some raters. The highest agreement was found in the molar region Table 1 Characteristics of
individuals from which CBCT scans were obtained belonging to one of three groups of craniofacial height (n = number)
Craniofacial height Low angle
n, mean age years (range) Normal anglen, mean age years (range) High anglen, mean age years (range)
Female
n = 117 38, 30.1 (15–70) 44, 25.5 (15–58) 35, 26.2 (15–49)
Male
n = 63 22, 28.8 (17–47) 16, 32.0 (16–71) 25, 23.7 (16–43)
Fig. 2 a Overall interrater
agreement expressed as Intraclass Correlation Coef-ficient (ICC) and Confidence Intervals (CI) for measurements of the height of maxillary and mandibular body in cross sec-tional CBCT images. b Overall interrater agreement expressed as ICC and CI for measure-ments of the width of maxillary and mandibular body in cross sectional CBCT images. UMH upper molar height, UPH upper premolar height, UMiH upper midline height, LMH lower molar height, LPH lower pre-molar height, LMiH lower mid-line height, W1 coronal width,
W2 apical width, UM upper
molar, UP upper premolar, UMi upper midline, LM lower molar,
LP lower premolar, LMi lower
in the mandible when measuring the height of the alveolar bone (Fig. 3).
Height and width measurements related to craniofacial height
Height measurements
Statistically significant differences between the low- and high-angle groups for all raters were found for measurements in the premolar and midline regions, both in the maxilla and in the mandible. Regarding the molar region in the maxilla, there were significant differences between the low- and high-angle groups for three of the raters. Regarding the height measure-ment in the molar region in the mandible, there were no sig-nificant differences between any of the groups for any of the five raters (Table 2).
Width measurements
Coronal width measurements in the maxilla at molar, premolar
and midline regions displayed no statistically significant dif-ferences between any of the groups for the five raters. When measuring in the mandible, there were no statistically signifi-cant differences between the three facial groups when meas-uring in the molar region. When measmeas-uring in the premolar region, statistical differences were seen between the low- and high-angle groups for one rater. But when measuring in the midline region, there were statistically significant differences between the low- and high-angle groups for four out of five raters (Table 3).
Apical width measurement displayed no statistically
signifi-cant differences between any of the three craniofacial groups when measuring in the molar, premolar, and midline region in the maxilla. No statistical differences were presented between any of the craniofacial groups in the molar and premolar region in the mandible. Although, in the incisal mandibular region, there were statistically significant differences between the low and high facial groups for the majority of the raters, four out of five (Table 4).
Discussion
The present study demonstrates that it is possible to achieve good agreement between several raters as well as within raters when height and width of the alveolar bones are measured in cross-sectional CBCT images. Fur-thermore, an association between craniofacial height and alveolar bone height found in this study was statistically significant for all five raters’ measurements.
Accuracy is one part of investigating the strength of a diagnostic method, the other is the agreement, which is the degree to which scores, or ratings, are identical [4]. Unfortunately, agreement studies are generally neglected and do not appear in the different stages of evaluating stud-ies of diagnostic methods or in studstud-ies where diagnostic methods are used to evaluate treatment outcomes [19, 20]. The results of a study of an imaging method and clini-cal problem will be influenced not only by the number of objects and raters but also by the rater selection, e.g. their expertise [21]. The raters in the present study represented professional experience from different fields of expertise and the length of their experience varied; this is also the case with all potential users in a clinical situation. Since the raters may have different other prior experience and visual concepts, a study with several raters can be antici-pated to give a more reliable result. To avoid influence on the assessments and consequently the result, the raters were blinded to all patient information and to the other raters’ measurements.
The raters received instructions to choose an approxi-mal cross-sectional site between first and second molar, between first and second premolar and in the midline at which to perform the height and width measurements. This may have given a lower ICC score and wider confidence intervals than if pre-selected sites had been used. On the other hand, this situation mimics the clinical situation bet-ter as “free selection” takes place in a clinical situation. It is important to be able to apply the results in a clinical set-ting as the external validity would be limited if the results were only applicable in a staged research environment.
Although a standardised calibration procedure to pre-vent bias was applied prior to measurements, a variation in rater agreement was found. Overall interrater agree-ment was in general higher for measureagree-ments in cross-sec-tional CBCT images of the mandible compared with the maxilla and it was the highest in the premolar region for both height and width measurements. This indicates that anatomical landmarks in the mandible might be easier to identify. The marginal bone area and basis of the mandible are probably more distinct in an image than the marginal bone area in the maxilla and the borders to maxillary sinus and nasal cavity. Pairwise interrater agreement was the Fig. 3 Intrarater agreement of five raters (1–5) expressed as Intraclass
Correlation Coefficient (ICC) and Confidence Intervals (CI) for the measurements of (a) cross-sectional height measurement; (b) coro-nal width (1/3) measurement and (c) apical width (2/3) measurement of maxillary and mandibular body in cross-sectional CBCT images.
W1 coronal width, W2 apical width, UM upper molar, UP upper
pre-molar, UMi upper midline, LM lower pre-molar, LP lower prepre-molar, LMi lower midline
highest for measurements at mandibular sites and even if agreement varied a majority of the agreements were in the category “good agreement” (Supplementary Table S1) [3]. The lowest agreement was noted when the raters measured in the upper midline region. This might be explained by difficulties in the interpretation of sites where there are anatomical variations such as the incisive foramen.
Interrater agreement was expressed as overall ICC as well as pairwise interrater agreement. The pairwise interrater calculations is able to detect if any rater differs consider-ably from the others, which can then be analysed further.
The difference might be due to a misinterpretation of the instructions or an unfavourable measurement technique. In this study, no clear deviation was observed for any rater (Supplementary Table S1).
The CI of the ICC was in some measurements negative which indicates considerable uncertainty. The somewhat low rater agreement can be explained by variations in the steps performed by the raters when adjusting for small deviations in the patient’s head positioning and in the selection of sites for measurements as well as difficulties in identifying ana-tomical structures and handling CBCT volumes. In the study Table 2 Height Measurements in CBCT cross-sectional images of the maxilla and mandible of individuals with different craniofacial height per-formed by five raters
Mean values, standard deviation (SD) and significant differences between groups *p < 0.05
Site Rater Craniofacial height
High-angle group Normal-angle group Low-angle group Significance
Mean in mm (SD) Mean in mm (SD) Mean in mm (SD) High-normal Normal-low High-low Maxilla Molar 1 16.6 (2.8) 15.6 (2.0) 15.7 (2.6) 0.428 0.991 0.505 2 16.3 (2.8) 15.4 (2.7) 14.8 (2.8) 0.338 0.797 0.107 3 17.5 (2.8) 16.2 (2.4) 14.9 (2.5) 0.258 0.265 0.007* 4 16.8 (2.7) 15.2 (2.5) 14.0 (2.5) 0.140 0.332 0.004* 5 16.9 (2.5) 15.6 (2.6) 14.7 (2.6) 0.272 0.499 0.025* Premolar 1 20.0 (3.0) 18.4 (1.9) 16.6 (3.1) 0.165 0.109 0.001* 2 19.8 (2.8) 18.3 (1.9) 16.9 (3.0) 0.195 0.188 0.002* 3 20.2 (3.4) 18.6 (1.6) 16.4 (2.4) 0.100 0.025* 0.000* 4 20.0 (2.6) 18.4 (2.1) 16.6 (2.4) 0.102 0.056 0.000* 5 20.0 (2.7) 18.2 (2.4) 16.3 (2.1) 0.000* 0.000* 0.000* Midline 1 22.4 (3.0) 21.0 (2.6) 22.4 (2.6) 0.257 0.220 0.005* 2 20.5 (2.8) 19.8 (2.4) 17.4 (2.7) 0.701 0.016* 0.002* 3 21.1 (2.6) 20.3 (2.3) 18.0 (2.4) 0.533 0.011* 0.000* 4 20.1 (3.2) 19.2 (2.3) 19.2 (2.3) 0.493 0.209 0.016* 5 22.9 (2.7) 20.6 (2.3) 18.3 (2.7) 0.000* 0.000* 0.000* Mandible Molar 1 27.4 (3.9) 26.7 (2.3) 26.0 (2.3) 0.737 0.729 0.296 2 27.3 (4.3) 26.5 (2.3) 25.7 (2.5) 0.754 0.654 0.255 3 26.9 (4.4) 26.7(2.4) 25.6 (2.4) 0.966 0.544 0.396 4 27.0 (3.8) 26.3 (2.4) 25.6 (2.5) 0.746 0.711 0.289 5 26.7 (3.3) 26.6 (2.8) 26.2 (2.6) 0.993 0.683 0.611 Premolar 1 32.3 (2.7) 31.3 (2.7) 28.0 (2.8) 0.515 0.001* 0.000* 2 32.8 (2.7) 31.5 (2.6) 28.7 (3.1) 0.282 0.010* 0.000* 3 32.6 (3.0) 31.3 (2.9) 28.3 (3.4) 0.362 0.011* 0.000* 4 33.1 (2.6) 31.9 (2.8) 28.5 (3.1) 0.387 0.001* 0.000* 5 32.1 (3.6) 30.7 (3.0) 28.7 (3.4) 0.025* 0.001* 0.000* Midline 1 32.7 (3.3) 31.6 (3.5) 29.8 (2.4) 0.489 0.168 0.012* 2 33.4 (2.7) 33.3 (4.1) 30.9 (2.8) 0.993 0.064 0.049* 3 33.6 (2.6) 32.3 (3.2) 30.4 (3.0) 0.330 0.119 0.003* 4 32.7 (2.9) 31.4 (2.9) 30.0(2.2) 0.309 0.187 0.005* 5 35.3 (3.3) 32.3 (3.0) 29.5 (2.8) 0.000* 0.000* 0.000*
by Sadek et al., inter- and intrarater agreement was reported as ICC with paired t test [15]. However, no confidence inter-val was reported, and the number of observers was vaguely described as “other orthodontists” without mentioning their exact numbers or professional experience. Regardless of the statistical approach used, confidence intervals as measures of statistical uncertainty should be reported to allow the read-ers to be able to determine, in particular, the lower level of reliability/agreement.
Taking several rater measurements into consideration, the results of this study showed that patients with large
craniofacial height (high angle) has a significantly higher alveolar bone, both in the maxilla and in the mandible com-pared to those with low craniofacial height (low angle). The association between craniofacial height and cross-sectional maxillary and mandibular bone height was most evident in the premolar and incisal regions. These results strengthen the findings of our previous study [16] and are to a cer-tain extent in concordance with the results of the study by Sadek et al. [15] where statistical differences were found in the anterior part of the maxilla. Therefore, it can be con-cluded that the dentoalveolar compensatory mechanism, Table 3 Coronal width measurements in CBCT cross-sectional images of the maxilla and mandible of individuals with different craniofacial height performed by five raters
Mean values, standard deviation (SD) and significant differences between groups *p < 0.05
Site Rater Craniofacial height
High-angle group Normal-angle group Low-angle group Significance
Mean in mm (SD) Mean in mm (SD) Mean in mm (SD) High-normal Normal-low High-low Maxilla Molar 1 14.7 (1.9) 14.0 (1.0) 14.0 (1.9) 0.387 1.0 0.391 2 14.5 (1.5) 14.3 (0.8) 13.8 (1.6) 0.904 0.461 0.244 3 15.0 (1.8) 14.6 (0.9) 14.4 (1.2) 0.684 0.858 0.368 4 14.9 (1.8) 14.1 (1.0) 14.2 (1.5) 0.150 0.972 0.228 5 14.2 (1.6) 14.1 (1.3) 13.7 (1.5) 0.953 0.425 0.272 Premolar 1 9.2 (1.4) 9.5 (1.1) 9.1 (1.0) 0.664 0.516 0.969 2 9.6 (1.3) 9.5 (1.1) 9.3 (1.3) 0.974 0.808 0.680 3 10.2 (1.6) 10.0 (1.3) 10.2 (1.8) 0.967 0.937 0.995 4 9.7 (1.5) 9.8 (1.2) 9.8 (1.4) 0.954 0.989 0.900 5 9.0 (1.3) 9.3 (1.1) 9.2 (1.2) 0.208 0.655 0.690 Midline 1 6.5 (1.2) 6.6 (1.3) 6.9 (1.2) 0.954 0.747 0.567 2 7.2 (1.5) 6.7 (0.8) 6.9 (1.4) 0.386 0.853 0.711 3 7.2 (1.6) 6.8 (1.0) 7.2 (1.0) 0.534 0.592 0.995 4 6.7 (1.1) 6.9 (1.1) 7.3 (1.2) 0.785 0.451 0.155 5 6.9 (1.0) 7.1 (1.0) 6.9 (1.4) 0.652 0.721 0.993 Mandible Molar 1 13.2 (1.3) 12.9 (1.8) 13.3 (1.8) 0.756 0.731 0.999 2 13.2 (1.4) 13.3 (2.0) 13.6 (1.4) 1.0 0.763 0.745 3 13.7 (1.4) 13.5 (2.0) 13.0 (2.1) 0.967 0.675 0.522 4 13.0 (1.8) 13.1 (2.4) 13.5 (1.9) 0.966 0.825 0.680 5 13.0 (1.9) 13.3 (1.9) 13.3 (2.0) 0.677 0.970 0.529 Premolar 1 9.4 (1.9) 10.9 (1.6) 10.5 (2.2) 0.055 0.822 0.613 2 9.4 (1.7) 10.9 (1.5) 10.6 (2.2) 0.038* 0.873 0.116 3 9.9 (2.1) 11.2 (1.7) 11.5 (2.4) 0.154 0.870 0.053 4 9.6 (1.9) 10.9 (1.7) 11.1 (2.4) 0.102 0.944 0.500 5 9.5 (1.6) 10.4 (2.0) 10.5 (2.0) 0.025 0.914 0.008* Midline 1 6.9 (1.8) 8.2 (2.1) 8.6 (1.6) 0.083 0.820 0.020* 2 7.1 (2.3) 7.7 (1.9) 8.1 (1.4) 0.622 0.800 0.267 3 6.9 (1.6) 8.2 (1.9) 8.5 (1.3) 0.031* 0.888 0.009* 4 6.5 (1.6) 8.2 (2.0) 8.3 (1.3) 0.006* 0.956 0.003* 5 6.4 (1.5) 7.3 (1.6) 8.2 (1.6) 0.004* 0.006* 0.000*
via continued tooth eruption, responds in the maxilla and mandible by enlarging the vertical size of the frontal den-toalveolar heights in long-face subjects and, conversely, less tooth eruption will take place in short-face subjects [22].
A further indication, on the association between verti-cal craniofacial height and alveolar bone morphology, especially in the anterior region, is that in this study the coronal and apical width in the midline region of the man-dible (LO-MID) was narrower in the group with high crani-ofacial height compared with the group with low craniofa-cial height. In the premolar and molar areas, there were no
statistically significant differences in the coronal nor in the apical width measurements between any of the groups. Strength and limitations
Rater agreement has been investigated to explore measure-ment errors and variations in interpretation, which affects the value of measurements in clinical practice [23] and have to be taken into account when evaluating methods in any diagnostic yield. The number of subjects in the study is larger than that included in other comparable studies [15, Table 4 Apical width measurements in CBCT cross sectional images of the maxilla and mandible of individuals with different craniofacial height performed by five raters
Mean values, Standard Deviation (SD) and significant differences between groups *p < 0.05
Site Rater Craniofacial height
High-angle group Normal-angle group Low-angle group Significance
Mean in mm (SD) Mean in mm (SD) Mean in mm (SD) High-normal Normal-low High-low Maxilla Molar 1 16.0 (2.6) 14.9 (1.2) 16.8 (3.5) 0.405 0.058 0.550 2 15.7 (2.6) 15.5 (1.2) 15.1 (2.1) 0.941 0.786 0.583 3 16.2 (2.5) 16.1 (1.7) 15.6 (2.8) 0.987 0.984 1.0 4 16.0 (2.4) 15.4 (1.3) 15.6 (2.5) 0.656 0.971 0.793 5 16.1 (2.4) 15.9 (1.9) 15.9 (2.1) 0.913 1.0 0.919 Premolar 1 9.92 (1.7) 10.2 (1.6) 10.6 (1.8) 0.893 0.737 0.458 2 10.5 (1.9) 10.4 (1.6) 10.7 (2.2) 0.995 0.927 0.960 3 10.7 (1.9) 10.8 (1.6) 11.4 (2.3) 1.0 0.590 0.577 4 10.7 (2.0) 10.8 (1.8) 11.3 (2.3) 0.970 0.779 0.637 5 10.4 (2.2) 10.4 (1.9) 10.6 (2.0) 0.976 0.908 0.804 Midline 1 13.3 (4.1) 12.6 (2.6) 12.1 (3.2) 0.744 0.886 0.456 2 10.8 (3.2) 11.7 (3.2) 10.4 (3.0) 0.598 0.347 0.903 3 12.8 (2.3) 12.8 (2.4) 12.5 (3.1) 0.998 0.910 0.933 4 13.0 (3.1) 13.5 (2.09 13.4 (2.8) 0.799 0.998 0.833 5 12.6 (2.1) 12.0 (1.9) 12.3 (2.5) 0.231 0.724 0.657 Mandible Molar 1 11.0 (1.5) 11.3 (1.3) 11.4 (1.7) 0.793 0.989 0.711 2 10.8 (1.4) 11.0 (1.2) 11.1 (1.8) 0.959 0.956 0.842 3 11.4 (1.5) 11.6 (1.2 12.3 (2.1) 0.960 0.276 0.172 4 11.0 (1.3) 11.3 (1.4) 11.2 (1.6) 0.837 0.980 0.925 5 10.6 (1.4) 11.0 (1.79 10.9 (1.6) 0.420 0.888 0.706 Premolar 1 9.0 (1.6) 10.1 (1.9) 9.4 (1.5) 0.086 0.343 0.731 2 9.4 (2.0) 10.1 (1.6) 9.4 (1.6) 0.343 0.406 0.992 3 10.2 (1.8) 10.4 (1.7 10.1 (1.8) 0.904 0.849 0.993 4 9.4 (2.2) 10.1 (1.8) 10.0 (1.6) 0.423 0.983 0.527 5 9.4 (1.8) 10.2(1.7) 10.0 (1.7) 0.045 0.833 0.164 Midline 1 12.1 (2.3) 13.7 (2.5) 14.4 (2.0) 0.072 0.589 0.006* 2 11.9 (2.3) 13.1 (2.59 14.1 (1.7) 0.208 0.359 0.008* 3 12.2 (2.2) 13.8 (2.6) 14.7 (1.9) 0.075 0.404 0.002* 4 12.0 (2.4) 13.4 (2.5) 13.5 (1.8) 0.131 0.996 0.110 5 12.3 (2.1) 13.5 (2.4) 14.1 (1.9) 0.005* 0.282 0.000*
24]. Nevertheless, it is a retrospective study design where CBCT examinations were performed prior to the design of the current study. The subjects included in the study were referred to a specialist clinic for orthodontic and oral sur-gery which means that the results may not be generally applicable.
Conclusions and clinical implications
Knowledge of the morphological features of the alveolar bone is of importance when planning orthodontic tooth movement or dental implant treatment. The results from this study show the significant association between craniofacial height and alveolar bone dimensions as explored by several raters and would provide reference data that can be useful prior to orthodontic or dental implant treatment in subjects with different craniofacial types.
Acknowledgements The authors would like to thank Dr’s Martin
Lind-ström and Shahed Mahdavi for valuable contributions as raters.
Funding Open access funding provided by Malmö University. Compliance with ethical standards
Conflict of interest Author Klinge, author Al-Okshi, author Becktor
and author Lindh declare that they have no conflict of interest.
Ethical approval All procedures followed were in accordance with the
ethical standards of the responsible committee on human experimenta-tion (instituexperimenta-tional and naexperimenta-tional) and with the Helsinki Declaraexperimenta-tion of 1964 and later versions. Approved by the Regional Ethical Review Board, Lund, Sweden (2014.05.08, Dnr 2014/288), the Danish Health and Medicines Authority, Denmark (2015.07.20, Sagsnr. 3-30-13-877/1/) and the Danish Data Protection Agency, Denmark (2015.07.07, J.nr. 2015-41-4117).
Open Access This article is licensed under a Creative Commons Attri-bution 4.0 International License, which permits use, sharing, adapta-tion, distribution and reproduction in any medium or format, as long as you give appropriate credit to the original author(s) and the source, provide a link to the Creative Commons licence, and indicate if changes were made. The images or other third party material in this article are included in the article’s Creative Commons licence, unless indicated otherwise in a credit line to the material. If material is not included in the article’s Creative Commons licence and your intended use is not permitted by statutory regulation or exceeds the permitted use, you will need to obtain permission directly from the copyright holder. To view a copy of this licence, visit http://creat iveco mmons .org/licen ses/by/4.0/.
References
1. Garib DG, Yatabe MS, Ozawa TO, Filho SOG. Alveolar bone morphology under the perspective of the computed tomography: defining the biological limits of tooth Movement. Dental Press
J Orthod. 2010;15:192–205. https ://doi.org/10.1590/S2176 -94512 01000 05000 23.
2. Buser D, Martin W, Belser UC. Optimizing esthetics for implant restorations in the anterior maxilla: anatomic and surgical con-siderations. Int J Oral Maxillofac Implants. 2004;19:43–61. 3. Koo TK, Li MY. A guideline for selecting and reporting
intra-class correlation coefficients for reliability research. J Chi-ropractic Med. 2016;15:155–63. https ://doi.org/10.1016/j. jcm.2016.02.012.
4. Kottner J, Audigé L, Brorson S, Donner A, Gajewski BJ, Hróbjartsson A, Roberts C, Shoukri M, Streiner DL. Guide-lines for reporting reliability and agreement studies (GRRAS) were proposed. J Clin Epidemiol. 2011;64:96–106. https ://doi. org/10.1016/j.ijnur stu.2011.01.016.
5. Nanda SK. Growth patterns in subjects with long and short faces. Am J Orthod Dentofacial Orthop. 1990;98:247–58. https ://doi.org/10.1016/S0889 -5406(05)81602 -6.
6. Janson GRP, Metaxas A, Woodside DG. Variation in maxillary and mandibular molar and incisor vertical dimension in 12-year-old subjects with excess, normal and short lower anterior face height. J Orthod Dentofac Orthop. 1994;106:409–18. https :// doi.org/10.1016/S0889 -5406(94)70063 -X.
7. Kuitert R, Beckmann S, van Loenen M, Tuinzing B, Zentner A. Dentoalveolar compensation in subjects with vertical skeletal dysplasia. Am J Orthod Dentofacial Orthop. 2006;129:649–57.
https ://doi.org/10.1016/j.ajodo .2004.09.032.
8. Björk A, Skieller V. Growth of the maxilla in three dimen-sions as revealed radiographically by the implant method. Br J Orthod. 1977;4:53–64. https ://doi.org/10.1179/bjo.4.2.53. 9. Björk A, Skieller V. Normal and abnormal growth of the
man-dible. A synthesis of longitudinal cephalometric implant studies over a period of 25 years. Eur J Orthod. 1983;5:1–46. https :// doi.org/10.1093/ejo/5.1.1.
10. Snodell SF, Nanda RS, Currier GF. A longitudinal cephalo-metric study of transverse and vertical craniofacial growth. Am J Orthod. 1993;104:471–83. https ://doi.org/10.1016/0889-5406(93)70073 -W.
11. Tsunori M, Mashita M, Kasai K. Relationship between facial types and tooth and bone characteristics of the mandible obtained by CT scanning. Angle Orthod. 1998;68:557–62. 12. Masumoto T, Hayashi I, Kawamura A, Tanaka K, Kasai K.
Relationships among facial type, buccolingual molar inclina-tion, and cortical bone thickness of the mandible. Eur J Orthod. 2001;23:15–23. https ://doi.org/10.1093/ejo/23.1.15.
13. Gracco A, Lombardo L, Mancuso G, Gravina V, Siciliani G. Upper incisor position and bony support in untreated patients as seen on CBCT. Angle Orthod. 2009;79:692–702. https ://doi. org/10.2319/08190 8-437.1.
14. Gracco A, Luca L, Bongiorno MC, Siciliani G. Computed tomography evaluation of mandibular incisor bony sup-port in untreated patients. Am J Orthod Dentofac Orthop. 2010;138:179–87. https ://doi.org/10.1016/j.ajodo .2008.09.030. 15. Sadek MM, Sabet NE, Hassan IT. Alveolar bone mapping in
subjects with different vertical facial dimensions. Eur J Orthod. 2015;37:194–201. https ://doi.org/10.1093/ejo/cju03 4. 16. Klinge A, Becktor K, Lindh C, Becktor JP. Craniofacial height
in relation to cross-sectional maxillary and mandibular mor-phology. Progress in Orthodontics. 2017;18:32. https ://doi. org/10.1186/s4051 0-017-0187-8.
17. Total Interactive Orthodontic Planning System (TIOPS). Avail-able from:http://www.tiops .com/. Accessed 26 Nov 2019. 18. Samei E, Badano A, Chakraborty D, Compton K, Cornelius
C, Corrigan K, et al. Assessment of display performance for medical imaging systems: executive summary of AAPM TG18 report. Med Phys. 2005;32:1205–25. https ://doi. org/10.1118/1.18611 59.
19. Farzin B, Gentric JC, Pham M, Tremblay-Paquet S, Brosseau L, Roy C, et al. Agreement studies in radiology research. Diagn Interv Imaging. 2017;98:227–33. https ://doi.org/10.1016/j. diii.2016.05.014.
20. Swets JA, Pickett RM. Evaluation of diagnostic systems: meth-ods from signal detection theory. New York, USA: Academic Press; 1982.
21. Rohlin M, Horner K, Lindh C, Wenzel A. Through the qual-ity kaleidoscope: reflections on research in dentomaxillofacial imaging. Dentomaxillofac Radiol. 2020;49:20190484. 22. Solow B. The dentoalveolar compensatory mechanism:
back-ground and clinical implications. Br J Orthod. 1980;7:145–61.
https ://doi.org/10.1179/bjo.7.3.145.
23. Robinson D, Gajos M, Whyte L. Evidence-based care through clinical practice. Nurs Stand. 1997;11:32–3. https ://doi. org/10.7748/ns.11.30.32.s42.
24. Swasty D, Lee J, Huang JC, Maki K, Gansky SA, Hatcher D, et al. Crosssectional human mandibular morphology as assessed in vivo by cone-beam computed tomography in patients with different vertical facial dimensions. Am J Orthod Dentofac Orthop. 2011;139:377–89. https ://doi.org/10.1016/j.ajodo .2009.10.039.
Publisher’s Note Springer Nature remains neutral with regard to jurisdictional claims in published maps and institutional affiliations.