A GIS Tool to Analyze Forest Road Sediment
Production and Stream Impacts
Ajay Prasad1
Civil and Environmental Engineering Department, Utah State University, Logan, UT-84322
David G. Tarboton1
Civil and Environmental Engineering Department, Utah State University, Logan, UT-84322
Charles H. Luce2
Research Hydrologist, USDA Forest Service, Boise, ID – 83702
Thomas A. Black2
Hydrologist, USDA Forest Service, Boise, ID - 83702
Abstract:A set of GIS tools has been developed (Road Sediment Analysis Model, RSAM) to analyze and quantify the impacts of forest roads on forested watersheds. RSAM is organized into three modules. In the first module sediment production for each road segment is calculated from slope, length, road surface condition and road side drain vegetation. A GPS gathered road condition inventory provides surface and drain conditions, locations of drain points, information on connectivity between drain points and streams, and information on road stream crossings. Slope is obtained from the GIS by overlaying the road path on a Digital Elevation Model (DEM). Road sediment production is accumulated at each drain point by adding the sediment production draining to each drain point from different road segments. These drain point sediment loadings are then coupled with a DEM model for surface flow and used as inputs to a weighted flow accumulation function to calculate sediment load inputs to stream segments, also delineated based on the DEM. An option allows accumulation of all sediment produced or only sediment produced from drain points inventoried as connected to the stream. The second module analyzes the impact of forest roads on terrain stability. Terrain stability is assessed by calculating the specific discharge due to road drainage and using this, together with slope, as inputs to an infinite plane slope stability model. In the final module the inventory
information on the fish passage status of stream crossings is used to demarcate contiguous clusters of stream habitat and assess the impact of fish passage barriers on the fragmentation of stream habitat. A map showing possible fish habitat clusters is obtained from the analysis. To ensure referential integrity between road segments, drain points and the stream network attributes, and to validate the road inventory dataset a relational database model framework is used. Preprocessing software has been developed to load the road inventory data into this framework and fulfill initial quality control and data validation functions. The sediment production, terrain stability and habitat cluster contiguity analyses then works off data from the relational database.
1 Civil and Environmental Engineering Department, Utah State University, Logan, UT-84322,
Tel: (435) 797-3172, e-mail: ajayprasad@cc.usu.edu , dtarb@cc.usu.edu
2 USDA Forest Service, 322 E. Front St., Suite 401, Boise, ID 83702, Tel: (208) 373-4382 e-mail: cluce@fs.fed.us, tblack@fs.fed.us
1. Introduction
Forest roads affect stream ecosystems in a variety of ways (Jones et al., 2000), and changes to sediment regimes and habitat fragmentation are two of the most direct. The construction and use of roads can be a significant source of sediment in forested basins (Swanson and Dyrness, 1975; Reid and Dunne, 1984; Wold and Dubé, 1998; Luce and Black, 1999) . Road construction removes vegetation from the road cut slope, fill slope, ditch and tread, leaving these areas susceptible to surface erosion. Over time, the cut slope and fill slope revegetate and erosion from these areas is reduced, however, the road tread and ditch continue to be sediment sources as long as the road is in use (Megahan, 1974; Luce and Black, 2001). Runoff that drains from roads can initiate landslides or gullies (Montgomery, 1994; Wemple et al., 1996; Borga et al., 2004). Stream crossing culverts can impede passage of water
downstream causing mass wasting (Flanagan et al., 1998) and fragment fish habitat by blocking fish passage (Clarkin et al., 2003). Forest managers need information about the potential impacts of roads over large areas to conduct cumulative effects analyses and watershed analyses for planning new road construction, maintenance, and decommissioning priorities. Information on aquatic impacts beyond just sediment yield estimates are needed for such work (Luce et al., 2001; Switalski et al., 2004).
An important characteristic of roads is that fine scale information such as linear and point data is important to impacts over large areas (Luce and Wemple, 2001) requiring a detailed inventory of roads and their relationships to their drainage points (Black and Luce, 2002). Existing sediment yield models (e.g. Cline et al., 1984; Washington Forest Practices Board, 1995; Wold and Dubé, 1998) do not use information about specific locations and characteristics of drains, impairing their ability to estimate delivery of sediment, not to mention the suite of geomorphic processes that depend on point delivery of water. Black and Luce (2002) developed a road and drainage inventory process to respond to this specific need. The method uses GPS and databases to capture field survey information that can be used in a GIS program to perform analyses that rely on the spatial coincidence of landscape and road characteristics to determine risks to aquatic ecosystems. The purpose of this paper is to describe GIS based analysis tools designed to calculate sediment production from forest roads, its delivery to the stream system, the effects of road drainage on terrain stability, and the impact of road crossing barriers on aquatic habitat.
2. Methods
2.1. Road Sediment Analysis Model
A road sediment analysis model (RSAM) has been developed to use forest road inventory information to analyze the impact of forest roads on forested watersheds. RSAM has the following three sets of functionalities:
1) Quantify sediment production from forest roads and stream sediment inputs.
2) Calculate terrain stability at road drain points and impacts of road drainage on terrain stability.
3) Analyze stream habitat segmentation due to road crossings that are barriers to fish passage.
2.1.1. Sediment Production and Stream Sediment inputs:
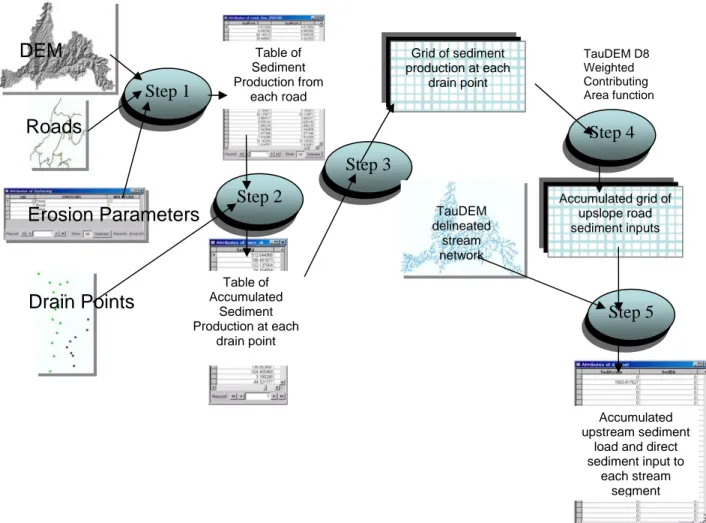
Figure 1 gives the flow of information and calculations performed to estimate sediment production and stream sediment inputs in RSAM.
Figure 1: Flow of information in RSAM sediment calculation Step 1 Step 2 Step 3 Step 4 Step 5 Table of Sediment Production from each road
DEM Grid of sediment
production at each drain point Table of Accumulated Sediment Production at each drain point Accumulated grid of upslope road sediment inputs Accumulated upstream sediment
load and direct sediment input to each stream segment Erosion Parameters Roads Drain Points TauDEM delineated stream network TauDEM D8 Weighted Contributing Area function
Evaluating sediment production from each forest road segment is the first step in the model analysis (Step 1 in Figure 1). Road segment sediment production is calculated from a base road sediment production rate adjusted by factors to account for the condition of the road surface and ditch vegetation multiplied by the road segment length and slope (Luce and Black, 1999). Although Luce and Black suggest LS2 as the best explanatory variable, for road segment sediment production a model using LS was nearly as good. Given the types of errors that can be generated from GPS inputs, the LS model is preferable because that is simply the elevation difference between the beginning and end of a road segment. The formula for calculating the annual erosion rate, following Luce and Black (1999) is
2
aLSrv
Ei =
where L is the length, S is the slope, a is the annual base erosion rate (79 kg/m (elev) default), r is the road surface multiplier, v is the vegetation multiplier based on ditch vegetation and i indicates the side of the road. Information for these multipliers is taken from Luce and Black (2001a and 2001b) and the Washington Forest Practices Board (1995) which synthesizes work by several scientists. This formula is applied separately to each side of the road because road side ditches may drain to different drain points and have different attributes, hence the division by 2 in the above equation.
Sediment produced from the road surface is transported to drain points along side ditches, wheel tracks, berms or other surface flow paths. Accumulated sediment load at each drain point is calculated by adding up sediment
production values from all road segments draining to the drain point (Step 2 in Figure 1). The road attribute table in the road inventory contains the
information about the drain points to which each road segment drains. Each drain point has a unique identifier, DrainID, and each road segment has two DrainID fields representing the drain point connected to each side of the road. The resulting accumulated sediment production is appended to the drain point attribute table.
Drain points divert water and sediment from the ditches and road surface to either directly to a stream or onto a hillslope, where it may continue to a stream. The drain point sediment loadings are used to obtain a grid giving the sediment production at each drain point (Step 3 in Figure 1). TauDEM (Tarboton and Ames, 2001) is then used to derive, from a digital elevation model (DEM), the D8 flow direction grid. This defines for each grid cell the flow direction to one of the eight adjacent or diagonal neighbors in the direction of steepest slope. This effectively parameterizes the surface flow field. A weighted flow accumulation function (Step 4 in Figure 1) is then used to sum the sediment inputs upstream from each grid cell. TauDEM also
provides a DEM derived stream network and the last step (Step 5 in the figure) intersects the accumulated sediment grid with the stream network to calculate
the sediment input accumulated at the downstream end of each stream segment. From this information, the model also calculates the sediment yield from roads per unit watershed area, allowing comparison to long term sediment yields from other processes. Direct sediment input to each stream segment is also calculated by subtracting the accumulated upstream sediment load from the accumulated sediment load at the downstream end of the stream segment. The results are appended as fields to the stream network attribute table.
2.1.2. Terrain Stability and Road Drainage
Because drain points accumulate storm water from the road side ditches and divert it to adjacent hillslopes, these hillslopes are locations of increased risk for erosion and pore water pressure induced landslides. The terrain slope at each drain point is needed to quantify the risk for erosion. Point slope estimates from a digital elevation model are uncertain due to slope calculations amplifying uncertainty in the DEM. Therefore we provide a function for calculating slope over a specified down gradient distance to ameliorate these effects. The slope at each drain point is appended to the drain point table. The SINMAP model (Pack et al., 1998) provides a quantification of terrain instability based on the infinite plane slope stability model and steady state hydrology (Montgomery and Dietrich, 1994) coupled with uncertainty in soil parameters. One measure of terrain stability at drain points is assessed by intersecting the stability index grid obtained from SINMAP with drain points to provide a table of stability index at each drain point. This is essentially a mapping of places where roads drain to inherently unstable slopes.
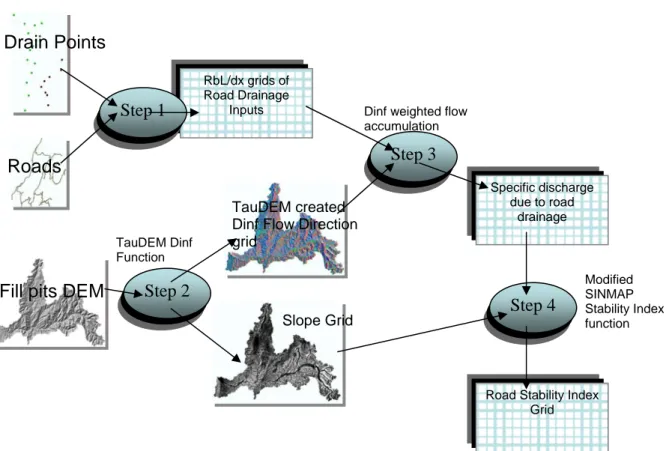
The SINMAP measure of stability index at each drain point does not quantify the impact of the quantity of road runoff from each drain point. To account for this the SINMAP approach has been modified to substitute road drainage for the steady state recharge used in SINMAP. The approach is illustrated in figure 2.
Drain Points
RbL/dx grids of Road Drainage
Inputs
Figure 2: Evaluation of Road Stability Index at each drain point using a modified SINMAP Stability Index function.
SINMAP bases its calculations of terrain stability on a relative wetness
evaluated from specific catchment area, slope, and other steady state hydrology parameters
TS Ra Min
w= ( , 1)
where R is the per unit area steady state recharge that supplies soil moisture, T is the Transmissivity of the soil profile, a is the specific catchment area, and S is the slope. In modifying SINMAP to represent road drainage, the numerator
Ra which represents the supply of water or the specific discharge is replaced by RbL/dx. This is the specific discharge, i.e. flow per unit width, due to road drainage. R is per unit area steady state runoff originating from roads, and b is the road width. The product Rb represents the per unit length runoff from the road. This is multiplied by the road length L and divided by grid cell size dx to arrive at a specific discharge. The relative wetness in the modified approach is therefore TS dx RbL Min w= ( / , 1) Step 2 Step 3 Roads
Fill pits DEM
TauDEM created Dinf Flow Direction grid
Slope Grid
Specific discharge due to road
drainage Dinf weighted flow
accumulation
Step 1
Step 4
Road Stability Index Grid TauDEM Dinf Function Modified SINMAP Stability Index function
This is then used in the SINMAP equation for quantifying terrain stability. Grids of RminbL/dx and RmaxbL/dx values at each drain points are created and
used as weight grids for calculating contributing area. The resulting minimum and maximum contributing area grid are used in a modified SINMAP stability index function to determine the Road Stability Index grid.
2.1.3. Stream habitat fragmentation due to road stream crossings
Stream crossings in the road network may be a barrier to many species of fish. Sediment produced from the road surface and other organic debris can end up blocking fish passage at stream crossings. Identifying stream crossings which are or can be blocked will help forest managers to plan for culvert maintenance. Barriers to fish passage are based on factors like
• Stream crossing substrate • Blocked or crushed culvert • Crossing channel gradient • Outlet drop
• Pipe to channel width ratio
An algorithm flowcharted in Figure 3 was developed based on examples in Clarkin et al. (2003) to determine whether a stream crossing is completely blocked, partially blocked or open based on information in the forest road inventory. Once fish passage barriers are identified network operations on the stream network will be used to map and evaluate attributes of contiguous stream habitat clusters. The size and connectivity of these clusters is important in assessing the fragmentation of habitat due to road stream crossing fish passage barriers.
Figure 3: Fish passage barrier determination. Parameters for decisions may be user modified. * p w ≥ w Channel idth w Pipe idth Start Culvert Stream bed Totally blocked Ye Totally blocked Substrate
or crushed or crushed or flowsaround
Blocked
Partial Passage
Clear Passage
Yes Material Blocked
Partial Passage
Slope < S p
Outlet drop < ODp
Outlet drop > ODPD x pool depth
Blocked Blocked Blocked Baffles N N N Yes Ye Ye N N yes no
2.2. RSAM Database Model Schema
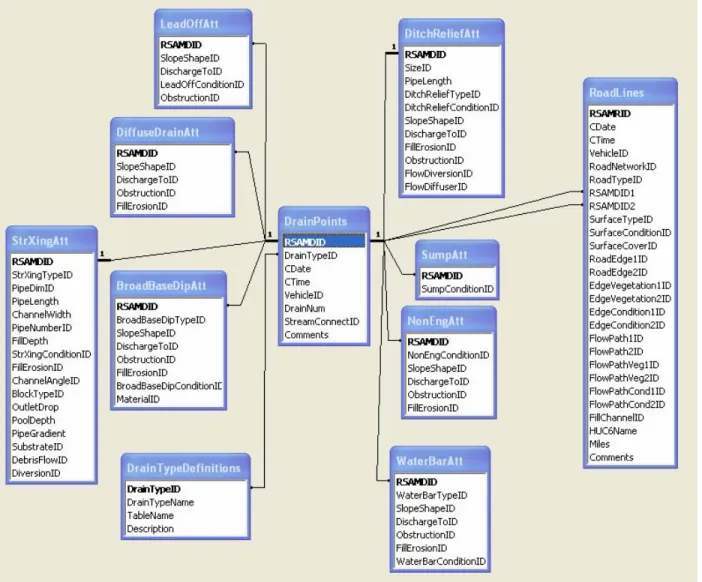
Figure 4 gives the relational database schema developed for RSAM. This has been designed to accommodate the eight drain point types into one drain points table with subsidiary tables that give attributes associated with each specific drain point type. There are attribute definition tables (not shown) that hold pre-defined allowable attribute values and serve to enforce referential integrity and validate records as they are imported into the database.
Figure 4: RSAM data model schema.
RSAMDID is the primary key in the DrainPoints table and acts as foreign key in all other special attributes table. The DrainTypeDefinitions table contains Drain point type names and corresponding unique identifiers. DrainTypeID is the primary key in the DrainTypeDefintions table and is a foreign key in DrainPoints table.
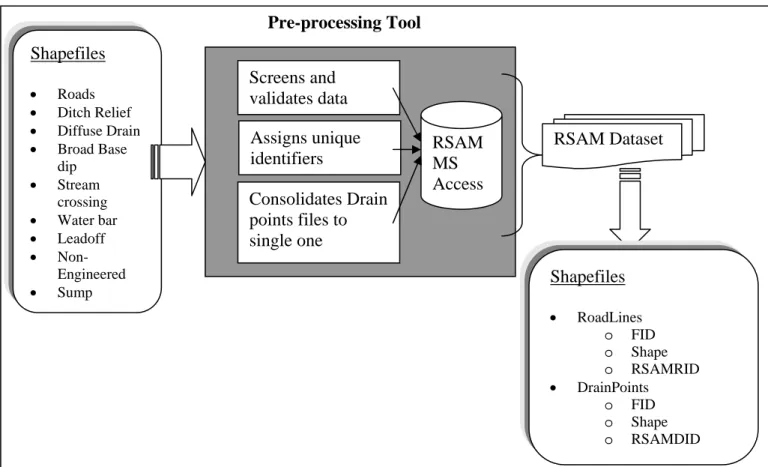
A pre-processing module has been developed to import information from USDA Forest Service road inventory into this database. This is illustrated in figure 5. The pre-processing tool is used to prepare the RSAM dataset that is then used as input to the RSAM GIS model (Figure 6).
Figure 5: RSAM pre-processing tool
RSAM MS Access Pre-processing Tool Screens and validates data Assigns unique identifiers Consolidates Drain points files to single one RSAM Dataset Shapefiles • Roads • Ditch Relief • Diffuse Drain • Broad Base dip • Stream crossing • Water bar • Leadoff • Non-Engineered • Sump Shapefiles • RoadLines o FID o Shape o RSAMRID • DrainPoints o FID o Shape o RSAMDID Shapefiles from USFS road inventory Pre-processing tool RSAM GIS Model RSAM dataset Output
3.
Model Implementation in ArcGIS
The procedures presented have been programmed partially in C++ and partially in Visual Basic 6.0 as library functions compiled into a component object model dynamic link library. The model uses ArcObjects software components inside Visual Basic 6.0 to access spatial analysis and other ArcGIS functionalities used in the model. The software accesses data in the ESRI grid format using the RasterIO application programmer’s interface. An ArcMap toolbar extension has been developed using Visual Basic to provide graphical user interface access to the functionality presented from within ArcMap.
Input to the Road Sediment Analysis Model is in the form of ESRI grids, the RSAM database in MS Access format, and roads and drain point shapefiles. The shapefiles are accessed using the Shapefile C Library
(http://shapelib.maptools.org/) which provides the ability to write simple C programs for reading, writing and updating shapefiles, and the associated attribute file (.dbf).
4.
Illustrative Results
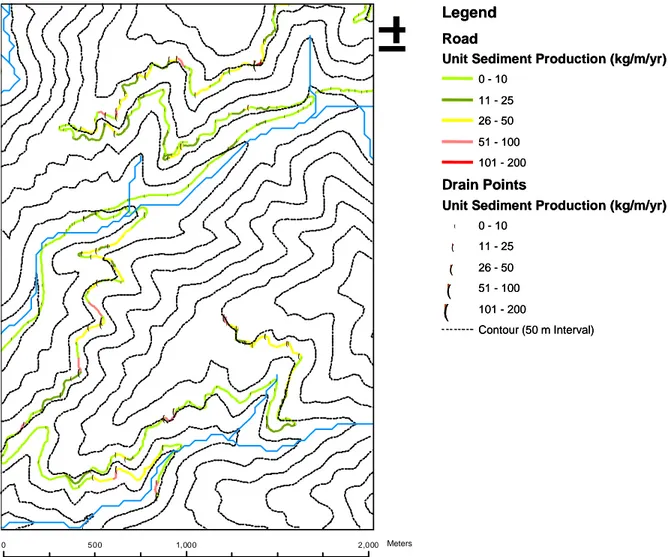
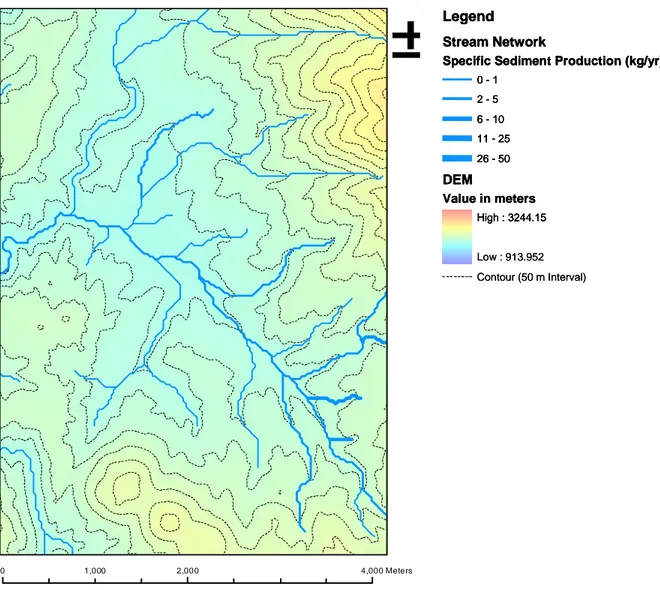
Some illustrative results from the RSAM model applied to the Upper Deadwood study area in Idaho using example data from the U.S. Forest Service are shown in figures 7 and 8.
Legend
Road
Unit Sediment Production (kg/m/yr)
0 - 10 11 - 25 26 - 50 51 - 100 101 - 200 Drain Points
Unit Sediment Production (kg/m/yr)
! ( 0 - 10 ! ( 11 - 25 ! ( 26 - 50 ! ( 51 - 100 ! ( 101 - 200 Contour (50 m Interval) Legend Road
Unit Sediment Production (kg/m/yr)
0 - 10 11 - 25 26 - 50 51 - 100 101 - 200 Drain Points
Unit Sediment Production (kg/m/yr)
! ( 0 - 10 ! ( 11 - 25 ! ( 26 - 50 ! ( 51 - 100 ! ( 101 - 200 Contour (50 m Interval)
Figure 7: Road segment unit sediment production (kg/m/yr) and drain point sediment load over the Upper Deadwood area. Unit Sediment production is the sediment load from both
sides of the road segment divided by road length.
0 500 1,000 2,000Meters
±
! ( ! ( ! ( ! ( ! ( ! ( ! ( ! ( ! ( ! ( ! ( ! ( ! ( ! ( ! ( ! ( ! ( ! ( !( !( !( !( !( !( !( !( !( !( !( !( !( !( ! ( ! ( !( !( !( !( !( !( !( !( !( !( !( !( !( !( !( !( ! ( ! ( ! ( ! ( ! ( ! ( ! ( ! ( ! ( ! ( ! ( !( !( !( !( !( !( !( !( !( !( ! ( ! ( ! ( ! ( ! ( ! ( ! ( ! ( ! ( ! ( ! ( !( !( !( !( !( !( !( !( !( !( !( !( !( !( !( !( !( ! ( ! ( !( ! ( ! ( ! ( ! ( ! ( ! ( ! ( ! ( ! ( ! ( ! ( ! ( ! ( ! ( ! ( ! ( ! ( !( !( !( !( !( !( !( !( !( !( !( !( !( !( !( !( !( !( !( !( !( !( !( !( !( !( !( !( !( !( !( !( !( !( !( !( !( !( !( !( !( !( !( !( !( !( !( !( !( !( !( !( !( !( !( !( !( !( !( !( !( Meters0 1,000 2,000 4,000Meters
±
LegendStream Network
Specific Sediment Production (kg/yr)
0 -1 2 - 5 6 - 10 11 - 25 26 -DEM Value in 50 meters High : 3244.15 Low : 913.952 C Legend Stream Network
Specific Sediment Production (kg/yr) 0 - 1 ontour (50 m Interval) 2 - 5 6 - 10 11 - 25 26 -DEM Value in 50 meters Legend Stream Network
Specific Sediment Production (kg/yr) 0 - 1 2 - 5 6 - 10 11 - 25 26 -DEM Value in 50 meters Hig Hig Lo h : 3244.15 h : 3244.15 w : 913.952 Contour (50 m Interval)
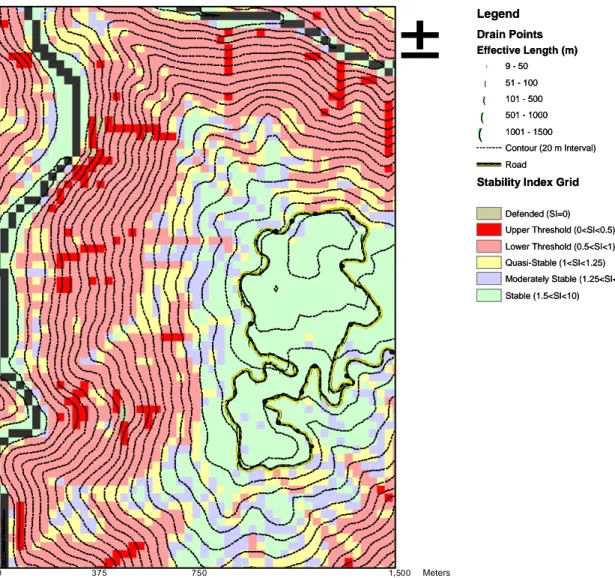
Figure 9 illustrates the Road Lines and Drain points overlaid on Stability Index (SI) grid created from SINMAP model. The Stability Index at each drain point is calculated by intersecting the drain points with the SI grid.
Legend Dra Ef ! ( ! ( ! ( ! ( ! ( in Points fective Length (m) 9 - 50 51 - 100 101 - 500 501 - 1000 1001 - 1500 Contour (20 m Interval) XY XY XY Stab XYRoad
ility Index Grid
Defended (SI=0) Upper Threshold (0<SI<0.5) Lower Threshold (0.5<SI<1) Quasi-Stable (1<SI<1.25) Moderately Stable (1.25<SI<1.5) Stable (1.5<SI<10) in Points fective Length (m) 9 - 50 51 - 100 101 - 500 501 - 1000 1001 - 1500 Legend Dra Ef ! ( ! ( ! ( ! ( ! ( Contour (20 m Interval) XY XY XY Stab XYRoad
ility Index Grid
Defended (SI=0) Upper Threshold (0<SI<0.5) Lower Threshold (0.5<SI<1) Quasi-Stable (1<SI<1.25) Moderately Stable (1.25<SI<1.5) Stable (1.5<SI<10)
Figure 9: Map of Stability Index Grid created from SINMAP function
±
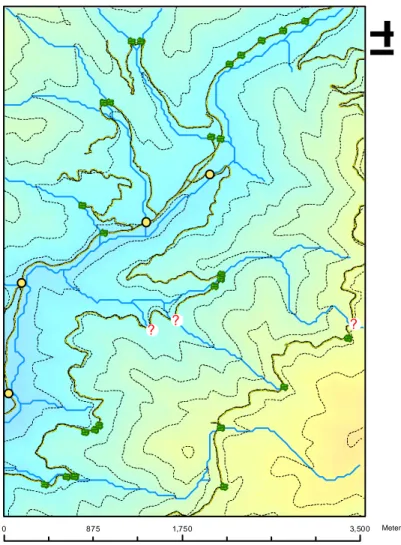
0 375 750 1,500Meters XY XY XY X Y XY X Y X Y XY X YXY XY XY XY X Y X Y XY XY XY XY X Y X Y X Y X Y X Y X Y X Y X Y X Y XY X Y X Y X Y X Y X Y X Y X Y X Y X Y X Y X Y X Y X Y X Y X Y X Y X Y X Y X Y X Y X Y X Y X Y XY XY XY XY X Y XY XY XY XY XY X Y X Y X Y X Y X Y X Y XY X Y X Y XY X Y XY X Y XY XY XY XY X YXY XY X Y XY XY XYXY X Y X Y X Y X Y X Y X Y X YXY XY XY XY XY XY X Y X Y X Y X Y X Y X Y X Y X Y X Y X Y X Y X Y X Y X Y X Y X Y X Y X Y XY XY XY XY XY X Y XY XY X Y XY XYXY X Y X Y XY X Y X Y X Y X Y X Y X Y X Y X Y X Y X Y X Y X Y X Y X Y X Y X Y XY X Y X Y X Y X Y X Y X Y X Y X Y X Y X Y X Y X Y X Y X Y X Y XY XY XYXY X Y X Y X Y X Y X Y X Y ! ( ! ( ! ( ! ( ! ( ! ( ! ( ! ( ! ( ! ( ! ( ! ( !( ! ( ! ( !( ! ( ! ( ! ( ! ( ! ( ! ( ! ( MetersUsing criteria represented in the flow chart shown in Figure 3 stream crossings that are fish passage barriers are flagged as completely blocked or partial passage or clear passage. Figure 10 shows the map of fish passage status at each stream crossing.
Legend XY XY XY XY XY Road Stream Crossing Barrier
?
Totally Blocked Partial Passage ' Clear Passage Stream Network DEM Value in meters High : 3244.15 Low : 913.95 Controur(100 m) Legend XY XY XY XY XY Road Stream Crossing Barrier?
Totally Blocked Partial Passage ' Clear Passage Stream Network DEM Value in meters Legend XY XY XY XY XY Road Stream Crossing Barrier?
Totally Blocked Partial Passage ' Clear Passage Stream Network DEM Value in meters High : 3244.15 High : 3244.15 Low : 913.95 Controur(100 m)Figure 10: Fish passage determination
±
0 875 1,750 3,500Me X Y X Y X Y X Y XY X Y X Y XY X Y X Y XY XY X Y X Y X Y X Y XY XY XY XY XY X Y XY XY XY XY X Y XY XY X Y XY X Y X Y XY X YXY XY X Y XY X Y X Y X Y XY XY X Y XY XY XY XY X Y XY X Y X Y XYXY X Y XY XY XY XY X Y X Y X Y XYXY XY XY XY XY XY X Y XY XY XY XY X Y X Y XY XY XY XY X Y X Y XY XY XYXYXY XY XY X Y X Y XY XY X Y XY X Y X Y XY XY XY XY XY XY X Y XY X YXYXY XY X YXYXYXYXYXY X YXYXYXYXYXYXY XYXYXY XYXYXYXYXYXY XY X Y XY XY XY XY X YXYXYXY XY XY X Y X Y XY XY XY X Y X Y XY X Y X Y XY X Y XY XY XY X Y XY X YXYXYXYXYXY XY X YXY X Y XY XY XY XY XY XY XY XY XY X YXYXYXYXYXY X Y XY XY X YXYXYXYXYXYXYXYXYXY XYXYXYXYXYXY XYXYXYXYXYXYXY XY XY X Y XYXY XY ters XYXY XY XY XY XY X Y X YXYXYXY X Y XY X YXYXYXY XY XY X Y X Y XY X Y XY XY XY XY X Y X Y X Y XY X Y XY XYXYXY X Y XYXYXYXYXYXYXY X YXYXYXYXYXY X YXYXYXY XY XYXYXY XYXYXYXYXYXYXYXYXYXY X Y XYXYXY XY XYXY XYXY XY XYXY X YXY XY XYXYXYXYXY XY XY XY X Y XY XY XY X Y X Y X Y XY XY XY XY X Y XY X Y X Y XY XY XYXYXY XYXYXY XYXY X YXYXYXYXYXY X YXY XY XY XY XYXYXYXYXYXYXYXY XY X YXY XYXYXYXY XYXYXYXY X Y XY XY XY XYXY XY X Y X YXY XYXYXYXYXYXYXYXYXYXYXYXY X Y XY XY XY X Y XY XY XY XY XY XY X Y XY XY XY X Y XY XY XY XYXYXYXYXY X YXYXYXYXYXYXYXY X Y XY XY X Y X YXYXY XYXYXY X Y XY XY XY X Y X Y X Y XY XY X Y XY XY XY X Y XY XY XY XY XY X Y XY X Y XY X Y XY XY X Y XY XY XY XY XY XY XY XY X Y XY XY XY X Y X Y XY XY X YXY XY X YXY XY XY XY XY XY XY X Y X Y X Y XY XY X YXY XY XY XY XY XY X Y X Y XY XY XY XY XY XY XY XY XY X Y XY XY XY X Y XY X Y XY XY XY X Y XY X Y XYXY XY X Y XY XY X Y X Y X Y X Y XY X Y X Y X Y X Y XY XY X Y X Y XY XY XY X Y X Y XY XY XY XY X Y XYXY XY XY X Y X Y X Y XY X Y X Y X Y X Y XY XY XY XY XY X Y XY X Y XY XY XY XY XY XY XY XY XY XY XY X YXYXYXYXYXY XYXYXYXYXYXY XY XYXY XYXY XY XY XYXYXYXY X Y X YXY XYXYXYXYXYXYXYXYXYXYXYXYXYXYXY X YXYXY XYXYXYXYXYXYXYXYXYXY XY X Y XY X Y X Y X Y X Y XY X Y XY XY XY XY XY XY XY X Y X Y XYXYXY XYXYXYXYXYXYXYXY XY X Y X Y X Y XY X Y X Y X Y X YXYXYXYXYXYXYXY X Y X Y X Y X Y X Y X Y XY XY X Y XY X Y XY XY X Y X Y X Y XY XY XY X Y XY XY XY XY X Y XY XY XYXYXYXYXY XY XYXYXYXYXYXYXYXY X YXYXY X Y X YXY X YXYXYXYXYXY XY X Y XY XY XY XY XY X Y X Y X Y XY XY X Y XY XY XY XY X YXYXYXYXY XY XYXYXYXYXYXYXYYXXYXYXYXYXY XY X Y X YXYXYXYXYXYXYXYXYXYXYXYXYXYXY X Y XY XY XY XY XY XY XY X Y XY XYXYXYXY X Y X YXY XY X YXYXYXYXY XYXYXYXY X Y X YXYXYXY X YXYXYXYXYXYXYXYXYXYXY XY XY XYXYXYXY XY XY X Y X Y XY XY X Y XY XYXYXY XY XY XY XY XY X YXY X Y XY XYXYXYXYXYXYXYXY XY XY XY XY X YXY X Y XY XY XY XY XYXY XY X Y XY XY XY XY X Y XY XY XY XY XY X Y XYXYXYXYXYXY XYXY XYXYXYXYXYXYXYXYXYXYXYXYXYXYXY X Y X Y XYXYXYXYXYXYXYXYXYXYXYYXXYXYXYXYXYXYXYXYXYXYXY X YXY XYXY X Y X YXYXYXYXYXY XYXY XYXY X YXY X Y XYXY X YXYXYXYXYXYXYXYXY XYXY X YXY X Y X YXY XY X Y X Y XY X Y XY XY XY XY XY X Y XY X Y X Y XYXY XY X YXY XYXY X Y XYXYXY XYXYXYXYXYXYXYXYXYXYXYXYXYXYXYXYXYXYXYXYXYXYXYXYXYXYYXXYXYXYXYXYXY XYXYXYXYXYXYXYXYXYXY XY XY XY XY XY XY X Y XY XY XY X Y X Y X Y X Y XY XY XY XY XY XY X Y XY XY XY XY X Y XY X Y X YXY XYXYXY XY XY XY XY XY XY XY XY XY XY XY XY X Y X Y X Y X Y X Y XY X Y X Y X Y XYXY X Y ' ' ' ' ' ' ' ' ' '' ' ' ' ' ' ' ' ' ' ' ' ' ' ' ' ? ? ? Meters5 Conclusion
The paper has described a set of tools to assist with managing forest roads and planning for the maintenance of road segments based on data from the USFS road inventory. Sediment production from each road segment is calculated. Sediment accumulation at each drain point is then calculated and superimposed on the DEM derived flow direction field to quantify stream sediment inputs from forest roads. A modification of the SINMAP model provides an estimate of landslide potential due to road drainage. Finally road crossings that are barriers to fish passage are identified. GIS network analysis methods are used to analyze the segmentation of habitat due to road crossing fish passage barriers. To ensure referential integrity between attributes, and validate the records a relational database model was developed. A pre-processing tool is used to validate the records before storing inside the new database model.
6 Acknowledgements
This research was supported in part by funds provided by the Rocky Mountain Research Station, Forest Service, U.S. Department of Agriculture joint venture agreement number 03-jv-11222014-050. The views and
conclusions expressed are those of the authors and should not be interpreted as necessarily representing official policies, either expressed or implied, of the US Government.
References
Black, T. A. and C. H. Luce, (2002), "A Road Inventory Strategy for Watershed Analysis," USFS Rocky Mountain Research Station, Boise, Idaho. Borga, M., F. Tonelli and J. Selleroni, (2004), "A Physically Based Model of the
Effects of Forest Roads on Slope Stability," Water Resources Research, 40(12202).
Clarkin, K., A. Conner, M. J. Furniss, B. Gibernick, M. Love, K. Moynan and S. W. Musser, (2003), "National Inventory and Assessment Procedure for
Identifying Barriers to Aquatic Organism Passage at Road-Stream Crossings," USFS San Dimas Technology and Development Center, San Dimas, CA. Cline, R., G. Cole, W. Megahan, R. Patten and J. Potyondy, (1984), "Guide for
Predicting Sediment Yield from Forested Watersheds," U.S. For. Ser. Northern Reg. and Intermountain Reg, Missoula, Mont., and Ogden, Utah. Flanagan, S. A., M. J. Furniss, T. S. Ledwith, S. Thiesen, M. Love, K. Moore and J.
Ory, (1998), "Methods for Inventory and Environmental Risk Assessment of Road Drainage Crossings," USDA Forest Service, Technology and
Development Program, 9877 1809-SDTDC, San Dimas, CA, p.52. Jones, J. A., F. J. Swanson, B. C. Wemple and K. U. Snyder, (2000), "Effects of
Roads on Hydrology, Geomorphology, and Disturbance Patches in Stream Networks," Conservation Biology, 14 (1): 76-85.
Luce, C. and T. A. Black, (1999), "Sediment Production from Forest Roads in Western Oregon," Water Resources Research, 35(8): 2561-2570.
Luce, C. and B. C. Wemple, (2001), "Introduction to Special Issue on Hydrologic and Geomorphic Effects of Forest Roads," 26(2): 111-113.
Luce, C. H. and T. A. Black, (2001), "Effects of Traffic and Ditch Mainenance on Forest Road Sediment Production," The Seventh Federal Interagency
Sedimentation Conference, Reno, Nevadad, March 25-29, 2001, p.V67-V74. Luce, C. H., B. E. Rieman, J. B. Dunham, J. L. Clayton, J. G. King and T. A. Black,
(2001), "Incorporating Aquatic Ecology into Decisions on Prioritization of Road Decommissioning," Water Resources Impact, 3(3): 8-14.
Megahan, W. F., (1974), "Erosion over Time: A Model," U S Department of Agriculture Forest Service, Intermountain Research Station, Ogden Utah. Montgomery, D. R., (1994), "Road Surface Drainage, Channel Initiation, and Slope
Instability," Water Resources Research, 30(6): 1925-1932.
Montgomery, D. R. and W. E. Dietrich, (1994), "A Physically Based Model for the Topographic Control on Shallow Landsliding," Water Resources Research, 30(4): 1153-1171.
Pack, R. T., D. G. Tarboton and C. N. Goodwin, (1998), The Sinmap Approach to Terrain Stability Mapping. 8th Congress of the International Association of Engineering Geology, Vancouver, British Columbia, Canada 21-25
September 1998.
Reid, L. M. and T. Dunne, (1984), "Sediment Production from Forest Road Surfaces," Water Resources Research, 20 (11): 1753-1761.
Swanson, F. J. and C. T. Dyrness, (1975), "Impact of Clear-Cutting and Road Construction on Soil Erosion by Landslides in the Western Cascade Range, Oregon," Geology, 3: 393-396.
Switalski, T. A., J. A. Bissonette, T. H. DeLuca, C. H. Luce and M. A. Madej, (2004), "Benefits and Impacts of Road Removal," Frontiers in Ecology and the Environment, 2(1): 21-28.
Tarboton, D. G. and D. Ames, (2001), "Terrain Analysis Using Digital Elevation Models," Presentation at Forest Service 2001 Geospatial Conference, Salt Lake City, 16-19, April.
Washington Forest Practices Board, (1995), "Standard Methodology for Conducting Watershed Analysis," Version 3.0, Washington State Department of Natural Resources, Olympia, Washington, p.B1-B52, November 1995.
Wemple, B. C., J. A. Jones and G. E. Grant, (1996), "Channel Network Extension by Logging Roads in Two Basins, Western Cascades, Oregon," Water Resources Bulletin, 32: 1195-1207.
Wold, W. L. and K. V. Dubé, (1998), "A Tool to Estimate Sediment Production and Delivery from Roads," ESRI User's Conference '98.