DISSERTATION
ANALYTICAL METHODS TO ENHANCE DETECTION OF ANTHROPOGENIC RADIONUCLIDES IN ENVIRONMENTAL MATRICES
Submitted by Brett L. Rosenberg
Department of Environmental and Radiological Health Sciences
In partial fulfillment of the requirements For the Degree of Doctor of Philosophy
Colorado State University Fort Collins, Colorado
Summer 2016
Doctoral Committee:
Advisor: Alexander Brandl Thomas Borch
Charles Henry John Pinder Georg Steinhauser
Copyright by Brett L. Rosenberg 2016 All Rights Reserved
ABSTRACT
ANALYTICAL METHODS TO ENHANCE DETECTION OF ANTHROPOGENIC RADIONUCLIDES IN ENVIRONMENTAL MATRICES
The efficacy of methods that are used to detect radionuclides is dependent on the properties of the radionuclides and the matrices being analyzed. Gamma spectroscopy is an excellent tool for detecting very low quantities of a short-lived gamma-emitting radionuclide. However, as the probability of gamma ray emission decreases and the half-life increases, greater quantities of a radionuclide are required for detection by gamma spectroscopy. Since most transuranic actinides are usually not present in such quantities or concentrations in the environment, mass spectrometry is the preferred tool. For tritium,
90Sr, and other lower-Z elements that emit no easily detectable gamma rays, liquid scintillation counting is
commonly used to measure the beta particles they emit. However, this methodology requires radiochemical extraction procedures to ensure a maximized ratio between signal and background. Nondestructive gamma spectroscopy was used to evaluate radiocesium content in soil and vegetation samples collected from the Fukushima prefecture exclusion zone in 2013 and 2014. Liquid scintillation counting was used for quantifying 3H in samples collected in 2013 and 90Sr in samples collected in 2013
and 2014. The radiocesium and 90Sr activities were found to have decreased from 2013 to 2014. Although 3H activities could be quantified in most samples, a sample from Chimeiji had a specific activity that
statistically exceeded background (1.2 ± 1.6 Bq mL-1); further investigation is required to ascertain if 3H is
present within that sample. Reports generated by TEPCO were also evaluated; radiocesium ratios and
spectroscopic interference when drawing conclusions about the presence of anthropogenic radionuclides in environmental samples.
Gamma spectroscopy was then applied to explore radiochemical separation techniques that can enhance detection of anthropogenic radionuclides, especially gamma-emitting actinides like 239Np shortly
after a nuclear event. Ion specific extraction chromatography was found to be effective at minimizing spectroscopic interference from fission products, and addition of stable iodide carrier and a precipitating agent facilitated decreasing radioiodine activity within environmental samples. Extraction
chromatography was found to reduce 131I interference by at least one order of magnitude, making it
preferred for reducing 131I activity within an environmental sample. Extraction chromatography also
avoids the potential of precipitating any analyte. The separation and measurement techniques utilized herein have effectively enhanced the ability to detect low-activity anthropogenic radionuclides;
supplemental measurements gathered from the exclusion zone confirm the observed trends and prove the necessity of minimizing interference.
ACKNOWLEDGMENTS
I want to thank the professors in the Health Physics program who enhanced my academic and professional careers. Dr. Steinhauser provided me with valuable research and publication experience; Dr. Brandl laid my academic foundations, provided specialized laboratory support, and ensured successful completion of my academic career; and Dr. Johnson provided me with national and international opportunities that have enhanced my personal and professional network.
The soil and vegetation samples collected from the Fukushima exclusion zone in 2013 and 2014, as well as dose rate data, were obtained with the help of Katsumi Shozugawa from The University of Tokyo. Entry and sampling would not have been possible without him. Dr. Steinhauser and the CSU radiochemistry students were instrumental in the analysis of radiocesium in vegetation samples. Dr. Georg Steinhauser and Joseph E. Ball conducted thorough analysis of 90Sr content in soil and vegetation
samples collected in 2013, setting the procedural and analytical framework for soil samples collected in 2014. Final measurements were obtained with the help of Justin Bell, without whom I would not have been able to achieve the goals I had set for myself.
The study on 239Np isolation and detection was supported by Grant Number T42OH009229-07
from the CDC NIOSH Mountain and Plains Education and Research Center. The authors also gratefully acknowledge funding by the U.S. Nuclear Regulatory Commission (NRC), Grant Number NRC-HQ-12-G-38- 0044. Tim DeBey from the USGS TRIGA® Reactor in Lakewood, CO, helped with generating the
radionuclides that we used, and James Self from the CSU Soil Testing Lab provided critical information about the deionized water utilized in our studies.
I also thank my friends, family, and my wife Rachael for their support during the long hours in the office and laboratory and throughout my travels. Maintaining social, personal, and professional balance is a pillar of success, and they all helped me maintain that balance.
TABLE OF CONTENTS
ABSTRACT ... ii
ANALYTICAL METHODS TO ENHANCE DETECTION OF ANTHROPOGENIC RADIONUCLIDES IN ENVIRONMENTAL MATRICES ... ii
ACKNOWLEDGMENTS ... iv
1. INTRODUCTION ... 1
Common Analytical Methods ... 1
Gamma Ray Spectroscopy ... 3
Mass Spectrometry ... 5
Liquid Scintillation Counting ... 6
Extraction Chromatography ... 8
Transuranics: Production and Implications ... 10
Movement of Contaminants ... 12
Compartment Models ... 12
The Soil Compartment: Molecular Perspectives ... 14
Applications to the Fukushima Daiichi Nuclear Accident ... 17
Project Scope... 19
2. FUKUSHIMA SAMPLE ANALYSIS ... 20
Introduction ... 20
Sample Collection and Preparation ... 21
Radiocesium Analysis ... 22
Analytical Methods ... 22
Results and Discussion ... 24
Conclusions ... 28
Tritium Analysis ... 28
Analytical Methods ... 28
Results and Discussion ... 30
Conclusions ... 32
Radiostrontium Analysis ... 32
Analytical Methods ... 32
Results and Discussion ... 36
Conclusions ... 38
Applications to the Fukushima Exclusion Zone ... 39
Ambient Dose Rate Evaluation ... 39
TEPCO Data: Iodine and Tellurium ... 44
Conclusions ... 46
3. DETECTION OF NEPTUNIUM FOLLOWING EXTRACTION CHROMATOGRAPHY OF A HIGH ACTIVITY MATRIX... 48
Introduction ... 48
Analytical Methods ... 50
Materials and radionuclides ... 50
Rainwater analogue preparation ... 52
Soil sample preparation ... 54
Sample analysis ... 54
Results and Discussion ... 55
Separation from aqueous matrices ... 55
Separation from soil matrices... 58
Conclusions ... 59
4. REMOVAL OF RADIOIODINE FROM SOIL ... 62
Introduction ... 62
Analytical Methods ... 63
Stock Solution Preparation ... 63
Radioiodine Removal... 63
Results and Discussion ... 65
Effect of carrier and AgNO3 ... 65
Effect of H2O2 ... 66 Effect of HNO3 ... 67 Conclusions ... 67 5. CONCLUSIONS ... 69 Methodologies ... 69 Lessons Learned ... 71 6. REFERENCES ... 73
7. APPENDIX A: FUKUSHIMA SAMPLE DATA ... 84
8. APPENDIX B: NEPTUNIUM-239 ISOLATION DATA ... 88
9. APPENDIX C: IODINE-131 RECOVERY DATA ... 89
LIST OF TABLES
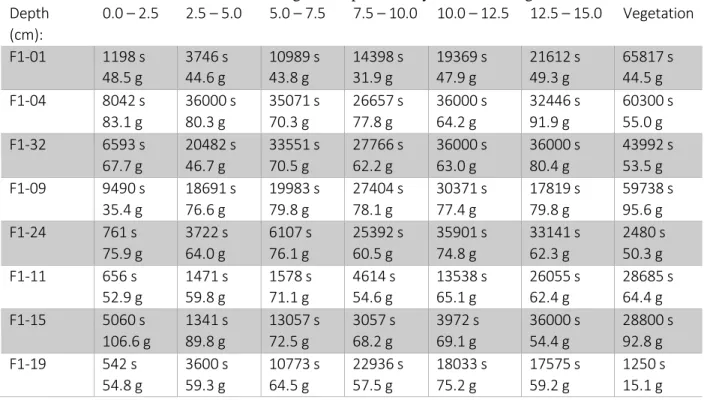
Table 1: Measurement times and masses for gamma spectrometry of soil core segments collected in 2013 ... 22 Table 2: Masses of aliquots used for 90Sr analysis of soil samples collected in 2014. Information regarding samples
processed in 2013 can be found in [52] ... 33 Table 3: Calculation of the total dose rate from external exposure to 134,137Cs at the maximum specific activities (SA)
observed within soil samples collected in 2013 (F1-19 soil core taken at the gate). The effective dose
coefficient is for contamination to a depth of 15 cm for 134,137Cs and 5 cm for 90Sr and 90Y ...42
Table 4: Preconditioning/Loading/Rinsing and Eluting Conditions of the Ion Specific Resins Used for Recovery of
239Np from Aqueous Solution (Rainwater Analogue) and Soil ... 53
Table 5: Fukushima sample descriptions and labels from June, 2013, and July, 2014 ... 84 Table 6: Specific activities of 134Cs (top) and 137Cs (bottom) in vegetation and varying depths of soil collected from
the Fukushima prefecture in June, 2013. Activities are reported in Bq kg-1 ... 84
Table 7: Specific activities (Bq kg-1) of 134Cs (top) and 137Cs (bottom) in soil samples collected from the Fukushima
prefecture exclusion zone in July, 2014 ... 85 Table 8: Tritium activity in 15 cm soil cores and vegetation samples collected in 2013. Activities are reported in Bq L-1
H2O collected. Uncertainties are expressed to 1σ ... 86
Table 9: Specific activities of 90Sr in the top 5 cm of soil cores and vegetation samples collected in 2013. Activities are
reported in Bq kg-1 dry mass. Data originally reported by Ball, J.: Deposition of strontium-90 in soil and
vegetation at various locations surrounding the Fukushima Daiichi nuclear power plant, 2015 [52] ... 86 Table 10: Specific activities of 90Sr in the top 5cm of soil cores collected from the Fukushima exclusion zone in July,
2014. Activities are reported in Bq kg-1 dry mass and are corrected to the date of sampling ... 87
Table 11: Percent recovery of radionuclides from rainwater analogues using combinations of ion specific extraction chromatography resins and eluents. Uncertainties are expressed to 1σ ... 88 Table 12: Percent recovery of radionuclides from soil matrices using ion specific extraction chromatography resins.
Uncertainties are expressed to 1σ... 88 Table 13: Percent recovery of 131I from soil using combinations of reagents in the presence and absence of stable
iodide carrier. Reagents included HNO3, AgNO3 (Ag), and 30% H2O2 ... 89 Table 14: Compilation of 131I, 132I, 132Te, 134Cs, and 137Cs activities (Bq mL-1) reported by TEPCO. Ratios were
calculated based on activities back-calculated to March 11, 2011. Sample descriptions were translated from the reports. Samples were collected from monitoring posts (MP) at Fukushima Daiichi (1F) and Fukushima Daini (2F). Some information was not provided in the reports (U) ... 90
LIST OF FIGURES
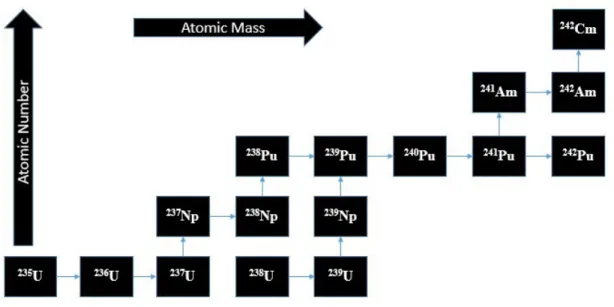
Figure 1: Representative diagram of the Hidex 300 SL ... 7 Figure 2: Extractants used in Eichrom Technologies extraction chromatography resins ...9 Figure 3: Generation of transuranic elements; each arrow to the right represents successful neutron capture
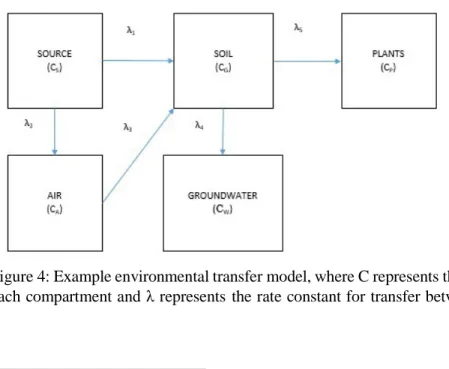
without fission, whereas each upward arrow represents beta decay of the radionuclide ...10 Figure 4: Example environmental transfer model, where C represents the total activity of a contaminant in each
compartment and λ represents the rate constant for transfer between compartments ...13 Figure 5: Diagrams of 1:1 (left) and 2:1 (right) clay structures; triangles are tetrahedral (T) layers and diamonds are
octahedral (O) layers ... 14 Figure 6: Complexation between metal ions (horizontal green stripes) and clay surfaces. White spheres represent
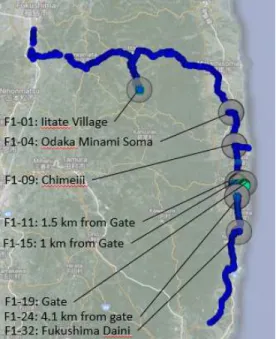
hydrogen, blue spheres represent oxygen, and spheres with vertical red stripes represent metals within the clay ... 15 Figure 7: Sample collection sites along the course of sampling in June 2013 and July 2014, which is tracked by
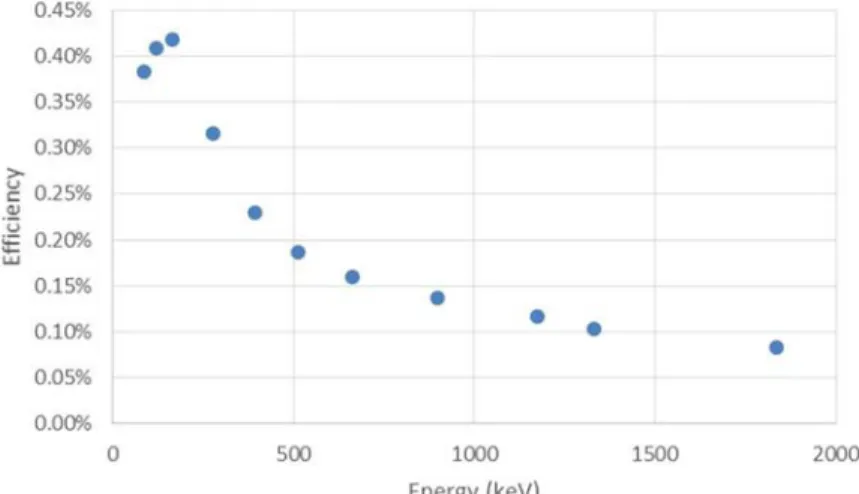
smaller circles ... 21 Figure 8: Efficiency curve for soil core segments situated at half detector height in the corner of a shielded detector
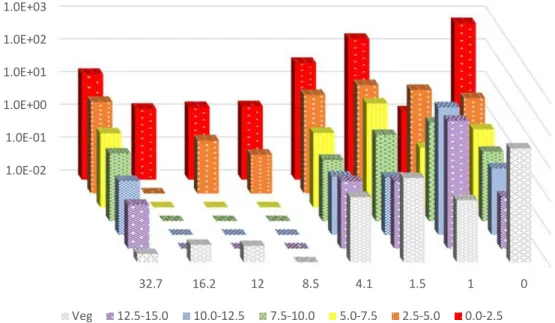
chamber ... 23 Figure 9: Efficiency curve for vegetation samples situated on the detector window inside the detector shielding ... 23 Figure 10: Specific activity of 134Cs (Bq g-1) in vegetation (Veg) and layers of soil (cm) at various distances from the
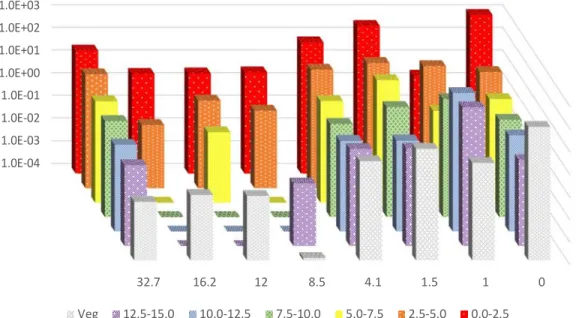
gate of the FDNPP (0 km to 32.7 km) in 2013 ... 24 Figure 11: Specific activity of 137Cs (Bq g-1) in vegetation (Veg) and layers of soil (cm) at various distances from the
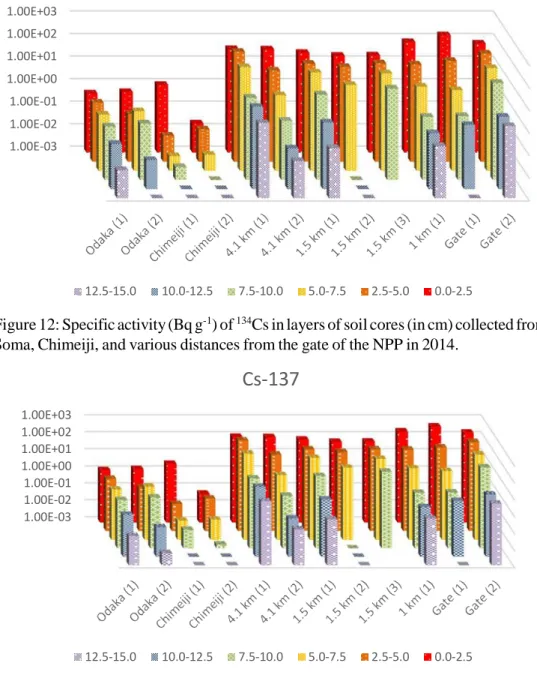
gate of the FDNPP (0 km to 32.7 km) in 2013 ... 25 Figure 12: Specific activity (Bq g-1) of 134Cs in layers of soil cores (in cm) collected from Odaka Minami Soma, Chimeiji,
and various distances from the gate of the NPP in 2014 ... 27 Figure 13: Specific activity (Bq g-1) of 137Cs in layers of soil cores (in cm) collected from Odaka Minami Soma, Chimeiji,
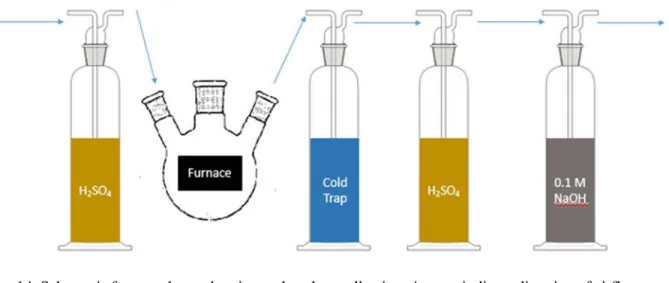
and various distances from the gate of the NPP in 2014 ... 27 Figure 14: Schematic for sample combustion and analyte collection. Arrows indicate direction of airflow ... 29 Figure 15: Specific activity (Bq mL-1 of collected H2O) of tritium in soil and vegetation samples. Uncertainties are
reported to 1 σ ... 31 Figure 16: Specific activities (Bq kg-1) of 90Sr in soil cores collected from the Fukushima exclusion zone in 2014. The
top 5 cm of soil were evaluated in 2.5 cm increments. Data for the 2.5-5.0 cm layer are unavailable for 1 km (2). Specific values can be found in Table 10 ... 36 Figure 17: Specific activities (Bq g-1) of 90Sr and 137Cs in the top 5 cm of soil samples from the Fukushima prefecture
exclusion zone in 2014. Only complete data sets are shown. Specific values can be found in Table 7 and Table 10 ... 38 Figure 18: Photographs from the Fukushima exclusion zone in 2014. Top: boats and automobiles, as well as debris,
were scattered across now open fields. Bottom: the top 5 cm of soil was bagged for storage ...40 Figure 19: Dose rates collected from the Fukushima prefecture in 2013 (top) and 2015 (bottom) along Road 252,
approximately 1 km from the gate of the NPP. Dose rates are measured in μSv h-1, with the scale in
increments of 17.5 μSv h-1 ... 43
Figure 20: Recovery of 239Np and associated volatile radionuclides from aqueous matrices; uncertainties are
expressed to 1σ ... 56 Figure 21: Recovery of 239Np and associated volatile radionuclides from soil matrices; uncertainties are expressed to
1σ ... 58 Figure 22: Graphical summary of methods ... 61
Figure 23: Radioiodine recovery in the absence of iodide carrier; refluxing was done in HNO3 and H2O2; HNO3 and
AgNO3; and HNO3 only. Uncertainties are expressed to 1σ ... 66
Figure 24: Radioiodine recovery in the presence of iodide carrier; refluxing was done in HNO3, AgNO3, and H2O2;
1. INTRODUCTION
Environmental matrices are complex systems that require specialized methodologies to enhance the detection of trace quantities of a substance. Statistically, detection is enhanced by increasing the measurement time and the amount of a substance, the latter being more effective. However, considerations must be made regarding practicality. Is it practical to measure something by gamma spectroscopy for 200 hours? Is it practical to collect 50 kg of a sample and place it on the window of a gamma detector? Other approaches must be considered, such as changing the geometry of a sample from 2π to 4π (from on the detector to in or around the detector) to maximize detection efficiency. If the environmental matrix has components that interfere too much with the desired analyte, other measures must be taken to determine how much of the analyte is present – if it is present.
A nuclear event, whether it is a major incident at a nuclear power plant or the detonation of a nuclear weapon, can bring about global concern for health and safety. Most concerns revolve around the radiological effects of the radionuclides that are generated and released, although some products of a nuclear event can be chemically hazardous as well. This introduction will bring to light methods that are commonly used to detect contaminants in environmental matrices, as well as considerations for minimizing transport of contamination in the environment and radiological exposure. The projects that are presented and discussed in following chapters will highlight analytical techniques, applications, and methodological considerations for accurate detection and quantification of anthropogenic radionuclides following future nuclear events.
Common Analytical Methods
Detection of radionuclides requires an understanding of the types of emissions during their decay and the energies of these emissions. Radioactive isotopes can have half-lives (T1/2) ranging from
average energy of 192 keV during 90% of the decays, and emits a 364 keV gamma ray following 82% of the decays. Because the gamma ray has an energy in excess of 100 keV and is emitted following a high percentage of decays, detection of this radionuclide by gamma spectroscopy is preferred, as minimal sample processing may be required for detection by gamma spectroscopy.
However, there are several instances where detection of radionuclides by their radiological properties is difficult, or practically impossible. Detection of longer-lived radionuclides, such as 238U (T
1/2 =
4.5×10⁹ y), by their radiological properties is very difficult without large quantities present within a
sample. Continuing with this example, 238U emits a 113.5 keV gamma ray following 0.01% of decays; if a
detector has an efficiency of 5% for detecting this gamma ray coming from a polypropylene container sitting directly on the detector, a count rate of 1 count per second would be practically impossible to obtain. The activity of the sample would have to be 200 kBq (5.4 μCi), which is more than 16 grams (0.85 mL) of pure 238U. If the uranium concentration in soil is assumed to be 2.3 ppm, the amount of soil in this
sample would be almost 7,000 kg [1]. For isotopes with very long half-lives, other methods like mass spectroscopy (MS) must be implemented to enhance detection of trace quantities of these radionuclides. Methods for separation can be used prior to MS to minimize interference between atoms with similar masses (isobars, such as 238U and 238Pu) and enhance the detection capability of the spectrometer.
Radiological interference can also make detection of radionuclides by their decay properties practically impossible. One example of this is quantifying the relative amounts of 239Pu and 240Pu in a
sample. The half-life of 239Pu is 24110 y, and it emits a 5.157 MeV alpha particle during 71% of its decays; 240Pu has a half-life of 6561 y and emits a 5.168 MeV alpha particle during 73% of its decays. The
resolution of a spectrum generated by alpha spectroscopy is not fine enough to distinguish between these two alpha particles. Therefore, MS is used to quantify the relative amounts of these two isotopes within a sample [2].
Similarly, detection of trace 239Np (T
1/2 = 2.4 d) in a sample containing large activities of
radiotellurium requires chemical separation. The most prominent gamma rays emitted from 239Np have
the following energies and emission probabilities: 106 keV (25%), 278 keV (15%), and 228 keV (11%). Gamma rays of similar energies are emitted from 129mTe (106 keV, 0.2%), 129Te (278 keV, 0.6%), and 132Te
(228 keV, 88%). Following a nuclear event, radiotellurium activities are orders of magnitude higher than actinide releases due to the greater volatility of tellurium and the shorter half-lives of tellurium isotopes generated following fission compared to most actinide half-lives. Unlike the previous example with plutonium isotopes, which have the same chemical behaviors, chemical separation can be conducted to sharply decrease the minimum detectable activity of 239Np within a sample containing high activities of
radiotellurium.
Gamma Ray Spectroscopy
Gamma ray spectroscopy is commonly performed using either a NaI(Tl) scintillation counter or a high purity Ge (HPGe) semiconductor detector. Scintillating materials can be either liquid or solid. A common scintillating crystal often used is sodium iodide doped with thallium, NaI(Tl). With a high effective atomic number and high density (3.67 g/cm3), these scintillation counters can have rather high
detection efficiencies. (However, the total detection efficiency of any system is also dependent on the geometry of the source relative to the detecting medium.) Photons that interact with the crystal induce excitations and ionizations within the crystal by the photoelectric effect, Compton scattering, or pair production. Electrons liberated by these interactions release their kinetic energy in the crystal, resulting in the excitation of electrons from the valence band to the conduction band. The return of the electrons to the valence band is accompanied by the emission of electromagnetic radiation; impurities such as Tl mediate this return to the valence band so that the energy released from this transition is in the visible spectrum. Photons produced within the crystal are funneled into a photomultiplier tube (PMT), where they interact with the photocathode and cause a cascading amplification of electrons by the dynodes. The
anode receives the final amplified signal, which is proportional to the energy of the initial gamma ray [3] [4].
Semiconductor detectors are different from NaI(Tl) scintillation counters in that they can quantify the energy of photons by the number of electron-hole pairs produced in the detecting medium. The semiconducting elements used, such as silicon or germanium, have four valence electrons; doping the silicon or germanium with elements that have three or five valence electrons creates regions with an excess of holes (p-region) or excess of electrons (n-region), respectively. The detector has both an n- region and p-region, and a depletion zone in between. Applying a reverse bias to the detector, where the n-region is connected to the positive terminal and p-region to the negative terminal, generates the depletion zone, which is the sensitive region of the detector. Ionizing radiation interacts in the depletion zone to generate electron-hole pairs that are proportional in number to the energy of the incident radiation. The holes and electrons travel through the p-region and n-region, respectively, and the electrons generate an electric pulse at the read-out [3] [4].
There are several notable differences between scintillation counters and semiconductor
detectors. Scintillation counters can be used to measure low-activity samples; however, they lack the high resolution of HPGe semiconductor detectors. Because of their high resolution, HPGe detectors have a greater signal-to-noise ratio, thereby reducing measurement uncertainty. Unlike scintillation counters, HPGe semiconductor detectors require cryogenic temperatures for maintenance of structural and functional integrity. The energy required to excite electrons into the conduction band of the detecting medium is only a few electron volts, thereby requiring thermal control. Additionally, HPGe detectors utilize relatively low voltages (up to 300 V) in contrast to NaI(Tl) detectors, which can require over 1000 V [3] [4].
Mass Spectrometry
Inductively coupled mass spectrometry (ICP-MS) can detect elements at concentrations on the order of parts per trillion, which is especially useful for detecting contamination by actinides in
environmental samples following a nuclear event. The sample introduction system uses a nebulizer to aerosolize the sample and mix it with argon gas. The sample is dried, atomized, and ionized by the high temperature argon laser (approximately 6000 K). The ions formed typically have a charge of +1 or +2, so elements that prefer to exist as anionic species (e.g., Cl) are selected against (unless the polarity of the electromagnets is reversed). The electromagnetic field between the sample and skimmer cones draws the sample through electrostatic lenses that separate unwanted species from the sample, reducing interference. This is accomplished by having the sample continue through an opening that is not on the axis of motion; the off-axis opening also prevents photons from interfering with the detection process. The ions then enter the quadrupole electromagnet, which filters the ions by their mass-to-charge ratios. Polyatomic ions that make it through the atomization stage are selected against using a cell gas that causes them to lose most of their kinetic energy, allowing them to be removed from the analyte. The rods of the quadrupole magnet rapidly alter their voltage, causing ions with specific mass-to-charge ratios to be systematically sampled, with resolutions between 0.7 – 1.0 amu. A cathode is struck by the ions, liberating electrons proportional to the concentration of the ions with the specified mass-to-charge ratio and generating a signal that is amplified by dynodes (similar to the PMT of the NaI(Tl) detector) [5] [6].
Using ICP-MS for environmental samples requires destruction of the samples for analysis. Although the detection limits can be sub-ppt and range nine orders of magnitude, gamma spectroscopy can detect even smaller quantities of a substance nondestructively. Coupling gamma spectroscopy with neutron activation analysis (NAA) of a sample can help with the detection of elements that may be present in even smaller concentrations.
However, NAA does have the drawbacks of matrix effects, high activities from prominent matrix components following irradiation, and the logistics of irradiating the samples at a reactor. Furthermore, actinide analysis cannot be done with NAA because of fission probabilities, and it cannot be done by gamma spectroscopy because of the very long half-lives (low activities) of most actinides, including plutonium. Thus ICP-MS would be the preferred method of analysis for actinides.
Liquid Scintillation Counting
Some radionuclides may be present in such small quantities that MS will not be sufficient. Furthermore, these radionuclides may have very poor gamma ray emissions—if any—following decay. Therefore, a method to maximize the efficiency of detecting the emission of charged particles (especially alpha and beta) is liquid scintillation counting (LSC).
Instead of placing a sample on a detector (2π geometry), LSC utilizes the principle of placing a sample in a detecting medium (4π geometry). This method maximizes the probability of radiation interacting with the ‘sensitive region’ of the detector. With detection efficiencies more than ten times those of gamma spectrometry, LSC is a desirable tool to measure radiation that deposits more energy within shorter distances (higher linear energy transfer, or LET).
Liquid scintillation counting is the primary method of detecting and quantifying radionuclides that have negligible gamma ray emissions following decay (e.g., 90Sr and 3H). However, this method requires
removal of all other potential sources of radiological interference and quench, including chemical and color quench. The higher LET radiation (beta or alpha) deposits its energy within the cocktail, exciting the organic scintillating material. The energy deposited tends to result in fluorescence in the ultraviolet energy region of the electromagnetic spectrum. The presence of specific impurities within the cocktail ensures emission of electromagnetic energy from the scintillator in the visible spectrum, thereby allowing for detection by photomultiplier tubes (PMTs); this is similar to the mechanism of NaI(Tl) inorganic scintillators. The presence of undesired chemicals or colors can decrease the signal received by the PMTs
by shifting the region of interest (ROI) towards the lower end of the spectrum. The presence of additional radionuclides, neglecting the potential chemical or color quench they may cause, can result in additional counts within the ROI and, consequently, a higher reported activity or efficiency.
The LSC detector used for low-activity beta emitters in this study is the Hidex 300 SL Liquid Scintillation Counter (see Figure 1). This detector uses three PMTs surrounding the sample vial to correct for background radiation and quench. The ideal scenario following a single decay is as follows: full deposition of the particle’s energy, isotropic emission of that energy in the form of visible light, and all three PMTs detecting that light. If only two PMTs detect light, then this signal is probably attenuated due to quench. The ratio of the number of instances where all three PMTs detect a signal to two PMTs detecting a signal is referred to as the triple-to-double coincidence ratio (TDCR), which is used to correct for quench. Background interferences are accounted for through subtraction and statistical reduction algorithms [7].
Extraction Chromatography
Interference is a problem that must be minimized for detection of low-level or low-activity analytes. Interferences for gamma spectroscopy are exemplified by similar decay energies or
overwhelming radioactivity from sources other than the analyte – the Compton spectrum generated by scattered photons can sufficiently drown out lower-energy signals. For mass spectroscopy, there may be spectroscopic interferences caused by matrix components with a mass-to-charge ratio similar to that of the analyte. With respect to LSC, both color and chemical quench are notorious for contributing to inaccurate results. Chromatography is an excellent tool that minimizes interference by preconcentrating and isolating the analyte based on chemical properties.
Two types of chromatography commonly used throughout the field of radiochemistry are extraction chromatography and ion exchange chromatography. Although both can use organic resins or polymers to bind the analyte, the former tends to rely on a mobile phase to alter the geometries of the central atoms of the polymers. The changes in geometry promote complexation of the polymers with tetravalent and hexavalent actinides and divalent metals, such as strontium and lead. Ion exchange chromatography, however, relies on competitive coulombic interactions between the analyte, mobile phase, and stationary phase for complete extraction. Much work has been conducted using extraction chromatography in optimizing actinide separations from various matrices [8] [9]. Ion exchange
chromatography has been implemented in uranium milling and reprocessing of nuclear fuel [10] [11]. Eichrom Technologies, LLC, manufactures several types of extraction chromatography resins that are utilized in the projects that will be discussed. The stationary phase of extraction chromatography columns is made up of resins containing organic polymer extractants. The affinities of these extractants for actinides and other metals is measured by a capacity factor nn; this factor is proportional to the ratio
of the volume of the stationary phase to the volume of the mobile phase that can be applied to the column (referred to as free column volumes). The equation for nn is
nn = (1.1)
where is the volume of the stationary phase, and is the volume of the mobile phase. The volume distribution ratio is the density of the resin multiplied by the fractional sorbed activity in a known volume of solvent per mass of stationary phase. As the pH of the mobile phase changes, the nn of the
resin changes as well. As nn increases, the affinity of the resin to a specific ion increases. The nn value for
a specific analyte depends on the resin, acid (commonly nitric or hydrochloric), and pH.
Different extractants employ different methods of complexing ions (shown in Figure 2 below). The use of nitric acid promotes the formation of nitrato complexes between the extractant and the analyte for octylphenyl-N,N-di-isobutyl carbamoylphosphine oxide (CMPO) and diamyl, amylphosphonate (DAAP). These nitrato complexes result in displacement of water molecules in the hydration spheres of the cations. The presence of phosphonyl groups in the RE, TEVA, TRU, and UTEVA Resins from Eichrom Technologies use this method of complexing ions. The presence of two phosphonyl groups in the Actinide Resin makes P,P’-di(2-ethylhexyl)methanediphosphonic acid (DIPEX®) a rather potent extractant that requires dissolution of the stationary phase for complete elution of actinides. Alternatively, crown ethers such as 4,4'(5')-di-t-butylcyclohexano 18-crown-6 are size-specific extractants. The Sr Resin from Eichrom Technologies uses this technology [12] [13].
Transuranics: Production and Implications
Uranium isotopes and transuranic elements (Np, Pu, Am, Cm) are most indicative of the “state” of a reactor core in the course of a nuclear accident. As these elements exhibit the lowest volatility among those present within the fuel, these elements would be indicative of the temperatures achieved within the core [14].
The transuranic elements are produced within the core by neutron capture and consequential beta decay of uranium and the higher Z elements (see Figure 3). The probability of neutron capture depends on the nuclear properties of a given nuclide, and the successive neutron capture required for higher mass transuranics becomes increasingly less likely. Curium, americium, plutonium, and 237Np all
have probabilities of decaying by spontaneous fission, and undergoing fission as a result of neutron capture. When considering a sample of uranium, the probability of neutrons being captured by the same uranium atom decreases with each neutron capture as well. Therefore, the probability of detecting, for example, plutonium isotopes in the environment following a nuclear event (either reactor meltdown or nuclear weapon) is far more likely than detecting curium.
Figure 3: Generation of transuranic elements; each arrow to the right represents successful neutron capture without fission, whereas each upward arrow represents beta decay of the radionuclide.
Actinides can suggest the mechanism behind a nuclear accident as well. The nuclear power plant in Chernobyl underwent a nuclear power excursion. This is indicated by the significant quantities of actinides released [15]. The sudden heat from fission resulted in flash vaporization of the coolant and rupturing of the containment vessels. The graphite moderators were consequently exposed to air, causing their ignition under high temperatures. The resulting fire spurred the continuous release of radionuclides for 10 days [16].
Alternatively, explosions at the Fukushima Daiichi nuclear power plant were caused by the ignition of hydrogen that was vented off from the containment vessels. Upon loss of cooling capabilities, temperatures within the core were high enough (>1170 K) to oxidize the Zr cladding with the coolant present and generate H2 gas [17]. The H2 was vented off into the reactor buildings, mixing with the air, to
prevent rupturing of the vessels from H2 buildup. The H2 reacted with the O2 in the air causing explosions
in Building Units 1, 3, and 4. Building Unit 2 experienced a H2 explosion in the condensation chamber [16].
Because these explosions were chemical in nature and did not result from reactions (chemical or physical) on the level of the fuel, actinide releases were orders of magnitude less than those in Chernobyl.
Plutonium analysis following a nuclear event requires one to distinguish ‘old’ Pu from ‘new’ Pu due to the long half-lives of the most prominent isotopes generated by either nuclear explosions or reactor accidents (238Pu T
1/2 = 87.74 y; 239Pu T1/2 = 2.4×10⁴ y; 240Pu T1/2 = 6563 y). Distinguishing ‘old’ from
‘new’ is accomplished by evaluating the isotopic ratios 240Pu/239Pu and 238Pu/239+240Pu, as done by Cagno
and colleagues [2]. These ratios are measured using both mass spectrometry (sector field inductively coupled plasma (SF-ICP-MS) or accelerator (AMS)) and alpha spectrometry, thus requiring two different preparatory methods. Cagno and colleagues had to dissolve and destroy alpha spectrometry samples for analysis by either SF-ICP-MS or AMS. Laser ablation quadrupole ICP-MS was also used in this study and did not require destruction of prepared samples.
Alpha spectrometry cannot be used alone to distinguish 239Pu from 240Pu because the
monoenergetic alpha particles that are emitted during decay are very close in energy (5.157 MeV and 5.168 MeV, respectively). Because 238Pu emits an alpha particle with an energy of 5.499 MeV, this energy
difference provides for enough resolution in alpha spectrometry to determine the 238Pu/239+240Pu ratio.
Movement of Contaminants Compartment Models
The release of contaminants into the environment can be modeled using compartments, such as those represented in ICRP 43, Principles of Monitoring for the Radiation Protection of the Population. Compartments include groundwater, plants, animals, and humans. The flow of radionuclides between compartments is represented by differential equations that assume the flow rate from a compartment is dependent only on the total activity of a radionuclide within the compartment. These differential
equations are first order: The rate of change of activity is equal to a rate constant multiplied by the total activity, which is assumed to be a function of time only.
An example of a system modeled by compartments is diagrammed in Figure 4. The source can be representative of any number of scenarios, including a reactor during the course of a nuclear event or a leaking waste drum. The activities of radionuclides within a compartment change as a function of time and are assumed independent of the activities in other compartments, properties of other compartments that would affect transfer rates, etc. The first order differential equations that would represent, for example, the soil and plants compartments are, respectively:
= + − − (1.2)
I I I I I I
=
I
(1.3) where represents the activity of a contaminant within each compartment and represents the rate constant for transfer between compartments. The value of is dependent on the effective half-life (-n )
ln 2 =
-n
(1.4) Exposure of an individual to the radiation emitted from a single radionuclide could be from standing on the soil, near the source, surrounded by plants, inhaling aerosolized particles. The different properties of these compartments would result in varying dose contributions. For example, the dose rate for an individual standing in a semi-infinite cloud of 1 Bq·m-3 137Cs is 1.6×10⁻¹ nSv·h-1, calculated using Eq.
(1.5) below [18]:
= 0.25 (1.5)
where is the submersion dose rate from gammas in the cloud, is the photon energy (0.662 MeV), and is the concentration in μCi mL-1 . If the same concentration were to be found in the
soil through infinite depth (assuming uniform density, moisture content, etc.), the dose rate to an individual standing on the surface would be 6.5×10⁻⁵ nSv·h-1.* This is orders of magnitude less than the
submersion dose for the same volumetric concentration. Similarly, by the inverse square law, standing 1 m away from a point source that has an activity of 1 Bq would yield a dose rate of 1.1×10⁻⁴ nSv·h-1. This is
more than standing on contaminated soil, but still far less than the dose from standing in the cloud.
Figure 4: Example environmental transfer model, where C represents the total activity of a contaminant in each compartment and λ represents the rate constant for transfer between compartments.
* This value was obtained using effective dose coefficients for humans from [18] for 137mBa, which is the daughter
The Soil Compartment: Molecular Perspectives
Soil has many extrinsic and intrinsic variables that affect the movement of contaminants. For simplicity, only pH and soil organic matter (SOM) will be discussed in this section as they pertain to the short-lived actinide 239Np and longer-lived 134Cs, 137Cs, and 90Sr (half-lives being 2.1 y, 30.1 y, and 28.8 y,
respectively). The mobility and reactivity of a radionuclide in soil depends on the soil type and the speciation of the radionuclide. Soils vary by texture (fractional composition of clay, sand, and silt) and the structural composition of the component clays. Clays can either be 1:1 in structure (e.g., kaolinites), 2:1 (e.g., micas), or combinations thereof. (The ratios refer to the organization of tetrahedral and octahedral layers, as shown in Figure 5.) The presence of SOM adds to the complexity by altering a radionuclide’s mobility and its availability to both microorganisms and soil binding sites.
Figure 5: Diagrams of 1:1 (left) and 2:1 (right) clay structures; triangles are tetrahedral (T) layers and diamonds are octahedral (O) layers.
The speciation of a radionuclide is dependent on soil pH and the oxygen content, which is partially dependent on the hydration of the soil. For example, if soil is saturated following heavy rainfall, a reducing environment is created, resulting in changes in oxidation states and potentially solubility and reactivity. Although the causes and effects of variations in reducing potential (pe) will not be extensively discussed here, the relationship between pe and pH should be identified. As the soil pH decreases, a substance is more easily oxidized. This is especially important for actinides, which tend to exhibit multiple oxidation states, thereby impacting their speciation, solubility, and mobility.
4
Cesium is a relatively simple contaminant. It has been shown to behave like an alkali metal in its solubility and preferred oxidation state (+1) [19] [20]. Its ionic size and radius ratio with oxygen, however, do allow it to undergo isomorphic substitution with Rb+, Ba2+, and K+ that are bound in minerals with
coordination number 12 (cuboctahedron) geometry [21]. By extended X-ray absorption fine structure spectroscopy (EXAFS), the Cs – O bond distances have been measured between 3.2 Å and 4.3 Å. The shorter distance has been associated with outer-sphere complexes, in which the Cs ion is still hydrated. The longer distance has been associated with less mobile inner-sphere complexes with siloxane groups either at frayed edge sites or within the interlayer (see Figure 6) [19].
Figure 6: Complexation between metal ions (horizontal green stripes) and clay surfaces. White spheres represent hydrogen, blue spheres represent oxygen, and spheres with vertical red stripes represent metals within the clay.
The trapping of Cs in interlayer sites by heating or desiccation can result in significant retardation of the leaching of Cs [20] [21]. Rosso and colleagues discuss how opening the interlayer of muscovite promotes the diffusion of K out of the interlayer space and consequent diffusion of Cs into the interlayer and the dehydration of the Cs ion, collapsing the interlayer. The stronger the negative charge of the interlayer, the more favorable the exchange [20]. Coleman and colleagues, however, identify K+ and NH +
ions as effective Cs+ ion exchangers for montmorillonite, illite, kaolinite, and vermiculite [22].
Strontium has an observed coordination number 8 and can therefore undergo isomorphic substitution with Rb+, Ba2+, K+, Ca2+, and Na+ [21]. Strontium can undergo ion exchange with interlayer K+,
2
result in precipitation of SrCO3 [23]. Rahnemaie and colleagues evaluated the complexation of Sr on
goethite, identifying Sr as having a weaker interaction than the lighter alkaline earth metals Ca and Mg. The adsorption edge of Sr on goethite suggests outer-sphere complexation, although the nature of the complex (monodentate or bidentate) is uncertain [24]. Miller and Reitemeier show that CaCl2 is 10 times
more effective at leaching Sr through various soils than Na, confirming the preferential binding of Ca over Sr to soil surfaces [25].
Neptunium, like other actinides, can exist in multiple oxidation states. Its most mobile form in groundwater is identified as Np(V), with its transport rate accelerated by the presence of humic acid [26]. Reduction of Np(V) to Np(IV) is possible with Fe(II) and ascorbic acid, suggesting that excessive rainfall can reduce the mobility of Np through reductive dissolution of iron and the consequential reduction of Np. Sorption of Np(V) on goethite has been characterized as mononuclear with two oxygen atoms at 1.85 Å and five oxygen atoms at 2.51 Å, similar to dissolved NpO + in water [27]. Arai and colleagues modeled Np(V) sorption as monodentate inner-sphere and bidentate outer-sphere carbonato complexes in high pH systems (pH > 8), with its adsorption on hematite, amorphous iron oxyhydroxide, manganite, and hausmanite surfaces increasing with pH [28].
A high soil pH is associated with decreased mobility of Np, Sr, and Cs within a soil column. An increase in the pH has been shown to promote sorption of Np(V) through carbonato inner- and outer- sphere complexes. Furthermore, a high pH would promote precipitation of Sr in the form of SrCO3,
resulting in a decrease in its ionic activity. Cesium, as observed in the laboratory setting alone, is easily removed from soil in very acidic conditions by cation exchange. Giannakopoulou and colleagues showed that the maximum sorption of Cs occurs around pH 8 for various soil textures due to the increased charge density of soil binding sites. However, above this pH, the sorption of Cs declines, possibly because of the formation of carbonate and hydroxide species in conjunction with the disruption of inner- and outer- sphere complexes [29] [30].
Organic matter tends to affect mobility of iodine more prominently than the mobility of Cs and Sr. Desorption of Cs by humic substances depends on the clay type; it was shown that the presence of humic substances does depress the sorption of Cs across clay types, but desorption was not observed for the 2:1 clay illite [31]. Sakamoto and colleagues found that humic substances greatly decrease the sorption of Np(V) in soil above pH 7. Below pH 7, there was very little effect on Np(V) sorption [32]. Similarly, it was found that actinides in the IV, V, and VI oxidation states, including U and Pu, are strongly complexed with humic acids such that carbonate complexes are prevented and humic acid mobility governs actinide mobility, especially at neutral or alkaline pH [33].
Remediation strategies revolve around maintaining pH levels around 7 or 8. Under these conditions, sorption is at a maximum for Cs [30] and Sr [34], and actinides would be complexed with the soil directly or through complexation with humic acids. Furthermore, slightly basic conditions would increase the charge density on clay particles and promote metal sorption by inner-sphere complexation such that the sorption would be less sensitive to ionic strength effects [35]. Due to the high cation exchange capacity of clays, the top layer (up to 5 cm) may be removed under these conditions with a large fraction of the contamination contained.
In the instance of radionuclide contamination following a nuclear accident, the kinetics of radiocesium, radiostrontium, and especially Np would be difficult to predict. As demonstrated in the laboratory setting, detectable activity of 131I in a solution did not indicate that the iodine would behave as
it would in molar concentrations (see Chapter 4). For such small quantities of radionuclides, especially actinides, we can assume that, if they are in a mobile form in soil, their ionic activities are equal to their concentrations. However, their kinetics may need to be promoted using stable carriers.
Applications to the Fukushima Daiichi Nuclear Accident
Although the March 2011 nuclear accident at the Fukushima Daiichi Nuclear Power Plant occurred five years ago, there are still detectable quantities of radiocesium (both 134Cs and 137Cs) in parts
of the exclusion zone contributing to the dose rates from soil and vegetation. In addition to these two compartments that have been exemplified earlier, there are several more compartments, including mushrooms that concentrate the cesium and wild boar that ingest the mushrooms. The lingering presence of radionuclides in the soil and vegetation can be explained by the half-lives of 134Cs, 137Cs, and 90Sr; circulation and sequestration by the compartment model; and their behaviors in Japanese soils.
Soil type can influence mobility of radionuclides within a soil column. A soil map of Japan from 1971 indicates that most soils within 100 km of the NPP are cambisols or stagnosols [36] [37]. According to other studies that have been conducted on soils in the Fukushima prefecture, the predominant soil type seems to be fluvisol, although regosols, andosols, cambisols, and gleysols have been identified [38] [39] [40]. Uematsu and colleagues identified that the soils of most agricultural fields are andosols and gleysols (23 of their 51 samples were andosols, and 19 were gleysols) [41].
Radiocesium is retained more in soils with higher clay content. The percent clay content in soils studied by Lepage and colleagues ranged from 8-16%, and soil densities ranged from 0.7-1.3 g cm-3 [40].
Several soils from the Fukushima prefecture analyzed at Colorado State University have radiocesium in the top 5 cm only; other soils have radiocesium activities exponentially decreasing with depth. These findings suggest the presence of 2:1 clays such as vermiculite or montmorillonite, which contain Al, Mg, and Fe oxides [42]. Interstratified dioctahedral chlorite/montmorillonite has also been reported [42]. These types of clays could contribute to the trapping of radiocesium either in the top layer or in deeper layers.
Paddy cultivation of rice increases the mobility of Cs in soil and makes it more bioavailable. Paddy cultivation results in putrefaction, thus generating ammonia which, when dissolved in water, forms the ammonium ion. This ion is, as mentioned above, an efficient exchanger for Cs ions adsorbed on clay minerals [43]. The increased bioavailability of Cs results in its removal from soil by uptake in addition to leaching and decay. This could result in a larger contribution to ambient dose rate than estimated from
models that account for only leaching and radioactive decay. According to a study by Saito and
colleagues, 71% of the external effective dose in 2011 was from 134Cs and 28% from 137Cs; based on half-
lives alone, 137Cs would be the main contributor to the external effective dose 3 years following the
accident [44]. Project Scope
The set of radioanalytical studies that will be discussed will allow for evaluation of methods that enhance detection of anthropogenic radionuclides in the environment. These methods can be used on soil and aqueous matrices collected from an environmental site and processed within a laboratory setting. The first project is an in-depth analysis of soil and vegetation samples collected in June 2013 and July 2014 from the Fukushima prefecture. These samples were analyzed for radiocesium, 90Sr, and
tritium. Dose rates were mapped during the course of the collection; the maps presented herein are for demonstration purposes and provide inconclusive data regarding dose rates as they pertain to areal soil and vegetation. The second project demonstrates the capabilities of ion specific extraction
chromatography. Although the methods used in this study are reflective of efforts to preconcentrate and isolate actinides from each other, this study evaluates the behaviors of volatile radionuclides through the extraction chromatography process. This project motivated an evaluation of the removal of radioiodine from soil by chemical methods, which exemplifies how radiologically detectable quantities of a substance may not behave kinetically as they would in molar concentrations.
2. FUKUSHIMA SAMPLE ANALYSIS
Introduction
Radiocesium concentrations and migration in soils around Japan following the 2011 Great Tohoku Earthquake have been analyzed extensively. Some of those analyses were summarized above (Chapter 1). However, the amount of information available on 90Sr and 3H in soils following the nuclear accident at
Fukushima Daiichi NPP is not nearly as extensive. Potential reasons for this are the difficulties associated with detecting and quantifying these latter radionuclides.
Strontium is an alkaline earth metal that behaves like calcium chemically and, consequently, physiologically. The fission product 90Sr is a pure beta-emitting radionuclide with a half-life of 28.8 y.
Furthermore, its daughter 90Y is also a beta-emitting radionuclide with a half-life of 64 h. Whereas the
maximum energy of the 90Sr beta particle is 0.55 MeV (0.20 MeV average energy), the maximum energy
of its daughter is 2.28 MeV (0.93 MeV average energy). Within three weeks, these two radionuclides will reach secular equilibrium, effectively doubling the number of beta emissions interacting with the body. The danger associated with 90Sr is its tendency to localize to the bone and cause leukemia or skeletal
cancer. For safety, food products following the Fukushima Daiichi NPP accident were screened for the most prominent radionuclides: 134,137Cs and 90Sr [45]. Across the samples, 90Sr tended to exhibit activities
less than 10% of radiocesium activities [45].
Tritium is a naturally occurring radioisotope of hydrogen generated by cosmic rays, specifically fast neutrons, interacting with atmospheric nitrogen. Tritium has a half-life of 12.3 y and emits a 0.018 MeV (0.006 MeV average) beta particle in 100% of its decays to 3He. The 3H that exists in the natural
background, in conjunction with its long half-life and low energy of decay, makes it difficult to quantify low levels of anthropogenic tritium. The generation of tritium as a ternary fission product and as a byproduct of reactor cooling has resulted in elevated background levels. The difference in mass between
3H and stable 1H can result in kinetic isotopic effects in its transport through the environment [46] [47].
Although predominantly in the form of HTO (tritiated water), 3H may be incorporated into organic
compounds; this is referred to as organically bound tritium (OBT). Therefore, its complete isolation from soil and vegetation matrices involves heating samples to temperatures that induce combustion.
In June 2013 and July 2014, soil and vegetation samples were collected from unremediated locations within the Fukushima prefecture. The soil and vegetation samples collected in 2013 were analyzed for radiocesium by gamma spectroscopy, and then 90Sr and 3H by LSC. The soil samples collected
in 2014 were analyzed for radiocesium and 90Sr only. Specific activities are compared between sampling
years and locations.
Sample Collection and Preparation
Soil and vegetation samples were collected at the locations outlined in Table 5 and represented in Figure 7. An AMS soil core sampler was used to collect the top 15 cm of soil in a plastic liner (15 cm length, 5.7 cm diameter) within 15 feet from the roadway. The samples were deep-frozen, then sliced into 2.5 cm segments. The vegetation samples were grab samples that were deep-frozen in Ziploc® bags.
Figure 7: Sample collection sites along the course of sampling in June 2013 and July 2014, which is tracked by smaller circles.
Radiocesium Analysis Analytical Methods
Soil core sections were measured in a roll top counting shield detector for variable times to ascertain radiocesium content. Instead of placing samples on the detector window, the samples were placed within a corner of the chamber at one half of the detector height to minimize the potential for random coincidence and high dead time. Measurement times and masses are presented in Table 1. Table 1: Measurement times and masses for gamma spectrometry of soil core segments collected in 2013.
Depth (cm): 0.0 – 2.5 2.5 – 5.0 5.0 – 7.5 7.5 – 10.0 10.0 – 12.5 12.5 – 15.0 Vegetation F1-01 1198 s 48.5 g 3746 s 44.6 g 10989 s 43.8 g 14398 s 31.9 g 19369 s 47.9 g 21612 s 49.3 g 65817 s 44.5 g F1-04 8042 s 83.1 g 36000 s 80.3 g 35071 s 70.3 g 26657 s 77.8 g 36000 s 64.2 g 32446 s 91.9 g 60300 s 55.0 g F1-32 6593 s 67.7 g 20482 s 46.7 g 33551 s 70.5 g 27766 s 62.2 g 36000 s 63.0 g 36000 s 80.4 g 43992 s 53.5 g F1-09 9490 s 35.4 g 18691 s 76.6 g 19983 s 79.8 g 27404 s 78.1 g 30371 s 77.4 g 17819 s 79.8 g 59738 s 95.6 g F1-24 761 s 75.9 g 3722 s 64.0 g 6107 s 76.1 g 25392 s 60.5 g 35901 s 74.8 g 33141 s 62.3 g 2480 s 50.3 g F1-11 656 s 52.9 g 1471 s 59.8 g 1578 s 71.1 g 4614 s 54.6 g 13538 s 65.1 g 26055 s 62.4 g 28685 s 64.4 g F1-15 5060 s 106.6 g 1341 s 89.8 g 13057 s 72.5 g 3057 s 68.2 g 3972 s 69.1 g 36000 s 54.4 g 28800 s 92.8 g F1-19 542 s 54.8 g 3600 s 59.3 g 10773 s 64.5 g 22936 s 57.5 g 18033 s 75.2 g 17575 s 59.2 g 1250 s 15.1 g A multi-radionuclide calibration standard was created using sand and 2 M HCl. A 2.5 cm tall section of core tubing that was used for sampling was filled with sand, then water to saturation. After noting the mass of sand and volume of water added to the tubing, the tubing was emptied, cleaned, and refilled. The tubing was filled with an equivalent volume of 2 M HCl and 0.101 g Eckert & Ziegler multi- radionuclide standard (standard 1701-68, reference date December 1, 2013), followed by the same mass of sand used previously. This protocol prevented incomplete mixing of the multi-radionuclide standard with the sand. The efficiency curve is displayed in Figure 8.
Figure 8: Efficiency curve for soil core segments situated at half detector height in the corner of a shielded detector chamber.
Vegetation samples were measured directly on the window of the detector. Aliquots of the deep- frozen samples were transferred from their respective bags and placed into separate Nalgene containers for measurement. With the exception of VegF2, which was placed in a 60 mL translucent plastic
container, vegetation samples were placed in 125 mL Nalgene containers for measurement. The masses and measurement times are listed above in Table 1, and the efficiency curve for these samples is
displayed in Figure 9. Since VegF2 had high levels of cesium activity, it was situated in the same geometry as the soil samples.
Figure 9: Efficiency curve for vegetation samples situated on the detector window inside the detector shielding.
Results and Discussion
Radiocesium tends to exhibit an exponential distribution with depth as a result of its mobility in soil [36] [38] [39] [40] [48]. The data presented in Figure 10 and Figure 11 show, respectively, 134Cs and 137Cs distributions at various distances from the gate of the Fukushima Daiichi Nuclear Power Plant.
Activities in these figures have been time-corrected to the date of sampling (June 6, 2013). The activity of radiocesium tends to increase in lower depths for the sample collected 1 km from the gate. This trend suggests a decrease in sand content with increasing depth or a potential sink more than 5 cm below the surface. Samples collected from the gate and in Iitate Village have exponential distributions of
radiocesium, although the gate sample has a surface activity in excess of a value that would be
extrapolated from the other layers. The higher activity in the top layer of the soil core from the gate may be a result of loose contamination that has settled in that area.
1.0E+03 1.0E+02 1.0E+01 1.0E+00 1.0E-01 1.0E-02 32.7 16.2 12 8.5 4.1 1.5 1 0 Veg 12.5-15.0 10.0-12.5 7.5-10.0 5.0-7.5 2.5-5.0 0.0-2.5
Figure 10: Specific activity of 134Cs (Bq g-1) in vegetation (Veg) and layers of soil (cm) at various distances
1.0E+03 1.0E+02 1.0E+01 1.0E+00 1.0E-01 1.0E-02 1.0E-03 1.0E-04 32.7 16.2 12 8.5 4.1 1.5 1 0 Veg 12.5-15.0 10.0-12.5 7.5-10.0 5.0-7.5 2.5-5.0 0.0-2.5
Figure 11: Specific activity of 137Cs (Bq g-1) in vegetation (Veg) and layers of soil (cm) at various distances
from the gate of the FDNPP (0 km to 32.7 km) in 2013.
Vegetation sample activities relative to soil activities varied across the sampling sites. The specific activity of 134Cs in vegetation from Iitate Village (F1-01) was well below the specific activity of 134Cs in the
12.5 – 15.0 cm layer of soil. However, 134Cs was not detected below the top 5 cm in Odaka Minami Soma
(F1-04) and Fukushima Daini (F1-32). The presence of radiocesium in vegetation samples with specific activities similar in magnitude to some of the top layers of soil suggests the majority of the Cs detected in vegetation is from surface contamination. This could be confirmed in future samples by thoroughly cleaning the samples of any deposited radiocesium during the sample preparation phase. The specific activities of radiocesium in vegetation 4.1 km from the gate and closer are comparable to those within different layers of the soil column.
Although the vegetation activity is more than an order of magnitude lower than surface
contamination levels for all sites except for F1-15, the potential for uptake should be investigated at the locations closer to the gate. The higher activities closer to the gate would propagate smaller uncertainties than those associated with activities that may approach or fall below the minimum detectable activity, as
was observed for radiocesium in several of the lower layers of soil at locations farther from the gate. The vegetation samples collected were neither characterized nor rinsed, yielding a gross count of
contamination for a grab sample. Rinsing the vegetation after obtaining the gross count would yield the fraction that was incorporated into the plant tissue. This analysis could be coupled with an evaluation of the potassium content in the soil, which has been shown to affect cesium uptake in vegetation [49] [50]. Such an evaluation would provide additional information about enhancing or inhibiting radiocesium uptake by plants in that area for purposes of bioremediation or reducing the transfer of radiocesium into plant and, ultimately, animal tissues.
With few exceptions, the 134Cs specific activity was consistently a factor of 2 smaller than the 137Cs
specific activity across the samples. If the activities are extrapolated back to the time of the accident, the
134/137Cs activity ratios were consistently under 1, with the exception of samples from Chimeiji and Odaka
Minami Soma. However, all ratios were within the range of 0.907 and 1.045, as found by Komori and colleagues [51]. Based upon the ratios, and the activities of 134Cs and 137Cs released from each reactor, it
should be possible to ascertain the extent of contamination from each reactor. To do so would require a least squares analysis based upon the assumption that the activity ratio for each reactor remained constant during the course of their releases.
Samples collected in July of 2014 were analyzed for radiocesium at The University of Tokyo.† The
sample sites were the same as those sampled in 2013, with the exception of Iitate Village and Fukushima Daini. The results of these analyses are displayed in Figure 12 and Figure 13. Contrary to Figure 10 and Figure 11, the absence of data in these figures indicates that those layers could not be collected due to the wet terrain. Multiple samples were taken at locations, with the exception of 1 km from the gate.
† Samples collected in July, 2014, were analyzed for radiocesium by Katsumi Shozugawa at The University of Tokyo,
Komaba. Measurements are not decay-corrected since activities calculated at the time of measurement were assumed representative of activities at the time of sampling.
These figures display the variability of the radiocesium distribution within a soil column in a single location. 1.00E+03 1.00E+02 1.00E+01 1.00E+00 1.00E-01 1.00E-02 1.00E-03 12.5-15.0 10.0-12.5 7.5-10.0 5.0-7.5 2.5-5.0 0.0-2.5
Figure 12: Specific activity (Bq g-1) of 134Cs in layers of soil cores (in cm) collected from Odaka Minami
Soma, Chimeiji, and various distances from the gate of the NPP in 2014.
Cs-137
1.00E+03 1.00E+02 1.00E+01 1.00E+00 1.00E-01 1.00E-02 1.00E-03 12.5-15.0 10.0-12.5 7.5-10.0 5.0-7.5 2.5-5.0 0.0-2.5Figure 13: Specific activity (Bq g-1) of 137Cs in layers of soil cores (in cm) collected from Odaka Minami
Soma, Chimeiji, and various distances from the gate of the NPP in 2014.
Radiocesium activities did decrease between 2013 and 2014. There are several differences, though, between samples from each year. In 2013, 6 of the 8 soil cores had more than 90% of the radiocesium activity in the top 5 cm of soil. Iitate Village and the soil 1 km from the gate had 87% and
84% of the radiocesium activity in the top 5 cm, respectively. In 2014, 5 of the 12 soil cores had more than 90% of the radiocesium activity in the top 5 cm of soil. Two of these 5 samples were a sample from the gate and a core 4.1 km from the gate. The second cores from each of these two sites had less than 70% of the activity in the top 5 cm. Since the areas sampled had not been remediated, this variation within the sites confirms the necessity of further considerations in predicting long-term behavior. Conclusions
Although transport of radiocesium through soil is well-characterized, long-term behaviors are still difficult to predict. Micro-variations within the environment, the climate, and biota all influence the transport of 134,137Cs. The samples collected from 2013 and 2014, although from the same sites, displayed
different distributions. The varied distributions also held true between the samples collected in 2014. Despite the laborious nature of collecting and slicing the soil cores, the analysis for radiocesium is rather simple and rapid. The caveat, though, is that longer analysis times are required for the minimum detectable activity to decrease.
Tritium Analysis Analytical Methods
Aliquots of vegetation samples, the top 2.5 cm of soil samples, and the bottom 2.5 cm of soil samples were analyzed for tritium. Samples were situated in a flask inside of a Thermolyne F-A1730 benchtop muffle furnace with tubing that directed airflow through a series of traps, driven by a vacuum. The first trap, preceding the furnace, was a desiccator consisting of concentrated sulfuric acid. In line behind the furnace was a cold trap for moisture generated from drying and combustion of the samples; the cold trap was a tube submerged in a vessel of dry ice and ethanol, with dry ice added to the trap through the course of combustion to ensure temperatures within the tube were below freezing. A diagram of the setup is shown in Figure 14.
The temperature of the furnace was set to 110 °C, then increased to 440 °C. The samples were held at each temperature for 10 minutes. These temperatures were established during preliminary trials to minimize odors and coloring of the analyte in the cold trap and maintain the integrity of the setup.
After the analyte was collected, the volume was ascertained by the mass difference of the cold trap tube. The cold trap was rinsed with PerkinElmer Ultima GoldTM LLT cocktail into a plastic liquid
scintillation counting vial with 18 mL cocktail. Measurements were conducted on the Hidex 300 SL Liquid Scintillation Counter (LSC) for 12 hours in triplicate with at least 8 hours of dark-adapting preceding each measurement.
Additional traps proceeded the cold trap for attempts to measure 14C. An additional sulfuric acid
trap was installed to minimize the flow of particulates resulting from combustion. In line behind that was a 75 mL 0.1 M NaOH trap for CO2. This would collect any organically bound 14C that was combusted.
Ultima Gold (16 mL) was added to 4 mL aliquots from the NaOH trap and measured in triplicate for 12 hours. However, due to insufficient metrics to quantify the efficiency of collection and detection, preliminary results for this analyte were deemed inconclusive.
Figure 14: Schematic for sample combustion and analyte collection. Arrows indicate direction of airflow. Calculation of tritium activity required a background tritium activity level, ambient moisture content, and extraction efficiency. A background tritium activity and moisture content was established by
executing the sample protocol in the absence of a sample. Although the purpose of the first sulfuric acid trap is to desiccate the incoming air, 0.13 mL moisture was still collected in the cold trap. A 1 mL tritium standard (Eckert & Ziegler Analytics, 86114-154; 9.308×10³ Bq in 500 mL, reference date December 5,
2011) was then pipetted into a plastic LSC vial with 18 mL cocktail and measured for 30 minutes. The background and standard samples were used to maximize the figure of merit (FOM) and optimize the ROI using Eq. (2.1): 1n = − × 100 (2.1)
where and refer to the counts per minute for the standard and background, respectively, and refers to the decay-corrected activity of the standard in decays per minute. The ROI that maximized the FOM was between channels 34 and 202. The average intrinsic efficiency was calculated to be approximately 46%.
Extraction efficiency and absolute efficiency were evaluated twice using approximately 1 mL tritium standard pipetted into the flask with substrate; the flask was then subjected to the same temperatures and time durations as those of the soil and vegetation samples. The first trial was
conducted using 7.94 g soil from the Colorado State University campus spiked with 0.97 g of the tritium standard. The extraction efficiency was 68%, and the absolute efficiency was 31%. The second trial was conducted using 7.12 g sand, 2.47 g dH2O, and 0.99 g of the tritium standard. The extraction efficiency of
this trial was 60%, and the absolute efficiency was 28%. The average extraction and absolute efficiencies were 64% and 29%, respectively.
Results and Discussion
Two noticeable trends in the tritium data are displayed in Figure 15. The top 2.5 cm of soil consistently had higher tritium activities per unit volume of water extracted than those of the bottom 2.5 cm of soil. Further investigation is required to ascertain why there is inhomogeneity in distribution within
the soil column. Similarly, vegetation samples tended to have lower activity concentrations than the top