FACULTY OF ENGINEERING AND SUSTAINABLE DEVELOPMENT
Department of Building, Energy and Environmental EngineeringInvestigation of energy retrofits of a multi-family building
By using IDA Simulation Software
Basem Ahmed
2014
Student thesis, Master degree (two years), 30 HE Energy Systems
Master Programme in Energy Systems
Supervisor: Mathias Cehlin Examiner: Taghi Karimipanah
ii
Preface
This work was implanted as master research project in energy systems at University of Gävle. I would like to express my sincere gratitude to my supervisor Mathias Cehlin for his support and guidance throughout this research and without his patience and
invaluable inputs, this project would not have been possible. I would like to thank Dr. Huijuan Chen and Ali Joudi (PhD student in University of Dalarna) to their help and discussions during the work which enabled me to go further and solve many important problems.
Much appreciation to Julia Öhman Persson and Johanna Öhman (employees in Fastighets AB Seglet Company, which owns the building of this work, for what they have done to giving help and trying to find the necessary drawings of the building. I would like to present this scientific work first to Iraq (my original country) with my prayers and best wishes and to recover and survive from the difficult circumstances and living in peace and freedom and progress; and second to the Kingdom of Sweden which has given me and my family unbelievable life with safety and peace.
With all love and appreciation I am pleased to dedicate this paper to my father and mother, who are the main cause of my life and I’ll never forget their great sacrifice for me.
Special thanks for my lovely wife for her great withstanding and patience throughout completion of this research. I wish to dedicate this work as a gift to my sons Hussein and Amir to encourage them to go further in their studies.
iii
Abstract
Energy simulation in building sector was an important issue which can eliminate energy use and improve energy efficiency. The building, which is located at Ringvägen 18 in Ljusdal
community in Sweden, was chosen to be the main mission of this research and it was one of eleven objects which were involved in EKG project.
The first step in this work was to create the model according to available drawings and given data and then to simulate the energy inside the model by using IDA ICE software. There were three goals in this work; the first was to get heating value of 117MWh which was obtained by EKG project. The second goal was to renovate the model to reduce energy use and energy demand and to increase energy savings. Third goal was through prefabrication part which tried to improve reducing of energy use and energy demand. In LCC part, fourth goal was to find best renovations which could lead to good investments and long life cycle.
The building was located in Ljusdal community in Sweden and consisted of 4 floors. There were two floors in every floor but just one in the first. Delsbo climate file was chosen instead of Ljusdal file because of availability and the short distance between the two towns. Next step was to feed different given data to the model like climate file, Building defaults (which contained external walls, internal walls, internal floor, roof, external floor, glazing and door construction), site shading and orientation, Thermal bridges, ground properties, infiltration, DHW, system losses, plant, AHU, occupation and equipment.
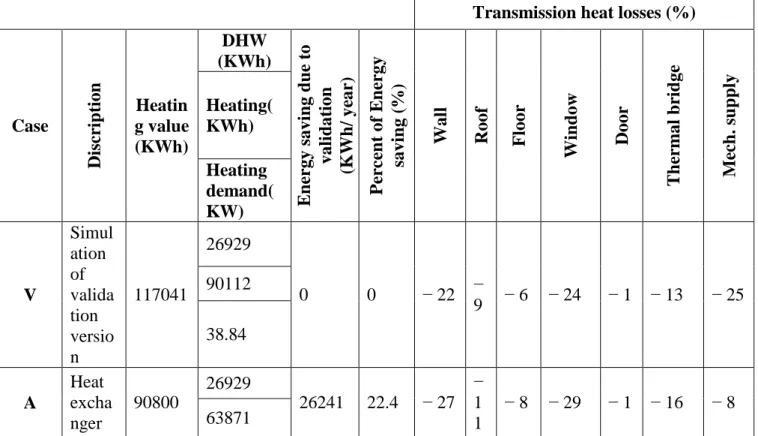
In simulation of validation, the obtained heating value was 117041 KWh and it was decided to be as validation value because it was the closest to EKG project and the heating demand was 38.84KW.
The renovations included many types of changes which were done on the model in order to improve energy use and energy demand such like add insulation layer with different thicknesses to the external walls and roof, change indoor air temperature, change effectiveness of heat exchanger and change the windows to another type with less U- value. The main stage of renovation, which related to simulation of validation, reduced heating value to 48232KWh with saving of 68809 KWh which was 58.7% of the main value before renovation and it reduced heating demand to 17.39 KW with saving of 21.45 KW which was 55.2% of value before renovation.
The prefabrication could give good suggestion to improve energy use and energy demand. There were 4 cases of prefabrications which included many changes on the model such like building up a new floor, adding insulation layer with different thicknesses to the roof and external walls, deleting the balconies and shadings to reduce thermal bridges losses, reducing U-value of windows by changing them to another type with lower U-U-value and changing indoor air temperature. Through these four stages of prefabrication, the heating value was reduced from 117041 KWh to 34622KWh with saving of 82419 KWh which was 70.4% of value before prefabrication and heating demand was reduced from38.84 KW to13.28 KW with saving of 25.56 KW which was 65.8% of value before prefabrication.
The LCC part was important because it gave clear vision and judgment about the economic and investment issue. The acceptability of the investment decision was decided by 198 answers which were responsible to judge if the investments were good or not. There were 22 types of different renovation and every type included 9 cases which depended on interesting rate and energy price factors. The result was 198 answers which were divided to 100 answers as “YES” for good investment and 98 answers as “NO” for good investment.
iv
Abbreviations and symbols
ZEB ... Zero Energy Building FEB ... YEnergy Efficient Buildings GHG ... Green Houses Gases
ESCO ... Energy Service Companies DR ... Demand Response
HAVC ... Heating, Ventilation and Air Conditioning SMBs ... Small and Medium-Sized Business
CSPs ... Curtailment Service Provides LCC ... Life Cycle Cost
BES ... Building Energy Simulation NMF ... Natural Model Format
SMHI ... Swedish Metrological and Hydrological Institute SHGC ... Solar Heat Gain Coefficient
DHW ... Domestic Hot Water AHU ... Air Handling Unit DH ... District Heating
EPBD ... European Energy Performance of Buildings Directive.
BREEAM ... Building Research Establishment Environmental Assessment Method LEED ... Leadership in Energy and Environmental Design.
v
Table of Contents
Page
Abbreviations and symbols ... iv
List of Tables ... viii
List of Figures ... ix
List of Appendices ... xi
1. Introduction ... 1
1.1 Energy use ... 1
1.2 Types of energy sections ... 5
1.2.1 Energy in transportation ... 5
1.2.2 Energy in industry ... 6
1.2.3 Energy in buildings and services ... 7
1.3 Renovation ... 9
1.4 Prefabrication... 11
1.5 Definitions of Life Cycle Cost (LCC) ... 11
1.6 Aim ... 13
2. Building Energy Simulation (BES) ... 14
2.1 What is building energy simulation? ... 14
2.2 Types of energy simulation software... 15
2.3 What is IDA ICE? ... 16
3. Method ... 16
3.1 The model general description ... 16
3.2 Model data ... 18
3.3 Validation ... 19
3.3.1 Location ... 19
3.3.2 Climate file ... 20
3.3.3 Model defaults ... 21
3.3.4 Site shading and orientation ... 21
3.3.5 Thermal bridges ... 23
3.3.6 Ground properties ... 24
3.3.7 Infiltration ... 24
3.3.8 Extra energy and losses ... 24
3.3.9 Plant ... 25
3.3.10 Air Handling Unit (AHU) ... 25
3.3.11 Loss factor of thermal bridges ... 26
3.3.12 Occupation ... 26
3.3.13 Equipment ... 27
3.4 Renovation ... 28
3.5 Prefabrication... 29
3.6 Life Cycle Cost (LCC) ... 30
3.6.1 Price list ... 30
3.6.2 Net model surface area ... 31
3.6.3 LCC sheet file ... 32
4. Results... 35
vi 4.1.1 Simulation of validation ... 35 4.2 Renovations ... 40 4.2.1 Main stage ... 40 4.3 Prefabrication... 44 4.3.1 Case 1 ... 44 4.3.2 Case 2 ... 48 4.3.3 Case 3 ... 52 4.3.4 Case 4 ... 55
4.3.5 Summary of prefabrication cases ... 60
4.4 Life Cycle Cost (LCC) ... 60
5. Discussion ... 62
6. Conclusion ... 66
7. References ... 67
viii
List of Tables-1
Page
Table 1 Monitored and required total specific final energy use
in different projects ... 4
Table 2 Heights of building floor ... 19
Table 3 Winter and summer design days ... 20
Table 4 Types and values of thermal bridges ... 24
Table5 Domestic hot water consumption ... 25
Table6 Monthly and annual electricity energy use ... 28
Table7 Thermal bridges values of prefabrication-Case1 ... 29
Table8 Parameters and cases of LCC ... 33
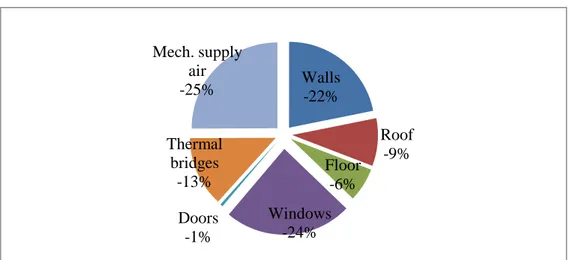
Table9 Thermal bridges values - simulation of validation ... 36
Table10 Delivered energy overview − simulation of validation ... 36
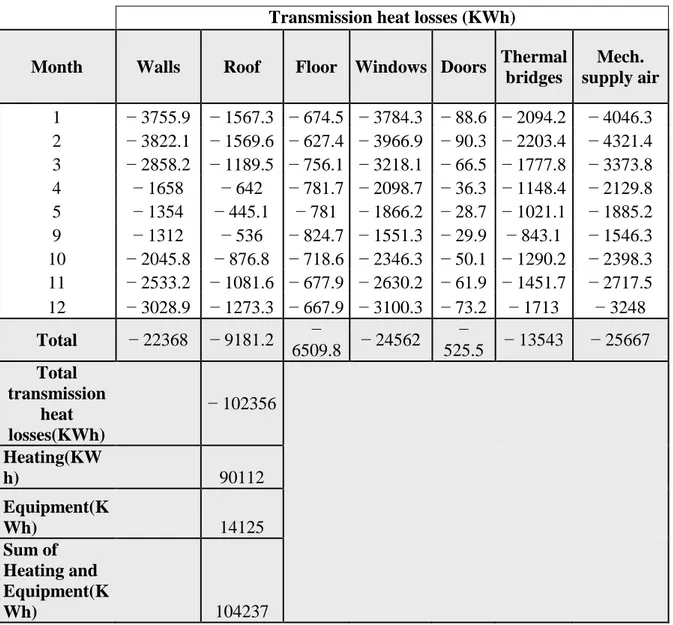
Table11 Transmission losses, Heating, and equipment overview− simulation of validation ... 37
Table12 Cases summary of renovation ... 40
Table13 Thermal bridges values of prefabrication- Case 1 ... 44
Table14 Delivered energy overview of prefabrication − Case 1 ... 45
Table15 Transmission heat losses, heating, and equipment− Case 1 ... 46
Table16 Delivered energy overview of prefabrication-Case 2 ... 49
Table17 Transmission heat losses, heating, and equipment− Case 2 ... 50
Table18 Delivered energy overview of prefabrication− Case 3 ... 53
Table19 Transmission losses, heating, and equipment of prefabrication− Case 3 ... 53
Table20 Delivered energy overview of prefabrication− Case 4 ... 56
Table21 Transmission heat losses, heating, and equipment− Case 4 ... 57
Table22 Prefabrication cases summary of transmission losses, heating and equipment ... 57
Table23 Summary of prefabrication cases... 60
ix
List of Figures
Page
Figure1 Sweden's total energy excluding net electricity exports, 1973− 2029,in TWh (Swedish Energy Agency. 2011a) ... 2
Figure2 Swedish industry's energy end-use in TWh/year per sector between 1970 and 2010 ... 3
Figure3 Rough division of total energy use in single houses over time ... 5
Figure4 Global energy consumption in different sectors ... 8
Figure5 Ringvägen 18 building in Ljusdal city... 14
Figure6 North façade... 17
Figure7 East façade ... 17
Figure8 South façade... 17
Figure9 West façade ... 18
Figure10 Shading on south direction ... 22
Figure11 Shading on west direction ... 22
Figure12 Shading on east direction ... 22
Figure13 Shading on east and south direction ... 23
Figure14 Shading on north direction... 23
Figure15 Distribution of transmission heat losses− simulation of validation ... 38
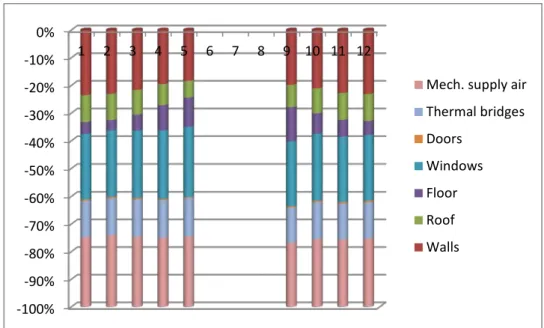
Figure16 Monthly share of transmission heat losses − simulation of validation ... 38
Figure17 Detailed distributions of transmission heat losses in each month – simulation of validation ... 39
Figure18 Delivered energy− simulation of validation ... 39
Figure19 Transmission heat losses of prefabrication− Case 1 ... 47
Figure20 Delivered energy of prefabrication− Case 1 ... 47
Figure21 Monthly share of transmission heat losses of prefabrication− Case 1 ... 48
Figure22 Detailed distributions of transmission losses of prefabrication− Case 1 ... 48
Figure23 Transmission heat losses of prefabrication− Case 2 ... 51
Figure24 Delivered energy of prefabrication- Case 2 ... 51
Figure25 Monthly share of transmission heat losses− Case 2 ... 52
Figure26 Detailed distributions of transmission heat losses in each month- Case 2... 52
x
Figure28 Delivered energy of prefabrication- Case 3 ... 54
Figure29 Monthly share of transmission heat losses of prefabrication – Case 3... 55
Figure30 Detailed distributions of transmission heat losses in each month− Case 3 ... 55
Figure31 Transmission heat losses of prefabrication− Case 4 ... 58
Figure32 Delivered energy of prefabrication- Case 4 ... 58
Figure33 Monthly share of transmission heat losses− Case 4 ... 59
Figure34 Detailed distributions of transmission heat losses in each month− Case 4 ... 59
xi
List of Appendices
Page
App.1 Building north facade drawing ... 70
App.2 Building west and east facade drawing ... 70
App.3 Building south facade drawing ... 71
App.4 First floor drawing ... 72
App.5 Second and third floor drawing ... 73
App.6 Fourth floor drawing ... 74
App.7 Dimensions and floor areas of first floor zones ... 75
App.8 Dimensions and floor areas of second floor zones ... 76
App.9 Dimensions and floor areas of third floor zones ... 77
App.10 Dimensions and floor areas of four floor zones... 78
App.11 Working hours and air temperature of climate file ... 79
App.12 Working hours and relative humidity of climate file... 79
App.13 Working hours and wind direction of climate file ... 80
App.14 Working hours and wind speed of climate file ... 80
App.15 Working hours and direct, diffuse solar radiation of climate file ... 81
App.16 Zones loss factor for thermal bridges, supply and return air ... 82
App.17 Numbering, number of persons, and number of rooms- in each apartment ... 83
App.18 Emitted heat from equipments in the zones ... 84
App.19 Price list ... 85
App.20 Monthly delivered energy - simulation of validation ... 86
App.21 Used energy - simulation of validation ... 86
App.22 Delivered energy overview of renovation − Case A ... 86
App.23 Delivered energy of renovation – Case A... 87
App.24 Delivered energy overview of renovation − Case B ... 87
App.25 Delivered energy of renovation − Case B... 88
App.26 Delivered energy overview of renovation − Case C ... 88
App.27 Delivered energy of renovation − Case C... 89
App.28 Delivered energy overview of renovation − Case D ... 89
App.29 Delivered energy of renovation − Case D ... 90
xii
App.31 Delivered energy of renovation − Case E ... 91
App.32 Delivered energy overview of renovation − Case F ... 91
App.33 Delivered energy of renovation − Case F ... 92
App.34 Delivered energy overview of renovation − Case G ... 92
App.35 Delivered energy of renovation − Case G ... 93
App.36 Delivered energy overview of renovation − Case H ... 93
App.37 Delivered energy of renovation − Case H ... 94
App.38 Delivered energy overview of renovation − Case I ... 94
App.39 Delivered energy of renovation − Case I ... 95
App.40 Delivered energy overview of renovation − Case J ... 95
App.41 Delivered energy of renovation − Case J ... 96
App.42 Delivered energy overview of renovation − Case K ... 96
App.43 Delivered energy of renovation − Case K ... 97
App.44 Monthly delivered energy of prefabrication− Case 1 ... 97
App.45 Used energy of prefabrication− Case 1 ... 97
App.46 Monthly delivered energy of prefabrication− Case 2 ... 98
App.47 Used energy of prefabrication− Case 2 ... 98
App.48 Monthly delivered energy of prefabrication− Case 3 ... 98
App.49 Used energy of prefabrication− Case 3 ... 99
App.50 Monthly delivered energy of prefabrication− Case 4 ... 99
App.51 Used energy of prefabrication− Case 4 ... 99
App.52 Summary of LCC renovations ... 100
App.53 Thermal Insulation Effect of corner ... 129
App.54 Air leaks at window ... 130
App.55 Thermal Insulation Effect corner / mortar in the wall ... 130
App.56 Thermal Bridge in façade-1 ... 130
App.57 Thermal Bridge in façade-2 ... 131
1
1. Introduction
1.1 Energy use
Energy use in the built environment is a large part of total energy use in Sweden which can be represented as more than third of total energy use and greenhouse gas emissions. Energy use in built environment is an important section in which energy conservation can be improved to get the national implementation of the Europeans aims. Because of our more and more existence at homes, then thermal comfort and indoor air quality can be considered as important issues.
The energy use was decided to be reduced by 20% in the building sector by 2020 and 50% by 2050 which was the statement of Swedish national goals which could be done in condition that energy had to be efficient in new buildings with existence of high resilience. Zero energy buildings (ZEB) would be started in 2019 for official buildings and for all buildings in 2021 according which was pointed by EU directives. The first passive houses in Sweden were finished outside of Gothenburg city, in the Lindås area.
According to voluntary, standard and passive houses were specified and a certificate from the Forum for Energy Efficient Buildings (FEBY) could be applied. Space heating could be accomplished by using the hygienic ventilation flow when transmission and ventilation losses were so small, which was the main dependent concept of certification [1].
The rising of rapidly growing of energy use was concerning to heavy environmental impacts like ozone layer depletion, climate change, global warming, exhaustion energy resources and supply difficulties. The contribution of buildings in energy use, in both kinds residential and commercial, had an increase with a range between 20% and 40% in developed countries which had exceeding in major sections of industry and
transportation.
Energy demand will continue in the future according to many factors such as growth in population, increasing demand for building services and comfort and the rise of spent time inside buildings. This gives the reason of why energy efficiency in buildings is the main goal of energy policy at different levels; regional, national and international [2].
2 Swedish energy policy aims to reduce the amount of used electricity for heating in building sector. It is possible to reduce primary energy use for heating with 47% and to reduce heat demand with34% together with reduction in CO2 emissions. According to
proposed introduction of performance certification of buildings in Sweden (and in EU), the primary energy use and local conditions should be taken into consideration by the certification system. The acceptable way to do so will be to develop best strategies of the heating market for different houses types and districts within municipality which could be included as recommendations in the energy performance certification of the buildings [3].
The Swedish total energy excluding net electricity exports between 1973 and 2029 in TWh is shown in Fig.1. Swedish industry's energy end-use in TWh/year per sector between 1970 and 2010 is shown in Fig.2.
Fig.1 Sweden's total energy excluding net electricity exports, 1973− 2029, in TWh (Swedish Energy Agency. 2011a).1
1
3 Fig.2 Swedish industry's energy end-use in TWh/year per sector
from1970 - 2010 (SEA, 2011) (see ref. 9).
Cutting down emissions of greenhouse gases is best way to reduce global warming but the world economy is addict to energy which was produced from fossil carbon fuels. It was hard to stop using fossil fuels quickly due to economic growth and increasing world population which needs more and more energy. It will be long, expensive and difficult to replace this addiction with energy efficiency and dioxide- free renewable energies meanwhile global warming could be alleviated by other methods during developing of effective solutions [4].
Majority of Swedish home owners prefer to reduce their household energy use and the no- cost measures are a way to investment measures. Homeowners, preference for a particular type of energy efficiency measure influences by many personal attributes like income, education, age and house age, thermal comfort, past investment and perceived energy cost. In comparison, persons with high energy cost like to adopt an investment measure more than those with low energy cost. The energy price increase might encourage homeowners to look after measures in order to reduce energy use [5].
In the late 1980s and 1990s the development of higher energy efficiency in Swedish building sector was stagnated. The average specific energy use in the new buildings was twice as high as best of performed buildings for 20 year ago. In the stock of buildings, there was big relation between specific energy use for heating (KWh/m2/yr) and increasing of energy prices and there was no change in price elasticity over time. On the contrary, the relation between energy prices and specific energy use in the new buildings was very weak. The information about life cycle cost (LCC) of different
4 investment alternatives was important reason of low sensitivity to price changes. The most common investment criterion is instead the requirements of the national building energy standard which has developed into a norm rather than a minimum for energy performance [6].
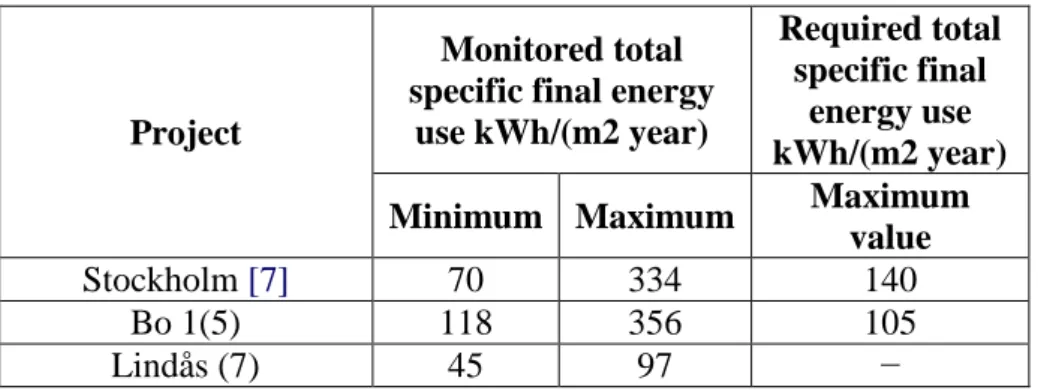
Among the buildings in each project, large variation in specific energy use were noticed (see Table 1), where the buildings were with same energy systems and thermal
properties.
Table 1 Monitored and required total specific final energy use in different projects.
Project
Monitored total specific final energy
use kWh/(m2 year)
Required total specific final
energy use kWh/(m2 year)
Minimum Maximum Maximum
value
Stockholm [7] 70 334 140
Bo 1(5) 118 356 105
Lindås (7) 45 97 −
The Swedish goals for the building sections are through reduction of total energy use by 20% in 2020 and by 50% in 2050 (with comparing to the use in 1995). The
dependency of fossil oil should be disappeared meanwhile the share of renewable energy use should take place instead in the section. Reaching goals through energy use reduction is a contribution to reduce the negative influence on the climate.
In Sweden, the energy demand in single− family houses is divided into 60% for heating including ventilation and 20% for hot water production and the rest for household electricity. Increasing of insulation and better air tightness of the building envelope in comparing to older houses causes a lower heat demand in the newly built houses. The decreased energy demand is affected by heat recovery increasing and system efficiencies. Moreover, water saving armatures and installed energy efficient white goods might be fitted to decrease the usage of hot water and the household electricity respectively. Fig. 3 shows the development of heat demand of the next generation of houses.
5 Fig.3 Rough division of total energy use in single− family houses over time
(See ref. 7)
The residents of a building impacted to a great deal the hot water usage, household electricity and energy for heating to some degree through choice of window airing customs and indoor temperature. Regarding to development in Fig. 3, the resident’s impact would become important in the newer and more efficient energy in houses [7].
1.2 Types of energy sections
Final energy use consists of three main sections which are; buildings and services, transportation and industry. Electricity, gas, and heating from retail companies were bought by end users. The smarter and more efficient way of using energy, which required no major investment, could reduce energy costs of both households and businesses.
1.2.1 Energy in transportation
Transport section is one of the most difficult problems when decreasing of greenhouse gas emissions is discussed. Moreover many problems which concern security of supply can be faced in transport section. Strategies of demand – side include measures for decreasing of transport demand and also various technical and non- technical ways of improving vehicle fuel economy. Fuels base on renewable electricity should cover more than half of the road transport sectors energy demand. Transport nowadays contributes with 26% of total energy use and with 23% of world’s energy which concern greenhouse gas emissions.
The share of transport energy from fossil resources is 95% which shows that transport section depends largely on fossil fuel and oil is in first grade. Emissions of Carbon dioxide (CO2) in Sweden, which originating from transport, has share of 40%
6 of the total carbon dioxide emissions in the country. The main reason of high share of CO2 is because energy used in stationary sector in Sweden to a large extent is
renewable. The main originating source of Swedish electricity is from hydropower and nuclear power and a large share of this electricity is used by heating sector as well as biomass and waste.
Fossil fuels dominates transport sector with increasing of CO2 emissions from transport which related to actual emissions and as a share of total Swedish emissions. Most renewable fuels are more expensive and energy – intensive to distribute and produce than conventional fuels which depend on fossil energy resources and this is the major problem for transport sector. Massive political support is condition to the
necessary change such as subsidies and tax reductions; need to be made with great care so that the alternatives are better than the status quo [8].
1.2.2 Energy in industry
Higher energy end-use prices for Swedish industry is caused by deregulation of the European electricity market and rising fuel prices on the international energy markets. The risk of negative effect of Swedish companies is created by rapid energy price increase. This lead to electricity prices as Swedish industry has had the lowest electricity prices in Europe and therefore to a greater extent than their European competitors chose to use electricity between energy carriers and fuels. In the past decade, the Swedish electricity prices on the Nordic spot market raised by 300%. In order to reduce the negative impact of higher energy prices, two possibilities are followed by industrial organizations; the first is to negotiate a lower price of energy from supplier and the second is to work internally on energy use with many possible areas like energy efficiency, load management, utilization of excess heat, conversion of electricity to other energy carriers and moreover internal production of electricity and heat.
To start acting powerfully towards a more efficient supply and energy use, there are many strong incentives for both Swedish government and Swedish industry. The assessment of implications for Swedish industry in terms of needs for improved energy efficiency is a way to work proactively to reach the EU 2020 primary energy target for the industrial section. The two ways to evaluate policy instruments are; ex-ante which
7 means that the policy evaluation is before end of the period and ex-post which means the policy evaluating is after the program [9].
1.2.3 Energy in buildings and services
The European Union (EU) and Sweden consider that rapidly growing energy use is a serious problem. To reach national energy goals for reduced energy use and CO2
emissions in the future, energy demand reduce in the building section is important issue for Sweden. A number of national environmental goals which include reducing of energy use and greenhouse gases emissions are adopted by Sweden. One of these goals is to reduce the total energy use per unit floor area in residential and commercial buildings, by 20% by 2020 and 50% by 2050 in relation to energy use in 1995, by creating a good indoor environment. Almost 39% of the energy used by the demand side in Sweden is used in the building section, according to Swedish Energy Agency.
According to” Million Program” the construction rate of dwellings was highest between 1965 and 1974. In order to meet the population increase, about one million dwellings in a form of single family houses and apartments in multi- family buildings were produced. To meet the national goals, the old stock needed to be retrofitted which would represent a substantial part of the future building population. The opportunity of energy performance improvement during renovation should be considered seriously since older buildings undergo main renovation every 30 to 40 years. The necessity and extent of renovation has an important role to show if reducing of energy use in Sweden is successful or not but on other side the size of the building stock will increase. Now there are about 165000 multi- family buildings out of a total of 2.1 million buildings [10].
Changes in energy demand in multi-apartment buildings may affect cost-optimal options of heat supply. Power production and district heat based on combined heat has proved to be cost-and primary energy- efficient option for purposes of heating in the residential sectors. Local heat supply options may be more cost-efficient than district heat supply options in case of low heat demand. Both initial investment costs of heating system and fuel costs have significant role for cost efficiency of the different supply options. District heat is not always cost efficient for multi- apartment buildings
8 between heating cost and primary energy use in supplying heat to multi- apartment building [11].
Energy use reduction is an important measure for climate change mitigation. The world’s primary energy use consists of 40% of buildings and 24% of the greenhouse gas emissions (International Energy Agency (IEA), 2011). In worldwide there is increase in population and need for residential and non-residential buildings. Therefore, the
reduction of energy consumption and energy use increase are important measures which required for reducing energy dependency and greenhouse gas emissions.
The concept, of net zero energy buildings, is considered as the concept that can be reached in the future. The growing number of projects in the world shows that Net ZEB balance can be reached with technologies available nowadays in the market [12].
Globally, more than 60% of residential buildings and 50% of commercial buildings have thermal uses demand with more contribution from water heating in residential buildings and from cooling in commercial buildings. According to this, global total building energy use has a share of 32- 33% as space heating. Heating and cooling importance in total building energy use varies between 18% and 73%. Fig. shows global energy consumption with different sectors.
Fig 4 Global energy consumption with different sectors2
According to global state, Biomass dominates fuel and covers most energy needs of the poor in least the developed countries. Electricity role grows substantially, presently
2
http://dailychode.blogspot.se/ The daily Chode
Creating Satisfaction: Part 3/Transportation Friday, May 27, 2011
9 accounting for more half of commercial building energy use. Fuels in developed
countries are 12 -43% of building energy needs. The direct use of coal has disappeared from the section and replaced by electricity and natural gas in the most developed regions [13].
Because of variety of uses and energy services, the energy consumption in non- domestic building is considered as complex issue and therefore there is a need to understand the energy demand of individual buildings. The rapid increase in energy consumption and CO2emissions in the built environment causes to make savings
strategies and energy efficiency has a priority in energy politics in most countries. A high demand is placed on building professionals by the European Energy
Performance of Buildings Directive (EPBD) to produce buildings to near –zero energy
use levels. University buildings, commercial buildings and primarily office are buildings of the highest energy consumption. Many governmental energy initiatives have focused on commercial building sector to achieve more sustainable development.
Although there is increasing in advanced technologies to achieve the required reduction in energy consumption goals but this will not lead to overall reduction. The discrepancies between actual and predicted building energy performances were with averaging 30 % and 100% in some cases.
The actual consumption was twice as much as predicted and that was found through investigated studies of performance of 23 non- domestic buildings. The demands of measured electricity are possible to be nearly 60–70% higher than predicted in both schools and general offices, and over 85% higher than predicted in university campuses [14].
1.3 Renovation
Obtaining sustainable renovation in large housing cooperatives is a big challenge. It is voted by two of third at the general meeting is required. The process may be delayed by a lack of engagement and in often the residents keep staying passive until they realize there is fees increase if the plans carried out.The fear of residents is an obstacle during the process although the investments are well economically. The residents will oppose the renovation even with their involving.
10 Necessary renovations increase the risk of degradation of building and it is important to map factors which increase housing cooperatives chances by an agreement on
sustainable and energy efficient renovations. For a period of two years, three pilot studies looking at decision processes for sustainable upgrading are followed. The primary results illustrate that the openness in the process initial stages is crucial. The consequences and results visualizing can be effective means to get a dialogue with residents who are more interested in the aesthetic parameters. Residents can be made more aware of their energy use by visualization of AMS (Advanced Monitoring Systems). The indoor climate, after renovation, may be more easily affected by building use [15].
Renovation of single-family houses will lead to huge potential for reducing energy consumption. Chain collaboration is very important for development of successful market of highly energy- efficient integrated renovation while demand of customer for integrated renovation should be stimulated. The developing of research and networking methodology is through One Stop Shop project to identify and develop opportunities of collaboration for advanced housing renovation in Belgium, Denmark, Finland and Norway.
Business model generation between different players on the renovation market, methods for collaboration and ideas are developed by the project. Different results of research contribute to defining new business opportunities related to process innovation to an unburden homeowner and to achieve renovation processes which are less
fragmented.
The design of follow- up activities such as the international research project ”One Stop Shop” provides better understanding of how the market development for advanced housing renovation is derived. Higher energy performances are today the focus of new/ build housing market. On the other side a market niche is growing for highly energy- efficient new-built houses – such as passive houses – improving the existing building stock is proving more difficult.
For renovations and in order to keep competitive with new- build houses in the future, the awareness grows which make renovation work will need to implement single energy –saving measures and towards integrating of energy renovations. Huge potential is spent to reduce energy consumption in the existing building stock especially with
11 high energy efficiency in integrated renovation but this issue is still in most countries being dealt with demonstration project level [16].
1.4 Prefabrication
The emissions of greenhouse gas (GHG) in the construction stage will be significant during the time. GHG emissions in the construction phase can be affected by different construction methods. There are five emission sources for the semi- prefabricated construction process such as embodied emissions of building materials, construction techniques, operation of equipment a and transportation of prefabricated components. For the purpose of preliminary examination of the differences in GHG emissions, a semi- prefabrication project and a conventional construction project in China are employed.
The production of GHG emissions per square meter in the semi- prefabrication method is less than the conventional construction and their amount are 336 kg/m2 and 368 kg/m2 respectively.
The embodied emissions of building materials release the largest proportion of total GHG emissions with about 85%. There are four elements which contribute positively the reduction of emissions like transportation of waste and soil, transportation of building materials, embodied GHG emissions of building materials and at last resource consumption of equipment and techniques with accountings 0,2%, 18.3%, 86.5% and 10.3%, respectively, of reduced emissions. The transportation of prefabricated
components is the element which has negative effect on reduced emissions with 15.3% of the total emissions reduction. Thus, the contribution of significant environmental benefits on GHG emissions can be reached by adopting of prefabricated construction methods [17].
1.5 Definitions of Life Cycle Cost (LCC)
The definition of life cycle cost (LCC) in the Association of Cost Engineers (AcostE) and the American Association of Cost Engineering (AACE) handbooks is ”the whole life cost of the asset including capital expenditure, ongoing maintenance, future repair and/ or renewal and eventual disposal”. In another cost engineering handbook by Humphreys, the definition of LCC is initial investment costs (less resale value),
12 replacements, operation (including energy use), and maintenance and repair of an
investment decision (expressed in present or annual value terms”.
LCC is defined in Systems Engineering (SE) handbook as” the total cost to the organization of acquisition and ownership of a system over its entire life. It includes all costs associated with the system and its use in the concept, development, production, utilization, support and retirement stages”.
In NATO code of practice of life cycle analysis for military systems, LCC is defined as sum of direct cost (i.e. all costs that can be allocated to a system / product) and indirect variable costs( i.e. costs that can be associated to several systems/products and is fluctuating with characteristics of the system (product it refers to)[18].
LCC included knowledge of following input:
a) Additional cost of investment (Swedish Crown). b) Measure energy savings (KWh).
c) Energy price (Swedish Crown/ KWh). d) Energy price increase (%).
e) Measurement of expected useful life (years).
f) Cost of capital was the required return which could have on investment
(%).
g) Cost of reduced rental income (thicker wall insulation). h) The savings due to less heating systems.
i) Product/ service life of components.
LCC is a worthy financial approach for different building designs to be compared and evaluated in terms of initial cost increases against benefits of operational cost with a long-term perspective. To increase the possibility of cost reduction for operational phase, LCC analysis is applied by the key incentive. Decision makers will be able to obtain deeper understanding of costs during the life cycle for different design strategies through applying an LCC perspective in the early design phase. LCC can be defined also as a” a technique which enables comparative cost assessments to be made over a specified period of time, taking into account all relevant economic factors, both in terms of initial costs and future operational costs”[19].
13
1.6 Aim
It is necessary to set energy saving as major priority which must be in line with the efficient energy use to get positive effect to the environment such as reducing GHG emission. The burned fossil fuel can be reduced by using energy efficiently which mean a decrease in greenhouse gas emission.
The high growth of population and economic rates in Indonesia lead to fast growing of cities. With this growing of cities, energy demand becomes a crucial problem parallel with huge construction activity in Indonesia moreover the increase of electricity price which is set by the government is a result of world’s high price of energy. The
operational costs of a building are increased by reducing subsidy in the energy sector. One of solution to reduce energy consumption is by integrating the thermal building simulations during the design phase of a building as well as the renovation stage is presented [20].
The measures to reduce energy consumption in green buildings are both the embodied energy; which required to process, transport, install building materials and extract; and the operational energy or in another word the energy that consumed during the in- use phase of a building life to obtain necessary services like heating, cooling and providing power for equipment. Thermal aspects of energy consumption in the
operational stage can be reduced and by high efficiency windows and insulation in walls, ceilings, and floors which increase the efficiency of the building. Architects, who desire to design and build” green” buildings, should focus on reduce of use of
operational energy [21].
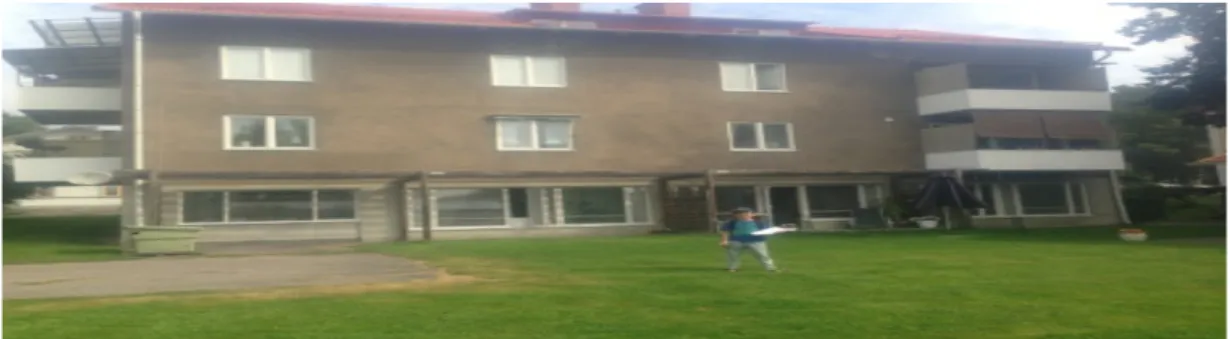
This study took cover a multi− family house which is situated in street Ringvägen 18 in Ljusdal city in Sweden (see Fig. 5). The main goal in this work was to create the model according to available drawings with all specifications and data and then to simulate the energy use in the model to reach the validation value which was reached by EKG3 project (Energikomptent Gävleborg).
3 EKG (Energikomptent Gävleborg) is a project implemented in 2012 by provincial government in
Gavleborg, University of Gävle and Energy Authority. The project aims to, among other things, show good examples of energy efficient building in the county that can inspire other players. The work is done in close collaboration with researchers at the University of Gavle.
http://www.lansstyrelsen.se/gavleborg/SiteCollectionDocuments/Sv/publikationer/2012/Energieffektivise ring_av_flerbostadsfastigheter_del2.pdf
14 The work tried to answer the questions which were related to energy use inside the building. Was it possible to reach validation value of heating value as it for EKG? What types of renovations which were suitable to get high reduction in energy use and low energy demand and at the same time, how much energy savings can be gained? Which possible prefabrications could be done? How much energy use could be reduced and how much energy could be saved after prefabrication? Which types of renovations were suitable to get good investments with long life cycle?
Fig. 5 Ringvägen 18 building in Ljusdal city
2. Building Energy Simulation (BES)
2.1 What is building energy simulation?
Thermal building simulation, as a powerful tool, is used to assess the energy
performance of a building. The recommendation is to integrate the simulation during the design phase of a building. During this process, it is possible to influence building design which can be changed because it is cheaper to change the design than the real building.
Scenarios with different numbers can be modeled to get the most optimum design, not just on the physical design but the operational scenario also. Nonetheless building thermal simulation has an important role in providing recommendation for renovation to achieve better performance concerning energy consumption. There are different cases of building thermal simulation; the first case is the role of simulation in designing the new building and the second role is for renovation project.
As results of the simulation, the parameters which give significant effect to the reduction of cooling energy demand consist of the implementation of glazing material
15 with high performance (low SHGC value and high light transmission value) for
envelope of building which has glass façade in majority, efficiency of HVAC, task lighting which is represented by lighting sensor, and indoor set point temperature [22].
2.2 Types of energy simulation software
The development of different means of predicting performance and rating
sustainability has affected the increased knowledge of building energy consumption and sustainability. The Building Research Establishment Environmental Assessment
Method (BREEAM) and Leadership in Energy and Environmental Design (LEED) are the most commonly used Performance Rating Systems. These systems use computer-based Building Performance Simulation tools (BPS).
Different studies have proved the predictive inconsistencies between BPS tools. Questions of ability to rate sustainability in a consistent manner are appeared with probability of achieving different ratings by using different BPS tools or rating systems. To inspect this, three of the most widely used BPS tools (TAS, Energy Plus and IES) are used to examine the extent of the variation in the results and evaluate the impact on overall BREEAM and LEED scores.
The different energy consumption figures gave different simulation tools but with less influence on BREEAM or LEED energy performance credit scores. Anyway and according to assessment procedures to decide the differences between BREEAM and LEED, it is found a considerably different rating level in each one[23].
There are examples for building thermal energy simulation programs which are more developed such as Energy Plus. Design Builder, BLAST. DOE− 2. Energy− 10,
16
2.3 What is IDA ICE?
In these days, simulation programs are used to predict and analyze HVAC systems and the performance of building. IDA ICE is a dynamic simulation tool which provides dynamic simulation of air flow and heat transfer through building up a mathematical model for the cooling and heating load to be calculated in the building and the thermal comfort and indoor air quality to be predicted based on building properties defined by user.
Royal Institute of Technology KTH and the Swedish Institute of Applied
Mathematics ITM have developed IDA ICE. The writing of first version of the model library was in neutral model format (NMF) within IEA Task 22. NMF is a program independent language which uses equations of differential algebraic for modelling and dynamic systems.
The modelling of mathematical library in IDA ICE 4 is with the equations from ISO 7730. The balance of supplied heat and heat losses is by using of dynamic time steps simulation, finite difference method and transient calculations. Heat losses depend on type of ventilation, speed and direction of wind, outdoor temperature, tightness and orientation of buildings, indoor temperature as well as thermal properties of building envelopes.
Supply heat depends on active and passive heating or in another word internal heat (released by people based on activity level, by lightening, and by equipment) and external (released by solar radiation through windows). Moreover the emission and storage of heat in the structure of the building, which is necessary for the power demand calculation, is calculated in IDA ICE 4 in accurate way. The risk of unexpected program crushes and error in creating the mathematical model during the simulation is the main drawback of using IDA ICE 4[24].
3. Method
3.1 The model general description
The building, which is situated in Ringvägen 18; Ljusdal community in Sweden, was one of 11 objects which were involved in EKG project. This multi− residential building was built in 1962 and owned by “Fastighets AB Seglet”. The latitude of the building is 61.83° N and its longitude is 16.08° E. The time zone was 1E h. The construction of the
17 building contained a body of masonry concrete, slabs of concrete. The way to gain hot water was by heating and the building was naturally ventilated.
According to the directions, the north facade of the building fits with earth north direction and the same for other facade of the building. The figures 6, 7, 8 and 9 show photos for north, east, south and west facade respectively of the building. The building consisted of 4 floors with 7 apartments with just one in the first floor and two in each of other floors. Appendices 1, 2, and 3 show building north, west and east and south facade drawings respectively.
Fig. 6 North facade
Fig. 7 East facade
18 Fig. 9 West facade
The total height of the building was 10.82 m. measured from the ground to the upper roof (exclusive attic), but when the fifth floor was built in prefabrication part, then the total high of the building became 13.525 m. According to 2D floor plan; the width of north and south facade, in x direction, was 17.44 m meanwhile the long of east and west facade, in y direction, was 12.6 m. The height to ceiling in each floor was 2.5 m and the insulation layer, which was above every ceiling, was with (0.205) m thickness. The first floor contained one apartment with four rooms and service part with rooms of bicycles, boilers, washing and laundry and drying. The second and the third floors were similar by containing two apartments with four rooms in each one meanwhile the fourth contained two apartments with two rooms in each one.
The main goal in this work was to build the model with all specifications and data and then to simulate the energy use in the model to reach the validation value which was reached by EKG project. The next step, in the renovation part, was to make changes on the model like adding a layer of light insulation with certain thickness to the roof and external walls, changing thermal bridges, reducing U− value of windows and reducing the indoor air temperature. These changes were used to get new value of energy use which hopefully had to be as more less as possible than validation value. The other step, in the prefabrication part, was to build a new upper floor (fifth floor) which aiming to reduce energy use and peak value of power demand more than before.
3.2 Model data
Measurements of building floors were taken from the drawings (see Appendices 4, 5 and 6) to build up 2− dimensional floors of the model and then it was possible to get 3− dimensional model. The first floor was divided to 21 zones (numbered from 1− 21). The second floor was built from height 2.705 m and divided to 20 (numbered from 22− 41).
19 The third floor was built from height 5.41 m and divided to 20 zones (numbered from 42− 61). The fourth floor was built from height 8.115 m and divided to 14 zones
(numbered from 62− 75).The fifth floor, in the prefabrication part, was built from height 10.82 m and divided to 14 zones (numbered from 76− 89). Appendices 7, 8, 9 and 10 show tables of zones number, name, X − Y dimensions and floor areas of the zones in each floor in the building. The total floor area of the building was. 767. 273 m2 and the total volume of the building was 1918.18 m3.
3.3 Validation
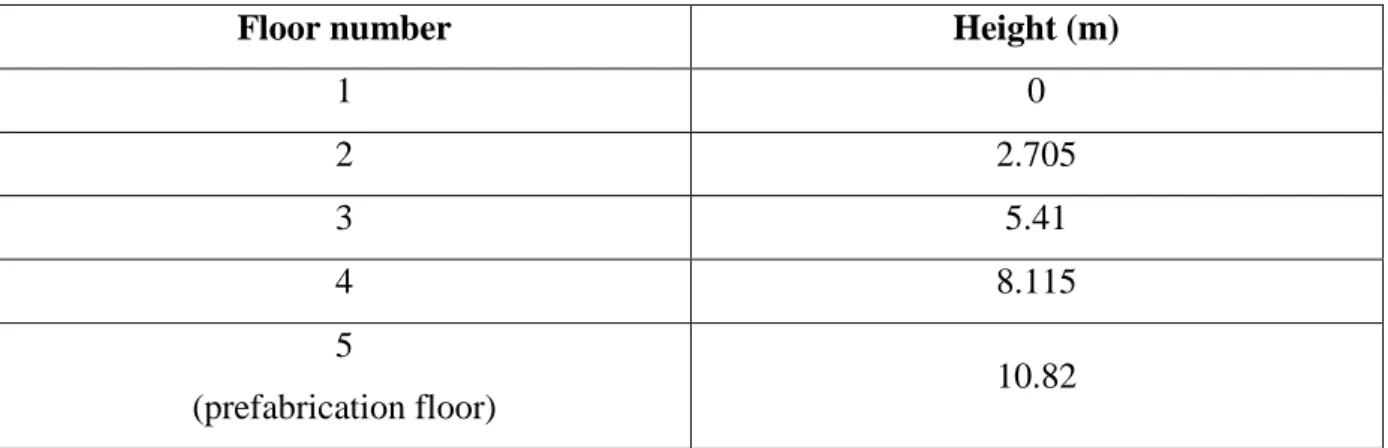
Through using IDA ICE software and after building the model4, the aim in this part was to reach EKG project results of total facility fuel (heating value) which was 117 MWh. It was quite suitable to feed the model, before simulation, with all the parameters which were considered as input data in different parts of the model which will be shown later in this report. The period of simulation was chosen as dynamic. Table 2 shows height of building floors which consists of 2.5 m high from flooring to ceiling and 0.205 m as thickness of ceiling.
Table 2 Height of building floors
Floor number Height (m)
1 0 2 2.705 3 5.41 4 8.115 5 (prefabrication floor) 10.82 3.3.1 Location
The location of the building was mentioned in building general description in part 3.1. Table 3 shows winter and summer design days for minimum and maximum dry− bulb temperatures, wet− bulb maximum temperature, wind direction, wind speed and clearance number. As keyword, Design Day input syntax defined a single day of
4
The method of building the model is described by” IDA 4: getting started” can be found by the link:
20 weather information. Design day simulations use was for sizing calculations or for peak load.
.Table 3 winter and summer design days (Fastighets AB Seglet)
Design days Winter Summer
Dry− bulb min (°C) − 10 17
Dry− bulb max(°C) − 5 25
Wet− bulb max(°C) − 5 18
Wind direction (degree) 180 90
Wind speed (m /s) 4 4
Clearance number (0− 1) 1.0 1.0
3.3.2 Climate file
Delsbo climate file, which was obtained from Swedish Meteorological and
hydrological Institute SMHI5, was chosen instead of Ljusdal climate file 2012 due to availability and because of short distance between Delsbo and Ljusdal6 which was no more than 25 Km. Columns of climate file should be arranged respectively as below:
a) First column included the working hours from the first hour in the first day of
the year which had number (0) in the first of January 2012. The arrangement of hours continued to the last hour in the year which had number 8759 in thirty first of December 2012.
b) Second column included values of air temperature (°C). c) Third column included relative humidity (%).
d) Fourth column included wind direction (°). e) Fifth column included wind speed (m/s).
f) Sixth column included direct solar radiation (W/m2).
g) Seventh column included diffuse solar radiation (W/m2).
The above columns should be without titles in the file. It was very important to save the climate file in elsewhere in computer in order to enable IDA to recognize and read the file. Appendices 11− 15 show the relationship between working hours during the year (8759 h) and other parameters of the file.
5
SMHI: Swedish meteorological and hydrological institute is a government agency in Sweden and operates under the Ministry of Environment.
http://en.wikipedia.org/wiki/Swedish_Meteorological_and_Hydrological_Institute
21
3.3.3 Model defaults
Each data was fed as default in order to feed all the zones with the same data at same time and there was no need to feed them one by one.
a. External walls
The external walls construction consisted of 0.15m concrete. 0.08 m light insulation and 0.12 m brick and the total thickness was 0.35 m. The U− value of the external walls was 0.3721 W/(m2K).
b. Internal walls
The internal walls construction consisted of 0.1 m light concrete and U− value was 1.195 W/ ( m2.K).
c. Internal floor
The internal floor construction consisted of 0.2 m concrete and 0.005m of floor coating so the total thickness was 0.205 m. The U− value was 3.17 W/ (m2
K).
d. Roof
The roof construction consisted of 0.2 m concrete and of 0.1 m light insulation and the total thickness was 0.3 m. The U− value of the roof was 0.3906 W/ (m2
.K).
e. External floor
This part consisted of 0.2 m concrete and 0.01m of floor coating and the total thickness was 0.21 m with U− value 2.914 W/ (m2
.K).The basement of the first floor should be connected to the ground. There was no insulation in the construction of basement in the first floor.
f. Glazing
Internal and external emissivity of the glass, which had range from 0− 1, was 0.66. With 3 pan glazing, the solar heat gain coefficient (SHGC) was 0.68, solar
transmittance was 0.6, visible transmittance was 0.74 and the U− value was 1.9 W/ (m2.K).
g. Door construction
It consisted of 0.035 m wood with U− value of 2.381 W/ (m2.K).
3.3.4 Site shading and orientation
The shadings, which could affect heating from solar energy on the building, were situated in just east and west direction meanwhile there were no shadings in the north and south directions (see fig. 10 and 14) which could affect solar energy on the
building. A multi− family building with about12 m high was in west direction (see fig. 11). A tree of about18m high was in east direction and had a big effect on the east but had less effect on south direction (see Fig 10 and 13) moreover a multi− family building
22 with about 12 m high was behind the tree. The figures 10, 11, 12, 13 and 14 show shadings on different directions of the building.
Fig.10 Shading on south direction
Fig.11 Shading on west direction
23 Fig.13 Shading on east and south
Fig.14 shading on north direction
3.3.5 Thermal bridges
In order to get the validation value of EKG project, thermal bridges were situated in a position with different values. Table 4 shows different types of thermal bridges and their values. The table was taken as a guide to the rest of work by naming the types of thermal bridges according to their numbers in the table.
24 Table 4 Types and values of thermal bridges
Number of thermal bridge Type of thermal bridge Value (W/K)
1 External wall/internal slab 0.116
2 External wall/internal wall 0.1048
3 External wall/external wall 0.1328
4 External windows perimeter 0.0432
5 External doors perimeter 0.0432
6 Roof/external walls 0.1824
7 External slab/external walls 0.2104
8 Balcony floor/external walls 0.464
9 External slab/internal walls 0.1048
10 Roof/internal walls 0.1048
3.3.6 Ground properties
The ground properties included four parameters as below:
Ground model was ISO− 13370.Ground layers under basement slab contained default soil with 1.0 m thickness and U− value of 1.493 W/ (m2
.K).Ground layers outside basement walls contained default ground insulation of 0.1 m and default soil of 1.0 m and the total thickness was 1.1 m. U− value was 0.29 W/ (m2.K).Ground temperature decided automatically when the climate file was loaded. The flooring in the first level was connected to the ground.
3.3.7 Infiltration
Wind driven flow was described as air tightness which is 0.2 L/ (s. m2) at pressure difference 50 Pa.
3.3.8 Extra energy and losses 3.3.8.1 Domestic hot water
The domestic hot water consumption (DHW) was calculated according to the equation:
12 m3/ apartment+ 18 m3 / Person ... (1) The apartments were different in (DHW) consumption according to occupation in each one. Table 5 shows calculations of annual (DHW) consumption in each apartment and total annual and daily consumption in the building.
25 Table 5 Domestic hot water consumption
Apartment
number Occupants Calculation
Annual consumption of DHW(m3) 1 1 12+ (18*1) 30 2 2 12+ (18*2) 48 3 3 12 +(18*3) 66 4 4 12 +(18*4) 84 5 2 12 +(18*2) 48 6 2 12 +(18*2) 48 7 1 12 +(18*1) 30
Total annual (DHW) consumption (m3/365 days) 354
Daily (DHW) consumption in the building(m3/day) 0.97
3.3.8.2 Distribution system losses
Distribution system losses included many parameters such as domestic hot water circuit of 0.5 W/( m2 floor area), heat to zones was 4% of delivered heat by plant, cold to zones of 0.5 W/( m2floor area), and supply air duct losses of 1W/(m2floor area). All parameters have typical position. 50% to zones7 and they are automatically calculated values by IDA.
3.3.9 Plant
The boiler operation was scheduled to be turned off in all daily hours during summer time, from 1 of June to the 31 of August, because there was no heating during this time. The chillier operation was scheduled to be turned off in all daily hours from the 1 of January to 31 of December because there was no need to cooling during the year.
3.3.10 Air Handling Unit (AHU)
The building was naturally ventilated and in another word there was neither heat exchanger nor heating coil nor cooling coil. The heat exchanger was with zero effectiveness, which its range was from 0− 1, and the minimum allowed leaving temperature was 1°C8. The heating coil was zero air side effectiveness, which its range was from 0− 19
, and the liquid side temperature drop was 20°C. The cooling coil was the same air side effectiveness as heating coil but the liquid side temperature rise was
7 Share of loss deposited in zones according to floor area
8 Set > 0 to avoid frost formation
26 5°C. The pass of ventilation air flow was through the intake to the fan and then to the exhaust outlet.
3.3.11 Loss factor of thermal bridges
The loss factor for thermal bridges differed between the zones due to type and long of thermal bridges in each zone. The control set points included minimum and
maximum indoor air temperature and in this case they were 22°C, 24°C respectively. Other parameters of the control set points such as mechanical supply air flow L/ (s. m2), relative humidity %, level of CO2 10(ppm), daylight at workplace (Lux) and envelope pressure (Pa). Each zone in the model included supply and return air for CAV which was different from zone to zone. Appendix 16 shows the loss factor for thermal bridges, supply and return air for CAV in each zone.
3.3.12 Occupation
The model was classified as main and secondary zones according to number of persons who occupied each room in the building in reality. Bedroom and living room were classified as main zones due to occupation possibility while persons were at homes. Meanwhile other rooms like hall, kitchen, toilet, clothes room, dining room, living room…etc were considered as secondary rooms due to less time of occupation could be spent in them. The occupation of main zones was calculated according to the equation:
Occupation=number of persons occupy the appartment
number of main zones in the appartment ... (2)
The occupation of secondary zones was estimated as 50% or might be less than the main zones. The energy use could be affected by number of persons and their status if they were alone or they have families and on other side if they have job or they were jobseekers. Referring to occupancy at homes, energy use could be increased through their actives and the used equipments which released heat and consumed electricity moreover the amount of ventilation which should be sufficient.
10 The level of CO2 is constant because the system type was CAV (constant air volume). It will be
27 Appendix 17shows the real numbering of the apartments and the numbering which is given in this paper and number of main rooms in each apartment11. The occupation was scheduled according to status of persons:
A. Persons who were jobseekers: the occupation was scheduled as” always exist”
during all hours in the day.
B. Persons who have a job: the occupation was scheduled as they were at homes
from (0− 6) and from (18− 24) meanwhile they were not existent from (6− 18).
3.3.13 Equipment
Number of persons, existence and number of equipments could influence electricity energy use in the apartments. The number of equipments was assumed to be (1) in every zone which was occupied except the zones 74 and 75 which were not occupied and empty from any actives. All equipments were assumed to be “Always on”. The statistics of electricity consumption, which was provided by “Ljusdal Energy” company, was the main reference to get the real consumption of electricity of each apartment. Table 6 shows the monthly and annual electrical energy use in each apartment and also the total annual electrical energy use of the building. The steps to calculate electric energy use of each zone were as below:
A. The annual electricity use was divided by the working hours during the year
which were 8760 hour to get electricity use in (KW) for each hour.
B. The electricity use for each hour was multiplied by 1000 W/KW to get electricity
use in (W).
C. Electricity use in previous step was divided by total floor area to get electricity
use for each square meter (W/m2).
D. Total electricity use in each zone (W) was obtained by multiplying electricity use
for each square meter by floor area of each zone.
E. The table in Appendix 18 shows amount of emitted heat in (W) that was released
from the equipments which use energy.
28 Table 6 Monthly and annual electricity energy use
Monthly electrical energy use (KWh)
A pa rt me nt Jan u ar y F eb ru a ry M a rch A pr il Ma y J une July A ug us t Se pt embe r O ct o b er N o v embe r D ecem b er Annual electrical energy use (KWh 1 325 298 330 314 357 361 348 334 324 361 378 412 4143 2 277 240 248 231 235 218 218 222 244 255 252 296 2936 3 192 171 174 152 127 118 154 148 137 155 168 201 1898 4 183 190 208 141 143 125 141 129 188 267 224 193 2132 5 327 294 291 244 244 226 154 212 244 264 290 327 3117 6 183 160 169 97 166 171 168 179 183 137 155 147 1915 7 143 168 166 139 131 106 116 144 125 126 132 167 1663
Total annual electrical energy use in all apartments (KWh) 17804
3.4 Renovation
The aim of renovation was to improve indoor climate and reduce energy use in the building by many changes such like:
A. In order to recover heat energy from the exhaust, a heat exchanger with
effectiveness 0.85 and constant temperature of 18°C was added to air handling unit (AHU).
B. Indoor air temperature was reduced to 20°C.
C. An insulation layer, with 100 mm thickness, was added to the roof. D. An insulation layer, with 200 mm thickness, was added to the roof.
E. Windows were changed to type {Pilkington OptithermS3 {(4− 15 Ar− 4− 12Ar−
S (3)4P} with U− value 1.0 W/ (m2
.K). (SHGC) was 0.55 and transmittance (t) was 0.47. Thermal bridges were changed to half value of that in table 4.
F. Windows were changed to type (Saint – Gobain T4− 12m) with U− value 0.7 W/
(m2.K). SHGC was 0.31 and transmittance (t) was 0.26. Thermal bridges were changed to half value of that in table 4.
G. An insulation layer with 100 mm thickness was added to the external walls and
thermal bridges were changed to half of that in table 4.
H. An insulation layer with 200 mm thickness was added to the external walls and
29
I. Steps A. F and H were combined with changing thermal bridges values to those
as they were in step H.
J. Steps I and D were combined. K. Steps J and B were combined.
In every change of above steps, the simulation was run to see how much savings in heating demand and heating value which were obtained in validation value.
3.5 Prefabrication
There were four stages of simulation in this part as below:
Stage 1
A fifth floor was built with same dimensions and data as the fourth. Heat exchanger was the same as in renovation part. Table 7 shows thermal bridges values.
Table 7 Thermal bridges values of prefabrication− Case 1
Number of thermal bridge Type of thermal bridge The value (W/K)
1 External wall/internal slab 0.0072
2 External wall/internal wall 0.0072
3 External wall/external wall 0.0432
4 External windows perimeter 0.0144
5 External doors perimeter 0.0144
6 Roof/external walls 0.0504
7 External slab/external walls 0.0576
8 Balcony floor/external walls 0.072
9 External slab/internal walls 0.0072
10 Roof/internal walls 0.0072
A. Heat exchanger was the same as in renovation part.
B. Balconies and shadings were deleted.
C. A layer of insulation with 0.5 m thickness was added to the roof.
D. A layer of insulation with 0.35 m thickness was added to the external walls. E. The windows were changed to a type with U− value of 0.7 W/ (m2.K).
SHGC of 31 and solar transmittance of 26.
F. Indoor air temperature is decided as 21°C and 24°C as minimum and maximum temperature respectively.
Stage 2
This stage was the same as stage 1 but with reducing indoor air temperature to 20°C instead of 21°C and thermal bridges between balconies and external walls was set as zero.