THESIS
ANALYSIS OF LIFE CYCLE ASSESSMENT OF FOOD/ENERGY/WASTE SYSTEMS AND
DEVELOPMENT AND ANALYSIS OF MICROALGAE CULTIVATION/WASTEWATER TREATMENT INCLUSIVE SYSTEM
Submitted by
Kristina Ochsner Armstrong Department of Mechanical Engineering
In partial fulfillment of the requirements For the Degree of Master of Science
Colorado State University Fort Collins, Colorado
Summer 2013 Master‘s Committee:
Advisor: Thomas H. Bradley Susan De Long
ii ABSTRACT
ANALYSIS OF LIFE CYCLE ASSESSMENT OF FOOD/ENERGY/WASTE SYSTEMS AND
DEVELOPMENT AND ANALYSIS OF MICROALGAE CULTIVATION/WASTEWATER TREATMENT INCLUSIVE SYSTEM
Across the world, crises in food, energy, land and water resources, as well as waste and greenhouse gas accumulation are inspiring research into the interactions among these
environmental pressures. In the food/energy/waste problem set, most of the research is focused on describing the antagonistic relationships between food, energy and waste; these relationships are often analyzed with life cycle assessment (LCA). These analyses often include reporting of metrics of environmental performance with few functional units, often focusing on energy use, productivity and environmental impact while neglecting water use, food nutrition and safety. Additionally, they are often attributional studies with small scope which report location-specific parameters only. This thesis puts forth a series of recommendations to amend the current practice of LCA to combat these limitations and then utilizes these suggestions to analyze a synergistic food/waste/energy system.
As an example analysis, this thesis describes the effect of combining wastewater treatment and microalgae cultivation on the productivity and scalability of the synergistic system. To ameliorate the high nutrient and water demands of microalgae cultivation, many studies suggest that microalgae be cultivated in wastewater so as to achieve large scale and low environmental costs. While cultivation studies have found this to be true, none explore the viability of the substitution in terms of productivity and scale-up. The results of this study
iii
suggest that while the integrated system may be suitable for low-intensity microalgae cultivation, for freshwater microalgae species or wastewater treatment it is not suitable for high intensity salt water microalgae cultivation. This study shows that the integration could result in reduced lipid content, high wastewater requirements, no greenhouse gas emissions benefit and only a small energy benefit.
iv
ACKNOWLEDGMENTS
I would like to thank The Food, Energy, and Waste Global Challenges Research Team including Dr. Susan De Long, Dr. Thomas Bradley, Dr. Marisa L Bunning, Brandon Thompson and Rene Santin for their collaborative work on Part I of this thesis. Additionally, the material in Part II of this thesis is based on work supported by the Department of Energy under Award Number 'DE-EE0002627'.
Disclaimer: This report was prepared as an account of work sponsored by an agency of the United States Government. Neither the United States Government nor any agency thereof, nor any of their employees, makes any warranty, express or implied, or assumes any legal liability or responsibility for the accuracy, completeness or usefulness of any information, apparatus, product, or process disclosed, or represents that its use would not infringe privately owned rights. Reference herein to any specific commercial product, process, or service by trade name, trademark, manufacturer, or otherwise does not necessarily constitute or imply its endorsement, recommendation, or favoring by the United States Government or any agency thereof. The views and opinions of authors expressed herein do not necessarily state or reflect those of the United States Government or any agency thereof.
v TABLE OF CONTENTS THESIS ... i ABSTRACT ... ii ACKNOWLEDGMENTS ... iv TABLE OF CONTENTS ... v
PART I: ANALYSIS OF LIFE CYCLE ASSESSMENT OF FOOD/ENERGY/WASTE SYSTEMS... 1
Introduction ... 1
Research Questions ... 7
Findings... 8
PART II: DEVELOPMENT AND ANALYSIS OF MICROALGAE CULTIVATION/ WASTEWATER TREATMENT INCLUSIVE SYSTEM ... 20
Introduction ... 20
Research Questions ... 24
Findings... 25
Discussion ... 49
PART III: CONCLUSIONS ... 52
1
PART I: ANALYSIS OF LIFE CYCLE ASSESSMENT OF FOOD/ENERGY/WASTE SYSTEMS
Introduction
The world is facing energy, food and water shortages, in addition to waste and greenhouse gas (GHG) accumulation, all compounded by land use changes [1–6]. These crises are all too extensive and complex to be examined together, but too intertwined to be investigated separately [5]. There is no longer one solution to solve one of the problems; many solutions must be examined and implemented. Conversely, many of the problems can be combated with the same solution, developing synergistic multi-system solutions.
The Food, Energy, and Waste Global Challenges Research Team was formed as part of the Colorado State University School of Global and Environmental Sustainability (SOGES) to examine issues at the nexus of food, energy and waste and to develop and evaluate a framework for evaluating the performance of systems in food production, energy generation and waste management focusing on synergistic relationships between each of these traditionally separated fields as opposed to antagonistic relationships. In order to develop a framework for thinking about food/energy/waste systems, specific knowledge gaps found in previous literature need to be addressed.
Current Antagonistic Relationships
Studies analyzing the relationships between food, energy and waste, to this point have mostly focused on the antagonistic connections between the three. For example, many researchers focus on the energy consumed by food production; according to the USDA, in 2002 the United States used 15 Quadrillion BTU for food production [7]. Researchers have studied the production of individual food products including milk [8], Swedish semi-hard cheese [9], orange cultivation in Brazil [10], and ketchup [11]. To study the material and energy inputs and
2
outputs of these systems, researchers often use a ―cradle-to-grave‖ technique called Life Cycle Assessment (LCA). Enough studies have examined the energy and other resource requirements of specific food products to warrant large review articles to consolidate the information [12, 13].
Farming practices are also scrutinized with respect to relative environmental impacts; Gelfand, Snap and Robertson (2010) [14] explored the effects of tillage and chemical input on food/biofuel crops using actual hectare plots. They considered four cases: ―conventional‖ using conventional tilling and chemical practices, ―no till‖, ―low chemical input‖, and ―organic‖. Energy input ranged from organic (requiring 4.8GJ/ha/yr) to conventional (7.1 GJ/ha/yr), whereas yield increased from organic (53.1 GJ/ha/yr) to no till (78.5 GJ/ha/yr). Additionally, energy requirements for food do not stop at the farm; Pretty, Ball, Lang and Morison (2005) [15] explored the ―hidden‖ costs associated with food transport in the UK and found significant energy and monetary costs, especially if the food was imported from overseas or by air transport. Also, Baldwin, Wilberforce and Kapur (2010) [16] explored the energy impacts from restaurants and found that most occur at the farm or in restaurant ―operational support‖ (lighting, heating, ventilation, air conditioning, water, supplies and administration). Food storage and preparation were found to have negligible impacts.
Looking in the opposite direction along the energy-food axis, researchers have focused on the antagonistic relationships between food and energy for processes that produce energy from potential food sources or crops that compete with food sources. For example, many studies have been conducted on the energy efficiency of biofuels and their net energy output. Bioethanol has been reported as both net energy positive [17] and net energy negative [18], depending on the data and methods of analysis. Farrell et al. (2006) [19] reviewed six studies on bioethanol, examining the differences in the assumptions, data, and results and showed that
3
bioethanol actually requires approximately 95% fewer fossil fuels than petroleum and releases around 13% less greenhouse gases. Others have estimated even higher emission reduction, between 48 and 59%, and a net energy ratio between 1.5 and 1.8 MJ produced/MJ consumed, with room for improvement [20]. However, even if bioethanol is net energy positive, many fear that creating energy from food creates too much competition between the two, if not now, then in the future as the world population increases and a higher strain is put on our food sources. One specific area of concern is land requirements; many fear that we will need as much land as possible for food in the near future, and using some of that food for fuel will create economic problems or even shortages [3, 6, 12, 20–24]. Corn ethanol can require between 220 and 490 m2/GJ (based on a production rate of 45.2 GJ/ha in Texas and 20.4 GJ/ha in Iowa) depending on location due to soil quality/fertilizer requirements and climate [20]. Furthermore, studies have expressed similar concerns for water use [5, 12, 21, 23, 25]. Regional irrigation practices greatly affect the water requirements of bioethanol, giving a range of 5 to 2138 L water/ L ethanol [25]. The waste from energy production is another well explored antagonistic relationship. In energy production, waste takes the form of pollution, which is well documented for most of the common energy production methods [19, 26–28], and other waste products like ash, biomass wastes and spent nuclear fuel rods. As the desire for sustainable practices increases, research on the energy requirements of waste disposal is focusing on synergistic waste/energy options rather than the energy consumed through current waste production, handling and disposal practices.
There are also antagonistic relationships explored amongst all three points of the food/energy/waste triangle [29, 30]. Cuéllar and Webber [29] calculated the approximate energy used in food production in 2007 and showed that, assuming 27% of food was wasted (as in 1995), 2030 ± 160 trillion BTU were embedded in wasted food in 2007; this is equivalent to
4
about 2% annual U.S. energy consumption. Additionally, it was shown by Muñoz, Milà i Canals, and Clift [30] that ―postconsumption nutrient emissions‖ (human waste) are important for a true closed cycle life cycle assessment; they can have a large eutrophication potential and they close the carbon cycle. With the high costs of food/energy production and waste disposal becoming more understood, research is being conducted on more favorable and sustainable alternatives.
Current Synergistic Research
In this context, we use the term antagonistic to describe aspects of the food/energy/waste systems wherein the processing or production of either food, energy or waste has detrimental effects on the economy, sustainability or scalability of other food, energy or waste systems. Synergistic systems are those in which these relationships contribute to the economy, sustainability or scalability of other food, energy or waste systems. It is the goal of the author to examine more synergistic relationships between food, energy and waste and to begin to understand how to better synthesize, evaluate and implement synergistic food/energy/waste systems. Synergistic systems are currently being explored in energy systems to provide more sustainable alternatives to fossil fuels. Examples of these systems include producing energy from various waste sources, such as agricultural waste or municipal waste, combining systems to reduce or utilize waste, and developing a better understanding of existing systems to increase efficiency.
In an effort to reduce food crop use for bioethanol, several studies have focused on the development of ethanol from cellulosic wastes, such as corn stover. This has been shown to be a promising alternative to first generation ethanol [19, 27, 31], requiring less land, nutrients, fossil fuels and having lower GHG emissions. Sheehan et al. (2004) [31] calculated that with partial
5
removal of corn stover (enough stover was retained in the field to control soil erosion), soil organic matter drops slightly in early years, but levels out. Also, for each kilometer fueled by corn stover-E85, the test vehicle used 95% less petroleum compared to gasoline. Spatari, Zhang and MacLean (2005) [27] calculated that, compared to low sulfur reformulated gasoline, switchgrass based E85 produced 57% lower emissions; corn stover-E85, 65%. Since ethanol from corn stover shares inputs and emissions with grain production, the ―blame‖ can be distributed amongst both, reducing the impact further. It has been shown that biodiesel can be produced from crops, food waste or other agricultural sources, such as microalgae. Second generation biodiesel is produced from various food wastes (animal fat and used cooking oil) or non-food oils (jatropha, jojoba, etc.). Synergistic energy sources reduce or eliminate the competition with food, require less farm land and can produce other by-products, however, second generation biodiesel sources are not numerous enough and lead most simply to low-performance biodiesel [21].
There have also been studies comparing the environmental impact of municipal waste disposal methods and exploring alternatives to landfilling. Additionally, many of the alternatives are also able to produce energy [32–34]. Levis and Barlaz (2011) [33] compared various methods of food waste disposal, anaerobic digestion, composting and landfilling, to determine which was more environmentally beneficial. They found that anaerobic digestion performed best in all the environmental impact categories, but was most costly. It had a global warming potential of -395 kg CO2e/functional unit (1000 kg food waste plus 550 kg of branches), composting ranged between -148 and -64 kg CO2e/ functional unit and land filling ranged between -240 and +1100 kg CO2e/ functional unit. Also, anaerobic digestion, landfilling with energy recovery and bioreactor landfills all produced energy and sequestered NOx and SO2. In
6
Denmark, there has been a ban on landfilling combustible waste since 1997; instead of landfilling, incineration is the most common form of municipal solid waste treatment. Fruergaard and Astrup (2010) [32] compared the environmental impacts of several types of municipal solid waste treatment: incineration of inorganic and organic solid waste with heat recovery, co-combustion of the inorganic portion and anaerobic digestion of the organic portion (with digestate being used for fertilizer and biogas either combusted for electricity or transportation fuels). They found that, for Denmark, incineration of organic waste was more environmentally beneficial than either anaerobic digestion scenarios in nearly all explored impact categories, whereas the treatments for inorganic waste were nearly equal. In Italy, however, landfilling is still the most common form of solid waste management; Cherubini, Bargigli and Ulgiati (2008) [34] explored other options for municipal solid waste disposal for the city of Rome. Similar to Levis and Barlaz [33] they compared landfilling to landfilling with biogas recovery, incineration and a scenario where organics, inorganics and ferrous materials were sorted then anaerobically digested, combusted and recycled respectively. They found that landfilling, with or without biogas recovery, was the most globally polluting scenario; incineration was better than landfilling, but still had several environmental impact problems relating to acidification and global warming potentials. The sorting scenario had overall negative global warming and acidification potentials, reduced mass sent to landfills by over 80% and could produce up to 15.5% of Rome‘s electricity needs and 8.2 of its natural gas needs, however, it did require a 20% increase in fossil fuels for treatment, leading to an overall energy efficiency (Eout/Ein) of 52%.
Overall, the studies that the Food, Energy, and Waste Global Challenges Research Team reviewed utilize several variations on LCA techniques when assessing the environmental and
7
economic impact of the integrated food/energy/waste systems. Although many studies did exist in the field, the best practices for performing these types of studies has not been proposed to date.
Research Questions
Based on this understanding of the field, two research questions were proposed to address the knowledge gaps described above.
Research Question 1: What are the characteristics of studies that can evaluate the
environmental costs and benefits of systems that span the food/energy/waste problem set?
Research Question 2: What are potential synergistic systems that we can explore utilizing
knowledge gained from knowledge gap investigation?
Tasks
In order to answer these research questions, a set of tasks was proposed that resulted in the development of a review of the analysis methods for systems in the food-waste-energy problem set.
With regards to Research Question 1:
Task 1.1: Evaluate current practices in food/energy/waste system analysis
Task 1.2: Determine knowledge gaps in the analysis of food/energy/waste systems Task 1.3: Combine current practices and knowledge gaps into new evaluation
recommendations
With regards to Research Question 2:
Task 2.1: Explore and evaluate synergistic food/energy/waste systems using knowledge gained from Research Question 1
These tasks were completed through individual and group literature reviews, and through discussion sessions with the Food, Energy, and Waste Global Challenges Research Team.
8
Findings
Task 1.1: Analysis of Current Practices
As our basic understanding of the antagonistic and synergistic relationships between food, energy and waste develops, a need to evaluate any future endeavors in the area arises. Currently, much of the work evaluating these systems uses Life Cycle Assessment (LCA) to quantify the systems. LCA is an analysis method for calculating the input/output of a system including the environmental effects (GHG emissions, eutrophication, acidification, etc.) and categorizing the analysis output into a format easier to interpret and compare. The U.S. Environmental Protection Agency and International Standards Organization have suggested guidelines and standards for conducting LCAs. LCA is currently a widely used tool for the analysis of food, energy and waste systems to determine the material and energy requirements for food and energy production and waste disposal, the systems‘ productivity and environmental impact.
―[LCA] is unique because it encompasses all processes and environmental releases beginning with the extraction of raw materials and the production of energy used to create the product through the use and final disposition of the product. When deciding between two or more alternatives, LCA can help decision-makers compare all major environmental impacts caused by products, processes, or services‖ [35].
LCA consists of four major parts: goals definition and scoping, inventory analysis, impact assessment and interpretation.
The first section is the goal definition and scoping, where the preparation for the analysis is organized; defining the purpose and how the study will be conducted. The purpose of the LCA informs the entire analysis by shaping how one performs and interprets the analysis and influencing the inputs and outputs considered, size and level of detail of the study. Defining the boundaries of the system under analysis is another important early decision, directly affecting the amount of information required, analysis time and the representativeness of the results. The
9
boundaries should strive to encompass as much of the system as possible, but ability to collect data and time for analysis should be taken into account. Functional units (FU) define the basis on which the outputs will be compared and normalize the decision criteria. For example, kilogram of food or MJ of energy output are common in food and energy LCAs, but if the research question is based on land constraints, hectare of farmland is also useful. Decision criteria are the normalized outputs used for decision making (e.g. GHG emissions, energy consumption, and health impact).
Inventory Analysis, also discussed independently as Life Cycle Inventory (LCI), is where the energy and material inputs and outputs (including products, co-products and wastes) are identified, quantified and the relevant data is obtained and organized. It begins with flow diagrams of the systems and their boundaries to determine the internal and external flows. The baseline and alternatives, if used, must all share the same boundaries and level of detail to ensure comparability. The quality of a life cycle analysis is based on the quality of the data collected in this phase, making this the most important phase of the analysis and the most time consuming.
Impact Assessment evaluates the results of the inventory analysis, condensing the high volume of data in to a few key impact categories. For example, one can consolidate emission data for carbon dioxide, nitrogen dioxide, and methane emissions into a global warming potential factor, often reported as the impact of an equivalent mass of carbon dioxide (i.e. kg CO2e). From there one can continue to normalize factors such as global warming potential, acidification and eutrophication into a bulk environmental impact category via a predetermined weighting scheme to simplify comparisons.
The final phase, interpretation, is where the results of the inventory analysis and impact assessment are examined for limitations and conclusions and recommendations are reached. The
10
overarching objective of any LCA is to inform decision making, and the interpretation state is the stage of LCA where consensus building, peer review, and decision making might occur. Finally, everything is compiled into an understandable and transparent format. [35]
Task 1.1: How LCA is used in current Food/Energy/Waste systems’ analyses
LCA began being used as an energy assessment tool for manufacturing processes in the 1960s; the use of LCAs eventually broadened to food production then solid waste management [35]. The use of LCA for the evaluation of food systems is so prevalent that Roy et al. [12] consolidated many studies into one report where the authors drew several conclusions about the state of the field. They describe food LCA inputs as including energy and raw materials and the outputs including products, co-products, emissions and waste. Reported metrics often include energy and land area used, mass of final products (also reported as energy/protein content in food or units of livestock) and various environmental impact metrics. The authors also stated that the product, method of production (organic, hydroponic, conventional, greenhouse), location, packaging and distribution all have large effects on the incredibly complex system of food production.
Many LCAs of food, energy and waste systems consist primarily of an accounting of the system (attributional LCAs) [12, 13, 19, 25, 30, 31, 36], but several are moving to more comparative (consequential) analyses1. For example, a 2005 study moved past the farm gate and included transportation of food to retail and place of consumption; they also translated all ―costs‖ (pesticides, eutrophication, GHG emissions, loss of biodiversity, etc.) to actual monetary units
1 According to Curran, Mann and Norris [88] ―‘attributional life cycle assessment‘ is defined as an attempt
to answer ‗how are things … flowing within the chosen temporal window?‘ while ‗consequential life cycle assessment; attempts to answer ‗how will flows beyond the immediate system change in response to decisions?‘‖
11
(GBP/year) as a means of evaluating the ―hidden costs‖ of food production and various methods of avoiding these costs [15]. There have also been comparative analyses conducted to study differences in farming practices. One study conducted a comparative analysis of green energy, conventional and organic food cultivation systems in the Netherlands [37]. Each case modeled the same amount of food and energy production (either from conventional combustion of fossil fuels or energy crops) on single hectare farm. Another conducted a comparative analysis of varying tillage, fertilizer inputs and gathered data experimentally using hectare plots to examine energy efficiencies and yield [14]. Several waste/energy studies have compared energy generating waste disposal methods [32–34] and another compares various methods of energy production from microalgae growth on municipal wastewater [38].
Table 1 describes a sample of individual life cycle assessments reviewed in this study; studies reported in review articles were not included. Organized by first author, it includes a description of where in the food/energy/waste paradigm the study fits, a description of the functional units, which metrics were reported and if the study was an attributional or consequential LCA. Eight types of metrics were identified as important: energy quantity, climate change, land quality, water quality, land use, food/product yield, water use and food quality. ―Energy quantity‖ is a measure of how much energy was required or produced; ―climate change‖ reports any description of GHG emissions or other atmospheric climate change parameters; ―land quality‖ reports any inclusion of metrics regarding acidification, soil carbon levels or other reports of the quality of the soil; ―water quality‖ includes eutrophication or other metrics regarding water pollutants. Finally, any usage of land/water use or food/product quantity metrics was included in Table 1. None of the studies reported included a metric on food quality.
12
Overall, it was found that most food/energy/waste life cycle assessments normalize their results with one functional unit [8, 14, 16, 25, 29, 30, 32, 33, 37, 39, 40] usually product (such as food or energy) or requirements (such as land and energy) of the system (e.g. kg beef, L fuel, ha land used, MJ energy). Additionally, most food and biofuel LCA decision criteria are limited to energy use [8, 12–14, 16, 19, 22, 23, 27, 29–33, 36–39, 41], land use [6, 8, 12, 14, 16, 22, 23, 31, 36, 37, 39, 41], yield [8, 12–14, 23, 25, 27, 31, 36–38, 40], GHG emissions [8, 16, 19, 27, 30–33, 36, 37, 39], water quality [8, 12, 16, 22, 23, 30, 32, 37, 38, 41] and soil quality [8, 12, 13, 16, 27, 31, 32, 37, 41]. These metrics are often expressed as ratios such as kg CO2/kg soy, MJ energy used/L fuel produced and kg soy/ ha.
13
Table 1: Select literature review summary
Study No. FU Functional Unit Energy Quantity Environmental Impacts Land Use Food / Product Yield Water Use Food Quality First Author Year Food / Energy / Waste A /C Climate Change Land Quality Water Quality
Baldwin [16] 2011 Food A 1 month X X X X X
Batan [36] 2010 Energy A 1 MJ produced X X X X X
Broek [37] 2001 Food/Energy C 1 ha*year X X X X X X
Cederberg [8] 2000 Food C 1 kg milk X X X X X X
Chiu [25] 2009 Energy A 1 L EtOH X X
Cuellar [29] 2010 Energy/Waste A 1 year 2007 X
Farrell [19] 2006 Energy A 2 MJ ethanol, L ethanol X X
Fruergaard [32] 2011 Waste/Energy C 1 1 tonne waste X X X X
Gelfand [14] 2010 Food C 1 hectare*year X X X
Kimming [39] 2011 Food/Energy C 1 amount of energy X X X
Levis [33] 2011 Waste/Energy C 1 mass of waste X X
Munoz [30] 2008 Waste/Energy A 1 kg food ingested X X X X
Pretty [15] 2005 Food C 1 capita*time X X X X
Sheehan [31] 2004 Food/Energy A 2 ha, km X X X X X
Spatari [27] 2005 Food/Energy C 2 L ethanol, km X X X X
Sturm [38] 2011 Energy/Waste C 1 ton biodiesel X X X X
Yang [40] 2011 Energy/Waste C 1 kg biodiesel X X
14 Task 1.2: Knowledge Gaps
While looking at the general picture of food, energy and waste system analysis, several knowledge gaps and methodological issues were identified for future research.
When exploring solutions to the aforementioned crises, there are several key decision parameters that must begin to be included in the analyses of food/energy/waste systems, as applicable. For example, the world may be facing a fresh water shortage [4, 5, 42] and many farming communities in the U.S. are in areas where water shortages are a pressing issue. To make an informed agricultural investment decision, the water footprint of the alternatives is a major factor, but many food system analyses fail to report it [5, 12], though it is typically included in biofuel system analyses [23, 25, 36, 38, 40]. Additionally, food nutrition [2, 43] and safety [12] must be addressed, in addition to production quantity, in studies involving the production of food. Moreover, many LCAs only utilize one functional unit and only report a few decision criteria; it has been put forward that multiple metrics should be reported to make better comparisons [12, 22] For example, Roy and colleagues [12] include a section on the relative environmental impacts of meats and dairy, reporting that, in terms of environmental efficiency
per unit protein, chicken is most efficient, followed by pork and beef, but in terms of
environmental efficiency per unit energy content, pork is the most efficient, followed by chicken and still last, beef.
It was also observed that many LCAs are accountings of a specific product, usually from a specific location, produced in a specific way [9–12, 16, 25, 29–31, 36]. Consequential LCAs study the effects of changing various parts of the system, such as comparing organic and conventional farming techniques [8, 14, 37] or various methods for biodiesel production [38]. These studies use the same boundary conditions to analyze similar systems in a parallel fashion, so the only differences in the designs cause variation in the results. Opening up a study as a
15
comparative exercise could better allow for decision making at a personal and policy making level.
Additionally, many studies focus on a single-objective system, such as a biofuel or food product [8–15, 29–31, 36] and few combine systems into a larger synergistic system, like a combined food/biofuel or waste/fuel system [32, 33, 37–39, 44, 45]. As stated previously, combined synergistic systems can increase the sustainability of certain systems and are, theoretically, better than the sum of their parts, but few studies examine if this is the case.
Finally, many studies are location specific; this is problematic on several levels. First, many input values are location specific and depend on the relative location of the various parts of the system. Second, in different locations, different variables are more important. For example, in Europe, where many food LCAs have been conducted, land is a major constraining factor [6, 13, 32, 37], but in the western United States and many developing nations, water is another major constraining factor [5, 42], making LCAs conducted in Europe less meaningful decision making tools for use in the United States.
Numerous studies examining the current and upcoming relationships between food, energy and waste were reviewed, most utilizing LCA as a tool for analyzing the systems. Additionally, many starting points and a few knowledge gaps were found for future research to be conducted investigating synergistic relationships between the three areas. In summary, the following knowledge gaps were identified:
Functional units and decision criteria
Accounting for food nutrition/safety and water is rare. Using more than one functional unit is rare.
Few decision criteria are reported. Analysis type
Most studies utilize an attributional approach.
16 Scope
Few large/combined systems are examined. Location
Usually land constraints are deemed most important.
Task 1.3: Recommendations for New Framework
After individual literature reviews, the Food, Energy, and Waste Global Challenges Research Team consolidated our thoughts and recommendations and came up with the following proposed changes to the characteristics of state-of-the-art LCA:
Functional units and decision criteria
Report net energy, climate change, land use, product quantity, and water use, food safety, and food quality as applicable and using multiple functional units/decision criteria when possible.
Analysis type
Employ a consequential or comparative approach as a decision making tool. Scope
Provide more research focused on large or combined systems. Location
Make the study location independent by providing multiple metrics or sensitivity analysis of location specific parameters.
Task 2.1: Possible Future Synergistic Systems
Several possible systems were discussed for future research purposes, attempting to integrate several knowledge gaps, current research opportunities and system synergies.
System 1- Waste Tire Disposal
Due to their large volume and slow decomposition rate, waste tires have been a problem for a long time. There are many recycling and reclamation techniques possible, but most have significant drawbacks. Tire incineration is a long used method of tire disposal, especially as tires have a higher heating value than coal, so it is possible to generate some benefit to the disposal [46]. As there is currently a large amount of waste tires available in the Fort Collins area, the
17
idea of burning them for additional heat for greenhouses arose. This could reduce the amount of waste tires and the impact of greenhouse agriculture, providing a synergistic use of waste to make energy to grow food; however, the introduced air pollution may make it an undesirable alternative.
System 2- Conventional, Organic and Biofuels Farming
There is currently a recognized trade-off between organic and non-organic agriculture [12, 14, 37] and debate persists on the benefits and impacts of crop biofuels. Another suggested synergistic system to study is the trade-offs between biofuel, organic and conventional crops, similar to the 2002 Dutch study by van den Broek and colleagues [37]. They examined three systems: a traditional crop farm (base), a farm utilizing organic farming practices (organic) and a farm with a specified set-aside land to grow a cellulosic biofuel crop (green). Each system produced the same amount of energy (provided by a fossil fuel plant as necessary) and food. The results were mixed; green performed best in terms of acidification, climate change and fossil fuel use; organic, best with respect to soil toxicity; base, slightly better with respect to eutrophication. A new study could compare environmental and resource impacts of the three different crop cultivation systems, using data from the Colorado area. As it would be focused on Colorado, water use, not land use would be a constant between the three systems. They would be compared on the basis of the food and energy produced with a set amount of water and the environmental impacts of each system.
System 3- Algal Biodiesel from Wastewater
While first and second generation biodiesels have significant drawbacks, another alternative source of oil for biodiesel has arisen from microalgae. Microalgae have shown to be a promising feedstock choice due to their high photosynthetic efficiency, growth rate and oil content leading to high efficiency and lower land use. Additionally, many sources state that
18
wastewater could be used to offset some of the nutrient and water requirements [36, 38, 40, 44, 45, 47–62], but few have actually studied doing so. Studies have shown that microalgae can be used to remove nitrogen and phosphorus from wastewater on a bench top scale system [40, 44, 54–57]. Sturm and Lamer (2011) [38] produced microalgae in open pond reactors filled with municipal wastewater; the microalgae produced had a lipid content of only 10%, but the process still was net energy positive. Additional energy benefits came from eliminating the need for a biological nutrient removal process to treat the wastewater. This was chosen as a synergistic system to be studied. It was modeled using hybrid photobioreactors as described by Batan et al. (2010) [36] and Quinn et al. (2011) [63]. The hybrid photobioreactors have been shown to produce lipids on less land and with less energy and GHG emissions than soy [36, 63]. Specifically, the hybrid photobioreactors avoid 75.29 g CO2e/MJ of greenhouse gas emissions compared to soy‘s 71.73 and conventional diesel emitting 17.24 g CO2e/MJ. Additionally, hybrid photobioreactors have a net energy ratio of 0.93 MJ energy consumed/MJ energy produced compared to soy‘s 1.64 [36]. This system, being a photobioreactor, has a higher algal growth rate than an open pond reactor [64] and costs less than a regular photobioreactor, using polyethylene panel reactors instead of glass tubes to house the growth media.
Task 2.1: Analysis of Chosen System
Based on my understanding of the challenges and opportunities available for the analysis of synergistic food/waste/energy systems, the microalgae biofuel system was chosen for further analysis. This further analysis will seek to enable a lifecycle accounting of the integrated wastewater/biofuel system which includes:
Functional units and decision criteria
Evaluate water use, energy use, yield, climate change parameters and provide results using several functional units (per ha*yr, per algae yield, etc.).
19 Analysis type
Use a consequential LCA framework wherein several design scenarios including a current practice scenario will be compared.
Scope
Evaluate a system consisting of two normally independent processes. Location
Analysis will include water and land metrics.
Table 2: Comparison of food/energy/waste system analysis between current state of practice, recommended practice and practices used in this study
Current Practice Recommended Used in Part II Functional
Unit One Multiple
hectare*year; kg dry algae; MJ; 50% US wastewater usage Decision Parameters
Net Energy Common
Use multiple parameters
Yes
Climate Change Common Yes
Land Use Common Yes
Product Quantity Common Yes
Water Use Rare Yes
Food
Safety/Quality Rare n/a
Approach Attributional Consequential Consequential
Scope Narrow Large Multiple system inclusive
Location Specific Independent/
More Inclusive
Includes metrics of interest for many locations
20
PART II: DEVELOPMENT AND ANALYSIS OF MICROALGAE CULTIVATION/ WASTEWATER TREATMENT INCLUSIVE SYSTEM
Introduction
It is generally acknowledged that petroleum, and thus diesel, is a finite resource and alternatives need to be sought. The development of next generation biofuel systems is motivated by the desire for a long-term sustainable personal transportation sector through a reduction in petroleum imports and greenhouse gas emissions. To enable the development of these fuels, the U.S. Congress enacted the Energy Independence and Security Act (EISA) in 2007, which sets up a schedule for increased ―advanced biofuel‖ production culminating in the production of 21 billion gallons per year of ―advanced biofuels‖ by 2020. Advanced biofuels are defined in EISA as any ―renewable fuel, other than ethanol derived from corn starch, that has lifecycle greenhouse gas emissions… that are at least 50 percent less than baseline lifecycle greenhouse gas emissions.‖[65] All biodiesel could fall under this definition.
Early Biodiesel
First generation biodiesel is derived from plant oils such as soy, peanut and sunflower [21]. Plant oil has been used to fuel diesel engines since before 1900 [66]; however, as biofuels‘ importance has risen, their drawbacks have also come to the forefront. Plant based oils require cultivation resources (land, nutrients and water) and are considered to compete with food stocks, if not now, then as the world population increases. Second generation biodiesel uses both food alternative crops (jatropha and jojoba oil, tobacco seed) and food waste (waste cooking oils and animal fats). These fuel stocks hold many advantages over the first generation: reduced competition between food and fuel, less land is required and it may be of poorer quality, additional byproducts, and some better fuel properties. Conversely, the biodiesel from animal
21
fats perform poorly in cold temperatures, create problems in transesterification and may present a biosafety issue [21].
Microalgae Biodiesel
Microalgae-based biofuels meet the requirements of an EISA advanced biofuel and exhibit several sustainability and productivity advantages over first and second generation biofuels. Microalgae have a high photosynthetic efficiency, growth rate and oil yield compared to the more traditional feedstocks. Additionally, they can be harvested year-round, require less and lower quality water and land than conventional feedstocks, thereby reducing the direct and indirect land use changes associated with biofuels [21, 36, 40]. Microalgae do not directly affect the human food chain [50, 51, 67], may not require herbicides or pesticides [21, 68], and have a reduced nitrification potential compared to previous generations of biofuels [69]. Moreover, they can be used for direct CO2 mitigation [21, 36, 40, 47, 54, 62] and wastewater treatment [36, 38, 40, 44, 45, 47–62].
Despite these positive features of microalgae over other feedstocks, their high capital intensity and the unscalability of conventional nutrient sources have been hypothesized to limit the scale of current microalgae biofuels‘ commercial production [45, 52, 62, 70].
What are microalgae?
Microalgae are photosynthetic microorganisms with a high lipid fraction that is convertible to biodiesel with existing technologies [67]. Many different species of microalgae exist, each with different proportions of carbohydrates, lipids and proteins, such that some are better for biodiesel production than others [71]. When nitrogen is plentiful, the cell can grow, increasing the amount of protein; when nitrogen is limited, lipids are produced [63].
22
It was found by Redford that carbon, nitrogen and phosphorous are in stable constant ratios of 106:16:1 in most forms of plankton [72]. Using this, an average elemental composition of microalgae can be derived as C106H181O45N15P [51].
How are microalgae grown?
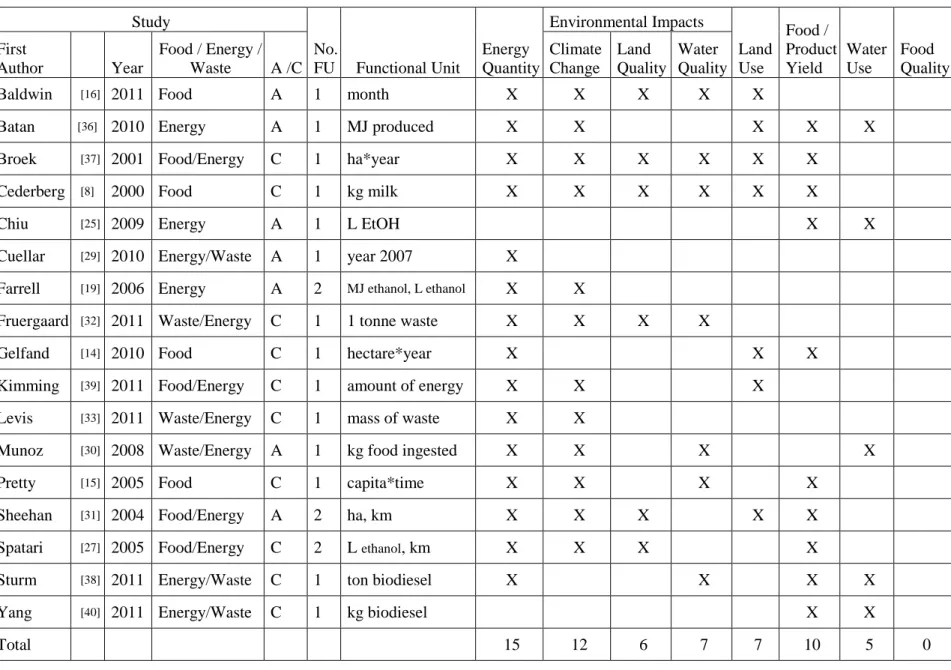
There are several different methods used to grow microalgae including open pond/raceways and closed photobioreactors (PBR). Raceway ponds have been used for algae cultivation since the 1950s. They have significant evaporative and carbon dioxide losses to the atmosphere, risk foreign species contamination, and low microalgae concentration, but are, generally, less expensive to build and operate and considered the only economically sound method of large scale microalgae production. PBRs consist of an array of small transparent tubes or plates, arranged in parallel or coiled. PBRs significantly lowered evaporative and carbon dioxide losses, take up less area, are less susceptible to contamination and have lower biomass recovery costs. They are more expensive, can allow oxygen to accumulate in the reactor reducing algal growth and have several other engineering issues that need to be worked through during design [62, 64, 70]. Hybrid photobioreactors have been developed as a way to compensate for the problems related to open ponds and traditional photobioreactors. Solix Bioproducts and Colorado State University have developed a hybrid photobioreactor, in which, long polyethylene panel reactors replace the transparent tubes of conventional photobioreactors. These reactors are cheaper, have built in CO2 flow to allow for mixing and self-cleaning, and have a higher photosynthesis area allowing for more microalgae growth. This system is designed for large scale cultivation of microalgae with the intent to become biodiesel or for other microalgae bioproduct production purposes. Each polyethylene panel reactor has a pipe for CO2 enriched air to be released and bubble through providing carbon to the microalgae, mixing the reactor media and removing microalgae from the walls (see Figure 1). This is a major
23
improvement over previous photobioreactors as a microalgae biofilm will block light to the rest of the microalgae. The algae are inoculated at a concentration of 1 g/L and fed a mixture of nutrients including 0.425g/L sodium nitrate. This is the only nutrition supplied to the algae, other than CO2; it is consumed within a few days and the algae are then nitrogen starved, triggering stress and switching from protein to lipid production. The reactors sit in a thermally controlled bath that can have heating and cooling systems, these can even be incorporated from nearby waste streams [36, 63].
Sparge Tube 17.4 m 0.30 m 0.28 m External Ballast Attachment External Ballast Attachment Sparge Tube 0.05 m 0.28 m 0.30 m Growth Media Growth Media Head Space
Figure 1: Diagram and photograph of the generation 3 Solix photobioreactor used to validate Quinn et al.'s bulk growth model [63]
The Problem
While microalgae have been championed as a potential large-scale biofuel source [21, 36, 47, 49–51, 62, 64, 67, 73], others have documented the numerous obstacles in the way of high intensity microalgae cultivation [36, 51, 62, 68, 70, 73]. One of the foremost problems is the high water and nutrient requirements [36, 51, 62, 68]; as demand for additional fuel sources has risen, research has been conducted on combating these weaknesses. The U.S. Department of Energy‘s Aquatic Species Program conducted a long running series of studies to improve microalgae‘s viability as a sustainable and affordable fuel stock option. Advances were made in maximizing lipid production by choosing algae species, growth reactor engineering, genetic
24
tailoring, and stress triggering, but presently, high intensity biodiesel production from microalgae continues to have scalability problems [74].
To improve scalability and reduce the direct nutrient requirements of large scale microalgae production, many studies suggest the use of wastewater to satisfy the water and nutrient requirements of large-scale cultivation [36, 38, 40, 44, 45, 47–62]. As an aside, nitrification of water sources is becoming more of a problem and there are increasing demands for the reduction of nitrogen in wastewater effluents [45, 75]. Biological Nutrient Removal (BNR) is often used to remove nitrogen, but it is an energy intensive process [38, 45]. It stands to reason that combining wastewater nitrogen removal with the nutrient requirements of microalgae could be a synergistic solution to both problems. However, no studies have examined the practicality of wastewater as a water/nutrient solution for high-intensity production of microalgae biofuels.
Research Questions
Research Question 3: Is wastewater a practical replacement for microalgae's nutrient and/or
water requirements?
Tasks
With regards to Research Question 3:
Task 3.1: Determine if literature supports idea that microalgae can be grown in wastewater
Task 3.1.1: Determine if the resulting microalgae is suitable for high intensity production
Task 3.2: Develop and examine several microalgae/wastewater inclusive systems with respect to high intensity production viability
25
Task 3.3: Evaluate the systems for the production of 21 billion gallons of microalgae biodiesel produced, matching the EISA mandate, and the utilization of 50% of U.S. wastewater.
Findings
Task 3.1: Microalgae Growth in Wastewater
The use of algae in municipal wastewater treatment began in the early 1950s with work done by Ludwig, Oswald, Gotaas and Lynch [58–60]. They showed that various species of algae are able to grow in wastewater, and that the algae produce enough oxygen for bacteria to treat the wastewater. This work was expanded to include the idea of combining wastewater treatment and power generation; specifically anaerobically digesting the wastewater-cultivated algae to produce methane for power generation [61]. Since then, many microalgae production and environmental assessment researchers cite these or other studies to support the idea that microalgae grown in wastewater is the solution to microalgae biodiesel production‘s nutrient problems [36, 38, 40, 44, 45, 47–62]. Others have investigated the suitability of wastewater for microalgae‘s nutrient needs, and many have produced biodiesel from microalgae grown in wastewater [38, 40, 44, 54–57].
None of these assessment studies incorporate a reduction in productivity or lipid content of the microalgae feedstock due to supplying nutrients from wastewater, but every surveyed study of microalgae production using municipal wastewater as a nutrient stream demonstrates that these important metrics of economic performance may be compromised [64, 70, 76–78]. The microalgae species modeled in this study, Nannochloropsis salina, can achieve a lipid fraction of over 50% in the laboratory [79–81] and at the pilot scale [63] using standard nutrient sources. Studies at the bench top scale using municipal wastewater as a nutrient source varied in
26
lipid count between 4.9% (using mixed algae species) [54] and 36% (using Botryococcus
braunii) [56]. Another bench top scale wastewater study [55] achieved an even higher lipid
fraction, almost 60%, by introducing a second phase before which the microalgae (Nannochloropsis sp. grown in a seawater/wastewater mixture) was centrifuged, cleaned and placed in a high light, nitrogen limited, saltwater environment; before the second stage, lipid content was around 34%. Sturm and Lamer‘s pilot scale reactors, using only wastewater as a nitrogen source and a natural algae mixture, achieved a lipid fraction of ~10% and growth rate of 12 g/m2/d [38]. It is unclear whether the lower lipid fractions available from microalgae cultivated using a wastewater nutrient source can support environmentally beneficial and high intensity microalgae production.
Based on this understanding of the field, this paper evaluates the compatibility, productivity, and environmental impacts of combining large-scale microalgae-based biofuels with wastewater treatment. In order to better understand the effects of replacing growth process water with wastewater, several systems of integrated wastewater/algae production were modeled to compare the energy and material requirements and greenhouse gas emissions within the same set of boundary conditions.
Task 3.2: Modeling of Microalgae Cultivation /Wastewater Treatment Inclusive Systems In order to evaluate the performance of the microalgae cultivation and wastewater treatment integrated system, we must combine models of the microalgae cultivation systems and models of the wastewater treatment systems. This system-level model is then used to consider different scenarios for integration of wastewater and microalgae production and interpret outputs in terms of a lifecycle environmental impacts and scalability analysis.
27
Microalgae Cultivation Model
The cultivation model initially created by Batan et al. [36] and refined by Quinn et al. [63] was employed for modeling the material and energy needs of microalgae cultivation. Their model is based on data from the Colorado State University/Solix Bioproducts pilot plant scale reactor system and utilizes Nannochloropsis salina. This system was chosen for the level of specificity and accuracy available in the microalgae biofuel life cycle model. The cultivation model applies a growth rate of 15.7 g/m2/day and lipid fraction of over 50% of the dry algae mass, both of which have been derived and validated in an industrial pilot-scale reactor. This growth rate is significantly lower than many productivity potentials used in microalgae life cycle studies, many of which are based on extrapolation from the bench-top scale, to conservatively estimate the potential of microalgae biofuels [63]. Microalgae system modeling studies conflict on the determination of microalgae nitrogen requirements; studies have used nitrogen requirements derived using the average elemental composition of microalgae (C106H181O45N15P) [51] arriving at a conclusion that nitrogen composes 9.2% of dry microalgae by mass. Benemann, Woertz and Lundquist [77] suggests that this value is overestimating the nitrogen requirements as it is based on the average of various microalgae species, not on a microalgae species with a high lipid fraction. Algal lipids have significantly less nitrogen than the algal proteins [71], leading many researchers to possibly overestimate the nitrogen content in microalgae. The nitrogen requirements for this study were adopted from Quinn et al‘s determination of Nannochloropsis salina’s growth rate [63] and assumes nitrogen is supplied by 0.425 g/L of sodium nitrate or requires 23.33 grams of elemental nitrogen per kilogram of dry algae (1,334 kg/ha/yr). Approximately 19,000 m3/ hectare/year of water make up the majority of the growth media and most is able to be recycled. The photobioreactor uses polyethylene panel reactors suspended in clear water to allow for light penetration and to provide a CO2 flow for
28
mixing and self-cleaning. Inside the panel reactors, the microalgae can be cultivated in the clean or wastewater. Centrifugation is used for dewatering and the corresponding energy requirements from Batan et al. are incorporated into the cultivation model [36]. Extraction and transportation/distribution are not modeled as they are outside the boundary of this comparative study and are identical for the considered scenarios.
Wastewater Treatment Model
It has been observed that microalgae can not only treat wastewater effluent to reduce its eutrophication potential and, specifically, Chlorella sp. has been shown to reduce nitrogen, phosphorous, chemical oxygen demand (COD) and trace metals‘ (aluminum, calcium, iron, magnesium, manganese, and zinc) concentration at several stages of wastewater treatment [82]. Nannochloropsis sp., a saltwater species, has not been used extensively in wastewater/microalgae cultivation investigations, but has been shown to grow in salt water/wastewater mixtures [55]. Wang et al (2010) [82] demonstrated that the insertion of a microalgae wastewater treatment process before or after primary settling is an efficient means of removing nitrogen and COD from municipal wastewater (~82% and 75% of nitrogen and ~51% and 57% of COD, respectively); negatively, it has a higher retention time than the currently used activated sludge process. Based on these studies, this model assumes that microalgae production can replace energy intensive Biological Nutrient Removal (BNR), resulting in an energy credit of 22 MJ for every kilogram of nitrogen removed in the form of reduced electricity use [38, 45]. In addition to a GHG emission credit from the avoided electricity needs of BNR, there is a credit for microalgae growth having lower direct N2O emissions than BNR (0.035 kgN2O/kg nitrogen removed) [69, 83]. This model assumes that all nitrogen present in the wastewater is available for microalgae growth and utilizes the mid-flow ―untreated wastewater‖ scenario described in Metcalf and Eddy (2003) [75] where the concentration of nitrogen is a constant 40mg/L and
29
flows at a rate of 460 L/day/capita. It is assumed that, like Wang et al., the wastewater has undergone preliminary treatment (removal of rags, sticks, grease, etc) either immediately before or after primary settling. Additionally, all nitrogen is assumed to be consumed in the microalgae growth stage. Previous studies with wastewater have demonstrated as low as 61.4% consumption [38], however, they used a continuous reactor whereas the system used here is modeled as a batch reactor where nitrate concentration has been shown to reach zero [69].
Life Cycle Assessment
The life cycle inventory data is based on previous work and continues to use the Argonne National Laboratory GREET model (GREET 1 2011) as a source for energy use and greenhouse gas emissions data [28, 36].
The scenarios described were compared using several metrics: microalgae productivity; energy, fertilizer and water requirements of the systems; amount of wastewater denitrified; greenhouse gas emission produced. The metrics will be scaled on basis of per hectare per year, or per kilogram of dried algae produced. The former allows comparisons for when land use is a constraining variable; the latter, for productivity. Another means of comparison is energy requirements per expected energy output via combustion of microalgae, or the energy return on investment (EROI). Additionally the scalability of each scenario will be compared based on full production of the EISA mandate and the percentage of the EISA mandate able to be produced with the United States‘ wastewater flows.
Boundary Conditions of the Models
This study attempts to take several key elements of biomass lipid production into account in an attempt to accurately model potential systems and to provide a means of comparison between several microalgae and wastewater integration scenarios and only focus on the portions of microalgae cultivation and wastewater treatment that are pertinent to the research questions.
30
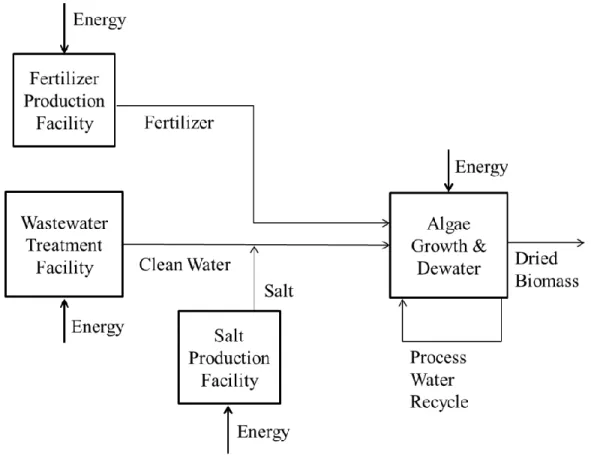
The effects of salt and sodium nitrate fertilizer production, BNR, and microalgae cultivation (growth and dewatering) were the primary considerations of this study. Not included in the models are the effects of the extraction, conversion and transportation of microalgae biodiesel, coproducts of microalgae biodiesel production (glycerin, microalgae extract), transportation of wastewater or other materials, pre- or post-treatment of wastewater, coproducts of wastewater treatment (utilizing wastewater and wastewater products for energy production), nor phosphorus nutrient requirements. These were omitted as being identical between the scenarios or having small impact [36] and outside the scope of the study [35].
Figure 2: Overall system model
Task 3.2: Development of Microalgae Cultivation /Wastewater Inclusive System Scenarios This study compares a baseline microalgae biofuel production scenario to several alternative integrated wastewater treatment and biofuel production scenarios. All scenarios replace pool evaporative losses with clean treated water; carbon dioxide is assumed to be from a nearby facility [36]; and, wastewater is assumed to be from a nearby wastewater treatment facility and to be BNR-ready.
31
Baseline
The baseline scenario (B) is similar to the system described in Batan et al. in 2010 [36] (see Figure 3). The microalgae (Nannochloropsis salina) are assumed to grow at a rate of 57,200 kg/ha/yr [63]. Most of the process media is made up of recycled process water (18,300 m3/ha/yr), with process and evaporative losses replaced by fresh water. Since this is a salt water species, salt is added to any fresh process water to maintain a salinity of 20 g/L. Nitrogen nutrients are obtained via a sodium nitrate fertilizer (1,335 kg N/ha/yr) to obtain an elemental nitrogen concentration of 70 mg/L during inoculation. The outputs of this system are only dried microalgae.
32
Scenario 1
The first alternative scenario (S1-Wastewater) (see Figure 4) replaces all process water with wastewater and eliminates the recycle stream. No nitrogen fertilizer is added, leaving the growth media with a nitrogen concentration of 40 mg/L, resulting in a proportionately reduced growth rate (32,640 kg/ha/yr) [63]. Salt is still added to the wastewater/process water to maintain the required salinity so, it should be noted that the resulting nitrogen-reduced wastewater is saline.
33
Scenario 2
As the first alternative scenario is assumed to have reduced productivity, the next alternative (S2- Conc. WW) was designed to concentrate all incoming wastewater to meet the required nitrogen concentration (70 mg/L) (see Figure 5). The water enters the condenser at 23oC, is heated, and then is vaporized until the liquid output of the condenser reaches the appropriate volume and concentration. The condenser is powered by natural gas and has a steam waste product, which is used along with the heated wastewater to heat the incoming wastewater with an assumed 80% effectiveness. This scenario uses the same microalgae growth rate as the baseline and uses far more wastewater (33,400 m3/ha/yr) but produces nitrogen-less saline and pure steam. It is also possible, but not modeled, that concentrating the wastewater could produce higher concentrations of ion species that inhibit microalgae growth or are not reduced to acceptable wastewater treatment levels.
34
Scenario 3
The third scenario (S3- WW & F) reconciles the high fertilizer demand and low productivity of the previous scenarios (see Figure 6). For this scenario, all process water is still replaced by wastewater, but the desired nitrogen concentration is obtained by also adding fertilizer (573 kg N/ha/yr). Again, since there is no recycling of process water, the scenario yields nitrogen-less saline wastewater.
35
Table 3: System characteristics
Inputs Value Units
Baseline S1 S2 S3
Algae Growth Rate 57 165 32 640 57 165 57 165 kg/ha/yr Land Requirement 0.17 0.31 0.17 0.17 m2/kg dry algae Nitrogen Fertilizer Consumption 23.35 --- --- 10.02 g/kg dry algae Fresh Water Consumption 1 635.82 2 842.25 1 622.88 1 622.88 L/kg dry algae Salt Consumption 259 11 676 6 667 6 667 g/kg dry algae CO2 Consumption 1.92 1.92 1.92 1.92 kg/kg algae Wastewater Consumption --- 584 584 333 L/kg dry algae Water Recycled 320.40 --- --- --- L/kg dry algae Saline Production --- 561 320 320 L/kg dry algae Steam Production --- --- 250 --- L/kg dry algae Energy Consumption 7.42 7.42 7.42 7.42 MJ/kg dry algae GHG Emission - 1.15 0.49 8.56 - 0.53 kgCO2e/kg dry algae
Task 3.2: Microalgae Cultivation /Wastewater Treatment Inclusive System Scenario Results
Energy Decision Metrics
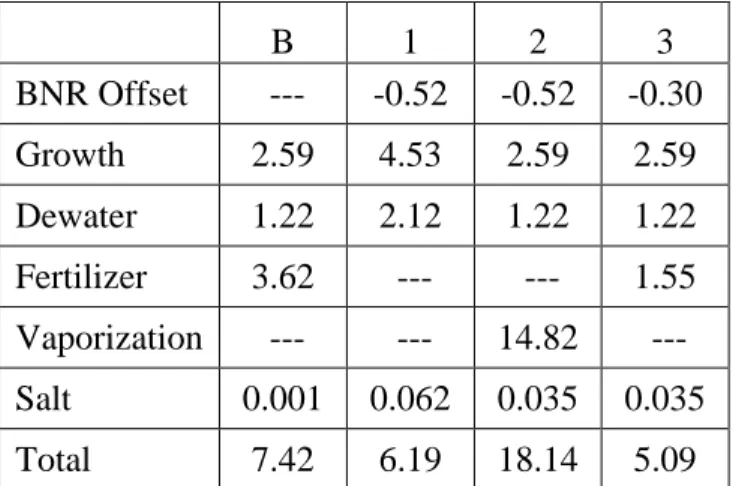
The four scenarios were compared first on an energy requirement per kilogram dry microalgae produced basis for each stage of the system (see Table 4 and Figure 7). The baseline, scenario 2 and scenario 3 all require the same amount of energy for microalgae cultivation while scenario 1 has an increased energy requirement as a result of the reduced nitrogen availability in wastewater decreasing the microalgae‘s productivity. Scenarios 1 and 2 have the highest BNR energy offset due to the increased wastewater used to produce the same amount of dried microalgae, however, the second scenario is shown to be energetically unacceptable. Concentrating the input water requires too much energy to be a viable choice. Scenario 3 has a small energy offset from BNR and a reduction in fertilizer energy requirements, compared to the baseline. For all scenarios, the energy inputs for salt were negligible. Overall, scenario 2 can be
36
rejected due to its high energy requirements, but the other three are still viable options (see Figure 8). The baseline scenario requires 7.42 MJ for every kilogram of dried microalgae produced by the system, both scenarios 1 and 3 required less energy, 6.18 and 5.09 MJ/kg. Table 5 illustrates the energy use for each scenario applying several different functional units. Again, scenario 3 is the most energy efficient in terms of energy required for microalgae cultivation per microalgae production; it is also the most efficient in terms of energy return on investment (EROI), energy required for microalgae cultivation per energy gained from the combustion of dry algae. However, in terms of land use per year, scenario 1 is the most energy efficient, an important distinction if land constraints are more salient than productivity demonstrating the value of reporting multiple functional units.
37
Table 4: Comparison of energy requirements among abbreviated wastewater/algae cultivation systems by component (MJ/kg dry algae)
B 1 2 3 BNR Offset --- -0.52 -0.52 -0.30 Growth 2.59 4.53 2.59 2.59 Dewater 1.22 2.12 1.22 1.22 Fertilizer 3.62 --- --- 1.55 Vaporization --- --- 14.82 --- Salt 0.001 0.062 0.035 0.035 Total 7.42 6.19 18.14 5.09
Table 5: Comparison of measures of energy intensity among wastewater/algae cultivation systems
Measures of Energy Intensity
Scenario EROI [MJ MJ-1] Areal Productivity [MJ ha-1yr-1] Productivity [MJ kg algae-1] B 0.28 425 000 7.42 1 0.24 202 000 6.18 2 0.69 1 037 000 18.14 3 0.19 292 000 5.09
38
Figure 7: Comparison of energy requirements among abbreviated wastewater/algae cultivation systems by component
Figure 8: Comparison of net energy requirements among abbreviated wastewater/algae cultivation systems
-5 0 5 10 15 20
Baseline
S1- Wastewater
S2- Conc. WW
S3- WW & Fert
Energy Requirements (MJ/kg dry algae)
BNR Offset Growth Dewater Fertilizer Vaporization Salt
0 1 2 3 4 5 6 7 8
Baseline S1- Wastewater S3- WW & Fert
39
GHG Decision Metrics
The four scenarios were similarly compared on a greenhouse gas emission (in terms of kilograms of carbon dioxide equivalents) per kilogram dry microalgae produced basis for each stage of the system. Table 6 and Figure 9 show the GHG emissions for each stage of the system. The baseline has largest overall GHG avoidance due to its use of process water recycling, which reduces salt demand. The first and second scenarios have largest BNR offset due to their higher wastewater use but have large salt requirements, and therefore emissions, due to their lack of water recycling. The second scenario‘s vaporization and subsequent GHG emissions dwarf any offsets achieved, providing another reason for removing it as a viable choice for microalgae production. Finally, the third scenario has some offsets from BNR and microalgae growth, but the salt requirements from lack of recycling decrease the overall emissions sequestration. Excluding scenario 2, a better comparison between the baseline and remaining scenarios can be examined (see Figure 10). Here one can see that, while all three scenarios are nearly equal in terms of energy, on the basis of GHG sequestration, the baseline is the more favorable alternative. Table 7 illustrates the GHG emissions for each scenario with two different functional units; in terms of both areal and biomass productivity, the baseline scenario has the highest levels of GHG avoidance.

![Figure 1: Diagram and photograph of the generation 3 Solix photobioreactor used to validate Quinn et al.'s bulk growth model [63]](https://thumb-eu.123doks.com/thumbv2/5dokorg/5525253.144186/28.918.112.546.400.664/figure-diagram-photograph-generation-solix-photobioreactor-validate-quinn.webp)