Proceedings of 8th Transport Research Arena TRA 2020, April 27-30, 2020, Helsinki, Finland
An approach for systematic assessment of infrastructure
automation readiness from a traffic performance perspective
Johan Olstam
a,b,*, Fredrik Johansson
a, Chengxi Liu
a, Iman Pereira
aa Swedish National Road and Transport Research Institute (VTI), SE-581 95 Linköping, Sweden b Linköping University, Department of Science and Technology (ITN), 60174 Norrköping, Sweden
Abstract
Road authorities need tools to assess potential impacts on traffic performance due to the introduction of automated vehicles. Extended traffic modelling tools offer possibilities to estimate impacts on traffic performance metrics such as travel time, delay and capacity. However, there are large uncertainties related to the future behavior of automated vehicles, and these need to be carefully handled. The aim of this paper is to present a systematic and sound approach that can be used by road authorities to assess the automation readiness of a specific infrastructure. We present a definition of automation readiness from a traffic performance point of view, and an approach for how to estimate the automation readiness for a specific road design taking the uncertainties in the development of automated vehicles into account. The developed approach is applied to both macroscopic and microscopic use cases, demonstrating the applicability of the approach for automation readiness assessment.
Keywords: Automation ready; Automated vehicles; Traffic planning; Infrastructure; Road design.
* Corresponding author. Tel.: +46 13 20 41 82; E-mail address: johan.olstam@vti.se
2
1. Introduction
There are expectations on automated vehicles (AVs) to improve traffic efficiency, enhance safety and improve mobility for all. However, these gains of AVs risk not being fulfilled ifroad authorities do not have the capability to shape the deployment of AVs to their mobility goals and plans. Without suitable actions, AVs might worsen the urban mobility problems that local authorities are currently facing. To be able to assess potential effects on traffic efficiency, the traffic models of today need to be made “automation-ready”, i.e. they need to be able to model changes in driving behavior for both automated and non-automated vehicles as well as changes in traveler’s mode and route choice due to the introduction of automated vehicles. There are several ongoing research activities aiming to develop such automation-ready transport models, e.g. the EU project CoEXist2 (Sukennik, 2018, Sonnleitner
and Friedrich, 2018) as well as others (e.g. Mintsis, 2018, Atkins, 2016, Bierstedt, 2014). However, the large uncertainties related to the behavior of future automated vehicles need to be considered in the assessment of the automation readiness. Hence, there is a need to research how the automation readiness of the road infrastructure can be evaluated given the traffic modelling technologies and the resources that road authorities have access to today.
The aim of this paper is to present an approach that in a structured and sound way can be used by road authorities to assess the automation readiness of a specific infrastructure with a given road design, traffic controllers, regulations, etc. To be able to assess the automation readiness, the term “automation ready infrastructure or road design” needs to be defined. The definition developed in the CoEXist project (Olstam et al., 2019) is:
“An automation ready road infrastructure is an infrastructure that allows the coexistence of automated vehicles, conventional vehicles and non-motorized road users, i.e. an infrastructure that can handle an introduction of automated vehicles without significant decline in performance.”
The assessment approach utilizes outputs from automation-ready transport modelling tools as input. The traffic models are applied to a set of consistent scenarios with respect to penetration rates and different types of AVs. Relevant performance metrics are calculated from the model outputs and used to assess the automation readiness in terms of traffic performance for different infrastructure designs. An essential functionality of the assessment approach is to consider and visualize the magnitude of uncertainties with respect to how different types of AVs might behave and which mixes of different generations of AVs that are likely to coexist at different stages of the transition period towards full automation.
The paper first presents an overview of what metrics that have been used in traffic simulation-based investigations of advanced driver assistance systems (ADAS) and automated vehicles (AVs) to assess automation readiness from a traffic performance perspective. Section 3 present the definition of automation ready infrastructure used in this paper. The approach for handling and presenting uncertainties of the automation readiness with respect to potential future development of penetration rates for different types of automated vehicles is presented in section 4. Section 5 and section 6 exemplifies the application of the approach to a macroscopic and a microscopic use case, respectively. Section 7 presents a discussion and some conclusions regarding the proposed approach.
2. Overview of traffic performance metrics used in the literature
Traffic performance assessment of different types of ADAS or AVs using traffic models differs to some extent to the common usage of traffic models, i.e. assessment of various infrastructure and/or traffic control designs. In evaluations of ADAS or AVs it is the driver/vehicle population that change and not the infrastructure. Anyhow, the traffic performance metrics of relevance and interest can be expected to be the same. To investigate if other types of metrics are used for assessment of ADAS and AVs a literature review was conducted. The aim is not to give a complete review of all relevant papers, but rather to give a representative overview of commonly utilized traffic performance metrics used in traffic performance assessment of automated vehicles. Hence, there might be other metrics used and there might be additional usage of the metrics presented here.
2 European Commission (2017) CoEXist: AV-Ready” transport models and road infrastructure for the coexistence of automated and
3
Delay is a commonly used metric, and most common is to use total delay (e.g. Bierstedt, 2014, Klunder et al., 2009, Minelli et al., 2015, Burghout et al., 2015) or average delay (e.g. Bierstedt, 2014, Deluka Tibljaš et al., 2018, Kesting, 2008, Khan et al., 2014, Klunder et al., 2009, Le Vine et al., 2015, Wagner, 2016, Hegeman et al., 2009). But there are also examples of usage of standard deviation of delay or percentiles (e.g. Le Vine et al., 2015). Travel time related metrics as total travel time (e.g. Bierstedt, 2014, Bose and Ioannou, 1998) or average travel time (e.g. Kesting, 2008, Aria et al., 2016, Hegeman et al., 2009) are also used as well as travel time per distance (e.g. Bierstedt, 2014)). Speed related metrics are also common, both average speed (e.g. Bierstedt, 2014, Deluka Tibljaš et al., 2018, Kerner, 2016, Kesting, 2008, Klunder et al., 2009, Ntousakis et al., 2015, Van Arem et al., 2006, van Driel and van Arem, 2010, Aria et al., 2016) and standard deviation of speed (e.g. Deluka Tibljaš et al., 2018, Klunder et al., 2009, Aria et al., 2016), but also analysis of speed profiles (e.g. Bose and Ioannou, 1999, Bose and Ioannou, 2003, Davis, 2007, Kikuchi et al., 2003, Laquai et al., 2013, Van Arem et al., 2006, van Driel and van Arem, 2010).
Several investigations focus also on effects on capacity/throughput/number of served vehicles (e.g. Bose and Ioannou, 1998, Kesting et al., 2010, Klunder et al., 2009, Le Vine et al., 2015, Mahmassani et al., 2018b, Mahmassani et al., 2018a, Motamedidehkordi et al., 2016, Talebpour and Mahmassani, 2016, Van Arem et al., 2006, VanderWerf et al., 2002, Bierstedt, 2014), or effects on the fundamental diagram in terms of speed-density relationships (e.g. Kesting, 2008, Liu et al., 2017, Talebpour and Mahmassani, 2016). Stability (e.g. Bose and Ioannou, 1999, Bose and Ioannou, 2003, Kikuchi et al., 2003, Mahmassani et al., 2018b, Rajamani et al., 2005, Talebpour and Mahmassani, 2016), probability of breakdown (e.g. Kerner, 2016, Kesting, 2008, Kesting et al., 2010, Mahmassani et al., 2018b) and number of shock waves (e.g. Mahmassani et al., 2018b, Van Arem et al., 2006) or shock wave speed (e.g. Mahmassani et al., 2018b, Motamedidehkordi et al., 2016) are other considered metrics. Some studies also considers density or spacing between vehicles (e.g. Klunder et al., 2009, Ntousakis et al., 2015, Rajamani et al., 2005, Aria et al., 2016) or queue lengths (e.g. Deluka Tibljaš et al., 2018).
Macroscopic modelling of automated vehicles commonly also include metrics as modal split (e.g. Minelli et al., 2015, Moreno et al., 2018) and vehicle kilometers travelled (e.g. Martinez and Viegas, 2017, Burghout et al., 2015, Fagnant and Kockelman, 2018, Moreno et al., 2018). Another commonly considered metric is the value of travel time savings (VTTS). It has been found that VTTS can reduce significantly if drivers are free from driving (Kolarova, et al., 2018; Steck et al., 2018). This potentially leads to an increased demand of private cars. The different types of metrics used in the literature can be grouped as
• Delay, travel time and speed related • Capacity or fundamental diagram related • Stability and shock wave related
• Density, spacing between vehicles or queue length related • Lane change frequency / lane utilization
• Vehicle kilometers travelled • Modal split
• Value of travel time savings
The conclusion from the literature review is that the metrics used in the reports and articles do not deviate from the metrics commonly used for assessing traffic performance from traffic models. Travel time, delay, speed and capacity are common traffic performance metrics used in microscopic simulation studies, while total travel time, vehicle kilometers travelled, and modal split are common metrics in macroscopic traffic assignment studies. In fact, only one of the reports (Mahmassani et al., 2018a) explicitly discuss what metrics to use for evaluation of the introduction of automated vehicles. No discussion on how to assess automation readiness or how an automation readiness criterion could be defined based on the used metrics were found in the literature.
3. Definition of automation ready infrastructure
To operationalize the definition of automation readiness cited in section 1, we need to: 1) define metrics for traffic performance, 2) define thresholds for ‘significant decline’ in these metrics.
4
As the literature review concludes, the metrics used in previous studies of automation and ADAS do not differ much from those used in traditional applications of traffic modelling. This indicates that all the usual metrics may be suitable to measure the traffic performance implications of the automation, and that the change in these metrics due to automation can be used to determine if the infrastructure is automation ready. However, when applying metrics to calculate a difference in traffic performance, care must be taken to compare the metrics for corresponding classes of road users. Various travel time based metrics are commonly used to evaluate traffic performance. In this case the problem is twofold: firstly, value of time for automated vehicles is likely to differ, possibly significantly, from that of other road users due to the possibility to engage in other activities during the ride. Thus, comparing the travel time for all cars, including AVs, to a baseline with no AVs may result in a misleading quantification of the automation readiness. We therefore mainly consider the effects on the traffic performance for non-automated modes when evaluating automation readiness. Secondly, total delay for conventional cars is problematic to use as a criterion for automation readiness since the number of conventional cars decrease when the penetration rate of automated cars increases. Thus, averaged metrics are used instead of total.
Many road authorities have policies to prioritize active modes above private cars in traffic planning. This often implies that a road authority can accept a marginal decline in traffic performance for private cars to achieve an improvement for pedestrians and cyclists. However, the details of such policies differ between road authorities. To allow road authorities to define what “without significant decline” implies for different modes and road users, the assessment of effects should be conducted per mode or road user category (e.g. pedestrians, bikes, conventional cars, automated cars, etc.). For example, to ensure that the introduction of AVs do not counteract mobility goals on prioritization of walking, cycling, and public transport over private cars, road authorities can set the threshold for accepted decline for active modes and public transport at a lower level than for private cars.
To summarize, the common performance metrics are still suitable to measure the traffic performance implications of the automation. The automation readiness is assessed by comparing the relative improvement in a performance metric for a specific road user category for each case with a specific penetration rate and mix of AVs with the corresponding baseline case without AVs. This relative improvement is then compared to the road authority requirements, e.g. no acceptance on decrease in improvement for pedestrians, bikes or buses but 5% decrease in performance for cars.
4. Handling uncertainties related to the transition period
Traffic models have traditionally been applied to investigate traffic performance of different road or traffic control designs. In such applications the driver population is assumed to be constant for all investigated design alternatives. For the assessment of the automation readiness of the current infrastructure it is instead the infrastructure that is constant and the driver population that changes. The pace of change of the mix of driving behaviors is highly uncertain. Thus, there is a need to consider several possible AV behaviors and that these different types of AVs might coexist. The combinations of penetration rates for several types of AVs lead to a large space of possibilities, too large for exhaustive exploration to be feasible. Based on the outcome of a set of workshops with persons from research organizations, consultants, cities, vehicle industry, etc. we developed an approach to deal with this by assuming that both the penetration rate of AVs and the level of automation will increase during the transition period towards full automation. That is, we assume that as time goes by, the penetration rate of AVs will increase,
and the AVs will become more capable. This reduces the two-dimensional space of possibilities to a
one-dimensional space. Furthermore, we explore the resulting space in discrete steps as described below.
Traffic investigations of the transition period should consider mixes of different AVs. Depending on the assumptions made on the behavior of AVs the resulting estimate of capacity, delay, travel time, etc. will vary significantly. We therefore suggest to divide the transition period into a limited set of stages (not defined in terms of specific number of years in the future, but rather by the level of automation). To start with, we defined three stages:
• Introductory: Automated driving has been introduced, but most vehicles are conventional cars. Automated driving is in general significantly constrained by limitations (real or perceived) in the technology.
• Established: Automated driving has been established as an important mode in some areas. Conventional driving still dominates in some road environments due to limitations (real or perceived) in the technology.
5
• Prevalent: Automated driving is the norm, but conventional driving is still present.
We then suggest defining a set of consistent scenarios within each stage. These scenarios should specify which penetration rates and which mixtures of different AV behaviors that are expected to be present during each stage. The scenarios can, and should if necessary, also include variations of other uncertain variables as e.g. transport demand and behavioral adaptation of non-automated road users. The next step is to conduct traffic model runs for all the specified combinations of uncertain factors and calculate the automation readiness, i.e. the relative improvement in the performance metrics for each case with AVs and compare it to the baseline without any AVs. The results from the simulation experiments belonging to the same stage of coexistence can be seen as “samples” of the automation readiness during that stage. Both the median and the variability of the samples can be visualized. The variability is represented by the minimum and maximum values for the stage. To illustrate to what extent the current design is automation ready, the median, minimum and maximum values for relevant performance metrics are displayed together with acceptable thresholds provided by the road authority the vehicles need to drive to be able to handle different road environments and driving contexts. Basic AVs is the first type of AVs with SAE3
level 4 capabilities only for one directional traffic environments with physical separation with active modes. The behavior is in general quite cautious and risk minimizing. Intermediate AVs are assumed to have level 4 capabilities in some road environments and driving contexts. The behavior at more complex road environments and driving contexts is still cautious and risk minimizing while the behavior at less complex road environments and driving contexts can be less cautious and still be safe. Advanced AVs are AVs with level 4 capabilities in most road environments and driving contexts. The advanced AVs can drive less cautiously but sill safe in most road environments and driving contexts but still need to apply a more cautious behavior in more complex road environments and driving contexts.
5. Automation readiness evaluation of a macroscopic traffic assignment case
This macro use case is an assessment of the automation readiness in Gothenburg during a long-term construction work period using a macroscopic transport model. The study area includes the whole metropolitan area of Gothenburg including suburban areas. During a transition period, there are many construction projects that entail some restrictions for traffic and reduce the accessibility in the center of Gothenburg. The city administration of Gothenburg is interested in knowing if the introduction of AVs will ease the stress on the road network during such a long-term construction period.
The macroscopic transport modelling tool Visum, is used to model the traffic flows in Gothenburg. The baseline model that describes the current traffic situation was developed and calibrated in another project (for details see Ramböll, 2017). The model handles vehicle traffic as a total amount of private passenger cars and heavy good vehicles. In that sense, there is no separation between private car and heavy good vehicles in terms of the demand representation. The demand matrix is derived from the national transport model "Sampers" (Muriel and Algers, 2002) and calibrated for the peak hours using existing traffic counts.
To capture the impact of automated vehicles in the macroscopic model, a method developed within the CoEXist project is used. This method utilizes the concept of passenger car units (PCU). PCU converts the volume and capacity of a specific type of vehicle into passenger car equivalences. Given that AVs exhibit different car following behavior and driving logics compared to conventional vehicles, the concept of PCU is extended to AVs for different types of AVs, road types and penetration rates of AVs. Specific parameter values of PCUs are obtained through extensive runs of microscopic simulations using Vissim. A detailed description of the method can be found in Sonnleitner and Friedrich (2018). To summarize, Basic AV has a high PCU (indicating it takes more space than conventional vehicle) on motorways and arterials while no difference in PCU compared to a conventional vehicle in urban streets. Intermediate AV has a low PCU on motorways and arterials while a high PCU on urban streets since Intermediate AV will utilize a cautious driving logic on urban streets. Advanced AV has a low PCU on all types of road environment.
Different scenarios with varying AV penetration rates, mixture of AVs and demand configurations are defined and evaluated using the macroscopic model. Specially, the following three stages are defined: Introductory (AV penetration rates: 10% − 30%; AV mixtures: 80% Basic AV and 20% Intermediate AV), Established (AV
3 Sae International. 2016. Taxonomy and Definitions for Terms Related to Driving Automation Systems for On-Road Motor Vehicles, J3016. Sae International. https://www.sae.org/standards/content/j3016_201401.
6
penetration rates: 30% − 70%; AV mixtures: 20% Basic AV and 80% Intermediate AVs; and 80% Intermediate AVs and 20% Advanced AVs), Prevalent (AV penetration rates: 70% − 90%; AV mixtures: 20% Intermediate AVs and 80% Advanced AVs).
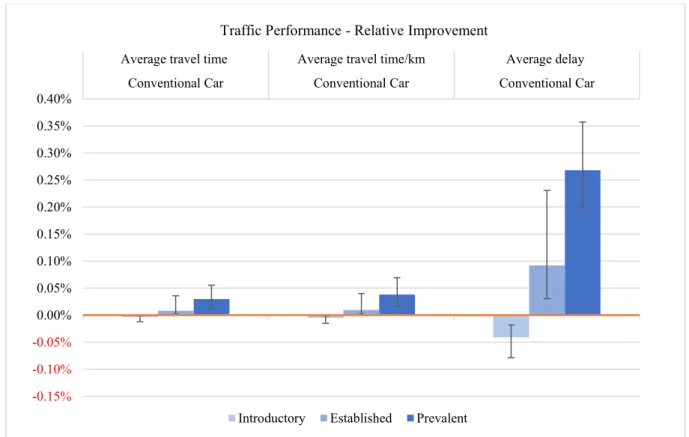
The results of the automation readiness assessment are presented in Fig. 1 in terms of relative improvements in three traffic performance metrics, namely average travel time, average travel time per distance unit and average delay for each of the three stages of coexistence. Each stage consists of several scenarios with varying AV penetration rates, mix of AVs and demand configurations. The bar chart shows the median result within each stage and the error bars indicates the minimum and the maximum result within the stage, thus indicating the uncertainty of the result.
Fig. 1 The improvements of traffic performance measures for each of the three stages of coexistence for the macroscopic example case.
The results suggest that AVs in Introductory stage can result in a small decrease in traffic performance due to the high PCU of Basic AVs, while AVs in the Established stage result in a decent increase in traffic performance and this is followed by an higher increase in the Prevalent stage. Given that Intermediate AVs have a high PCU on urban streets (potential to worsen traffic situation there) and low PCU on motorways and arterials, the results suggest that the introduction of Intermediate AVs in general will ease congestions mainly on motorways and arterials. It is as expected that the impact on average delay is larger than average travel time and average travel time/km, since the travel time consists of the free flow travel time (not influenced by the introduction of AV) and delay (influenced by the introduction of AV). Interestingly, the traffic performance metrics exhibit a large variation for the Established stage and the maximum in Established stage exceeds the minimum in Prevalent stage. This suggests that a specific AV penetration rate and AV mixture in Established stage can have a stronger impact on traffic performance than one in the Prevalent stage.
6. Automation readiness evaluation of a microscopic traffic simulation case
This use case is an assessment of the automation readiness of a shared space in the city center of Gothenburg. The traffic is dominated by large pedestrian flows caused by the many commercial and recreational activities available
-0.15% -0.10% -0.05% 0.00% 0.05% 0.10% 0.15% 0.20% 0.25% 0.30% 0.35% 0.40%
Conventional Car Conventional Car Conventional Car
Average travel time Average travel time/km Average delay
Traffic Performance - Relative Improvement
7
in the area and a large tram and bus stop located next to the shared space. The question investigated in this use case is estimation of the traffic performance effects of the introduction of a last mile service in the form of automated minibuses passing through the shared space.
A microscopic model in Vissim, including Viswalk, is used to model the shared space using a further developed version of the double representation method proposed by Gibb (2015). Vehicles are represented both using the regular Vissim vehicle model for interactions between vehicles and as a pair of very large fictitious dummy pedestrians to enable pedestrians to react to the vehicles through the pedestrian interaction model of Viswalk. To assess the automation readiness of the investigated area an experimental design is set up describing different penetration rates of AVs, mixes of types of AVs, and demand configurations. The three stages of coexistence are defined as: Introductory (AV penetration rates: 0% AV for cars and 100% AV for minibuses, all of type Basic AV), Established (AV penetration rates: 50% AV for cars, all of type Basic AV and 100% AV for minibuses, all of the type Intermediate AV), Prevalent (AV penetration rates: 80% AV for cars, all of type Intermediate AV and 100% AV minibuses all of type Advanced AV).
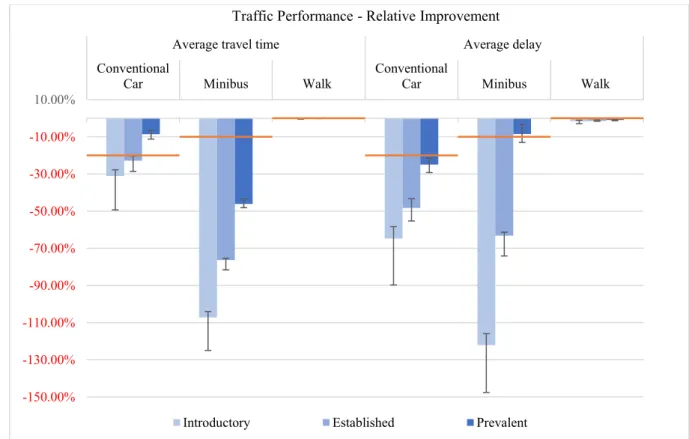
The results of the automation readiness assessment are presented in Fig. 2 as relative improvements in two traffic performance metrics, namely average travel time and average delay for each mode of transportation and each of the three stages of coexistence. As mentioned, each stage consists of several scenarios with varying AV penetration rates, mix of AVs, demand configurations, and behavior of non-automated users in this case in terms of three different levels of pedestrian aggressiveness. The bar chart shows the median result within each stage and the error bars indicates the minimum and the maximum result within the stage, thus indicating the uncertainty of the result.
Fig. 2. The improvements of traffic performance measures for each of the three stages of coexistence for the microscopic example case.
It is noticable that throughout the 3 stages of coexistance pedestrians will experience a small negative but negliable effect in both travel time (< 0.5 % in all cases) and delay (< 3 %). Indicating that the introduction of AVs will not have a significant impact on the experience of pedestrians with respect to average travel time or average delay. Hence, the current infrastructure design can be said to be automation ready from a pedestrian point of view if the road authority do not strictly requires 0% relative imrpovement. The limited effects on pedestrians is likely to a large extent an effect of the assumptions made in the modelling approach of the interaction between pedestrians
-150.00% -130.00% -110.00% -90.00% -70.00% -50.00% -30.00% -10.00% 10.00% Conventional
Car Minibus Walk ConventionalCar Minibus Walk
Average travel time Average delay
Traffic Performance - Relative Improvement
8
and vehicles in which pedestrians have the right of way and do not give way to vehicles but will avoid walking directly in front of them.
For conventional cars, there is a large decrease in traffic performance metrics for all stages. However, even though there is a clear trend of improvement in traffic performance metrics from Introductory to Prevalent, the result shows that manually driven cars will experience a higher travel time and a larger delay than today in all three stages of coexistance. Even if the road authority would accecpt a decline in traffic performance and set the automation-readiness threshold at -20 % the current design cannot be said to be automation ready from a car traffic point of view.
Traffic performance metrics of minibuses show a similar trend as the ones of conventional cars but the effects are larger. The introduction of automated minibuses implies a large increase in average delay, which corresponds to a relative decrease of over 100% in Introdoctury stage. Hence, the current infrastructure cannot be said to be automation-ready from a minibus perspective, even if a decrease of 10% is accepted.
7. Discussion and conclusions
The aim of this study is to develop an approach that can be used by city authorities and consultants to assess automation readiness of investigated infrastructure using automation-ready traffic modelling tools. As the applications of the approach to the two example cases demonstrated, the assessment can be conducted using modelling tools that are commonly used by practitioners in this field. The results indicate clearly and concisely the automation readiness of the investigated infrastructure without overstating the precision of the evaluation but presenting the uncertainties due to the limitations of what traffic models can predict, given the lack of information of the future technology. The applicability of this approach have also been confirmed by successful implementations of traffic planers in other use cases within the CoEXist project.
From the results presented in Fig. 1, the effects in the macroscopic case is what is commonly expected: there is a slight decrease in traffic performance in the introductory stage, while rather significant improvements in the later stages. In the microscopic case, on the other hand, the results in Fig. 2 indicate that there is a significant decline in traffic performance for all stages.
The significant uncertainties of the results, evident in Fig. 1 and Fig. 2, emphasize the importance of evaluating effects of different assumptions on the behavior of AVs, their penetration rates, mixes, and other uncertain factors as travel demand and behavioral adaptation of non-automated road users. The presented sizes of the uncertainties are valid under the assumptions of the development path of AVs assumed in respective use case. These assumptions are by necessity specific to respective use case; the assumptions should differ for different areas, countries, and types of infrastructure. The uncertainties also indicate if further analysis is required, for example if the uncertainties are of a magnitude comparable to the effect.
Although the two use cases presented here are modelled using the automation ready traffic modelling tools developed within the CoEXist project, the approach is not exclusively applicable to the output of these models. Rather the approach is modelling framework agnostic, except that it requires that a range of possible futures are specified in terms of, for example, a set of AV classes, penetration rates, mixes, demand levels, etc. It also requires that assumptions are made on the correlation of penetration rates and mixes of AVs.
Acknowledgements
This research was part of the CoEXist project which was supported by funding from the European Union H2020-ART-2016-2017 under grant agreement no. 723201. Special thanks to Mikael Ivari, Johan Jerling, Andreas Almroth and Nina Galligani Vardheim at Gothenburg city for their work efforts connected to the design of the two assessed use cases. Thanks also to all colleagues within the CoEXist project for valuable input and feedback during the development of the assessment approach.
References
9 Transportation Research Procedia, 2016. pp. 761-770.
Atkins 2016. Research on the Impacts of Connected and Autonomous Vehicles (CAVs) on Traffic Flow - Stage 2: Traffic Modelling and
Analysis. Atkins - Department for Transport.
https://assets.publishing.service.gov.uk/government/uploads/system/uploads/attachment_data/file/530093/impacts-of-connected-and-autonomous-vehicles-on-traffic-flow-technical-report.pdf.
Bierstedt, J., Gooze, A., Gray, C., Peterman, J., Raykin, L. , Walters, J. 2014. Effects of Next-Generation Vehicles on Travel Demand and Highway Capacity. FP Think. http://orfe.princeton.edu/~alaink/Papers/FP_NextGenVehicleWhitePaper012414.pdf.
Bose, A. and Ioannou, P. Analysis of traffic flow with mixed manual and semi-automated vehicles. Proceedings of the American Control Conference, 1999. pp. 2173-2177.
Bose, A. and Ioannou, P. A. Issues and Analysis of Mixed Semi-Automated/Manual Traffic. In: INTERNATIONAL, S., ed. Future Transportation Technology Conference and Exposition, 1998 Costa Mesa, USA. SAE International.
Bose, A. and Ioannou, P. A. 2003. Analysis of traffic flow with mixed manual and semiautomated vehicles. IEEE Transactions on Intelligent Transportation Systems, 4, pp. 173-188.
Burghout, W., Rigole, P.-J. and Andréasson, I. Impacts of Shared Autonomous Taxis in a Metropolitan Area. 94th Annual Meeting of the Transportation Research Board, 2015 Washington D.C. USA. Transportation Research Board.
Davis, L. C. 2007. Effect of adaptive cruise control systems on mixed traffic flow near an on-ramp. Physica A: Statistical Mechanics and its Applications, 379, pp. 274-290.
Deluka Tibljaš, A., Giuffrè, T., Surdonja, S. and Trubia, S. 2018. Introduction of Autonomous Vehicles: Roundabouts Design and Safety Performance Evaluation. Sustainability, 10.
Fagnant, D. J. and Kockelman, K. M. 2018. Dynamic ride-sharing and fleet sizing for a system of shared autonomous vehicles in Austin, Texas. Transportation, 45, pp. 143-158.
Gibb, S. 2015. Simulating the Streets of Tomorrow: An Innovative Approach to Modeling Shared Space. CH2M Hill Inc.
Hegeman, G., Tapani, A. and Hoogendoorn, S. 2009. Overtaking assistant assessment using traffic simulation. Transportation Research Part C: Emerging Technologies, 17, pp. 617-630.
Kerner, B. S. 2016. Failure of classical traffic flow theories: Stochastic highway capacity and automatic driving. Physica A: Statistical Mechanics and its Applications, 450, pp. 700-747.
Kesting, A. 2008. Microscopic Modeling of Human and Automated Driving: Towards Traffic-Adaptive Cruise Control. Doctorial, Technische Universit¨at Dresden.
Kesting, A., Treiber, M. and Helbing, D. 2010. Enhanced intelligent driver model to access the impact of driving strategies on traffic capacity. Philosophical Transactions of the Royal Society A: Mathematical, Physical and Engineering Sciences, 368, pp. 4585-4605.
Khan, U., Basaras, P., Schmidt-Thieme, L., Nanopoulos, A. and Katsaros, D. Analyzing Cooperative Lane Change Models for Connected Vehicles. International Conference on Connected Vehicles and Expo (ICCVE), 2014.
Kikuchi, S., Uno, N. and Tanaka, M. 2003. Impacts of Shorter Perception-Reaction Time of Adapted Cruise Controlled Vehicles on Traffic Flow and Safety. Journal of transportation engineering, 129, pp. 146-154.
Klunder, G., Li, M. and Minderhoud, M. 2009. Traffic flow impacts of adaptive cruise control deactivation and (Re)activation with cooperative driver behavior. Transportation Research Record, 2129, pp. 145-151.
Laquai, F., Gusmini, C., Tonnis, M., Rigoll, G. and Klinker, G. A multi lane Car Following Model for cooperative ADAS. IEEE Conference on Intelligent Transportation Systems, Proceedings, ITSC, 2013. pp. 1579-1586.
Le Vine, S., Zolfaghari, A. and Polak, J. 2015. Autonomous cars: The tension between occupant experience and intersection capacity. Transportation Research Part C: Emerging Technologies, 52, pp. 1-14.
Liu, Y., Guo, J., Taplin, J. and Wang, Y. 2017. Characteristic Analysis of Mixed Traffic Flow of Regular and Autonomous Vehicles Using Cellular Automata. Journal of Advanced Transportation, 2017.
Mahmassani, H. S., Elfar, A., Shladover, S. and Huang, Z. 2018a. Development of an Analysis/Modeling/Simulation (AMS) Framework for Connected and Automated Vehicle Systems - Task 8: CAV Framework Development. FHWA.
Mahmassani, H. S., Elfar, A., Shladover, S. and Huang, Z. 2018b. Development of an Analysis/Modeling/Simulation (AMS) Framework for Connected and Automated Vehicle Systems - Task 9: Draft V2I AMS Capability Development Case Study Plan. FHWA.
Martinez, L. M. and Viegas, J. M. 2017. Assessing the impacts of deploying a shared self-driving urban mobility system: An agent-based model applied to the city of Lisbon, Portugal. International Journal of Transportation Science and Technology, 6, pp. 13-27.
Minelli, S., Izadpanah, P. and Razavi, S. 2015. Evaluation of connected vehicle impact on mobility and mode choice. Journal of traffic and transportation engineering, 2, pp. 301-312.
Mintsis, E. E. 2018. D3.1 Modelling, simulation and assessment of vehicle automations and automated vehicles’ driver behaviour in mixed traffic Deliverable 3.1 of the TransAid project. https://www.transaid.eu/wp-content/uploads/2017/Deliverables/WP3/TransAID_D3.1_Modelling-simulation-and-assessment-of-vehicle-automations.pdf.
Moreno, A. T., Michalski, A., Llorca, C. and Moeckel, R. 2018. Shared Autonomous Vehicles Effect on Vehicle-Km Traveled and Average Trip Duration. Journal of Advanced Transportation, 2018, pp. 1-10.
Motamedidehkordi, N., Margreiter, M. and Benz, T. 2016. Effects of Connected Highly Automated Vehicles on the Propagation of Congested Patterns on Freeways. Transportation Research Board 95th Annual Meeting Washington DC, United States.
10 Muriel, B. and Algers, S. 2002. SAMPERS—The New Swedish National Travel Demand Forecasting Tool. National Transport Models.
Springer.
Ntousakis, I. A., Nikolos, I. K. and Papageorgiou, M. On Microscopic Modelling of Adaptive Cruise Control Systems. Transportation Research Procedia, 2015. pp. 111-127.
Olstam, J., Johansson, F., Liu, C., Pereira, I., Fléchon, C., Dahl, A., Burghout, W. and Thiebaut, R. 2019. Definitions of performance metrics and qualitative indicators. Deliverable 3.2 of the CoEXist project.
Rajamani, R., Levinson, D., Michalopoulos, P., Wang, J., Santhanakrishnan, K. and Zou, X. 2005. Adaptive Cruise Control System and its impact on traffic flow, CTS 05-01. Minnesota: Center for Transportation Studies, University of Minnesota.
Ramböll 2017. Teknisk PM – Uppdatering av Centrum modell. (Technical report - Update on the cener model, in Swedish). Malmö. Sae International. 2016. Taxonomy and Definitions for Terms Related to Driving Automation Systems for On-Road Motor Vehicles, J3016.
Sae International. https://www.sae.org/standards/content/j3016_201401.
Sonnleitner, J. and Friedrich, M. 2018. AV-ready macroscopic modelling tool. Deliverable 2.7 of the CoEXist project. https://www.h2020-coexist.eu/wp-content/uploads/2018/11/D2.7-AV-ready-macroscopic-modelling-tool.pdf.
Sukennik, P. 2018. Micro-simulation guide for automated vehicles. Deliverable 2.5 of the CoEXist project. https://www.h2020-coexist.eu/wp-content/uploads/2018/11/D2.5-Micro-simulation-guide-for-automated-vehicles.pdf
Talebpour, A. and Mahmassani, H. S. 2016. Influence of connected and autonomous vehicles on traffic flow stability and throughput. Transportation Research Part C: Emerging Technologies, 71, pp. 143-163.
Wagner, P. 2016. Traffic Control and Traffic Management in a Transportation System with Autonomous Vehicles. In: AL., M. M. E. (ed.) Autonomous Driving,.
Van Arem, B., Van Driel, C. J. G. and Visser, R. 2006. The impact of cooperative adaptive cruise control on traffic-flow characteristics. IEEE Transactions on Intelligent Transportation Systems, 7, pp. 429-436.
Van Driel, C. J. G. and Van Arem, B. 2010. The Impact of a Congestion Assistant on Traffic Flow Efficiency and Safety in Congested Traffic Caused by a Lane Drop. Journal of Intelligent Transportation Systems, 14, pp. 197-208.
Vanderwerf, J., Shladover, S. E., Miller, M. A. and Kourjanskaia, N. 2002. Effects of adaptive cruise control systems on highway traffic flow capacity. Transportation Research Record, pp. 78-84.