Executive Compensation and
Firm Performance in Sweden
Bachelor Thesis in Business Administration
Authors: Martin Grahn and Mattias Högfeldt Tutors: Johan Eklund, PhD
Louise Nordtröm, PhD Candidate
Acknowledgements
We would first of all like to thank our tutors, Johan Eklund and Louise Nordström for their help and their important ideas throughout our study. We will also like to thank to Peter Karlsson and Janne Köll at Handelsbanken Capital Markets for their support with data and their guidelines.
Martin Grahn Mattias Högfeldt
Bachelor Thesis in Business Administration
Title: Executive Compensation and Firm Performance in Sweden
Authors: Martin Grahn
Mattias Högfeldt
Tutors: Johan Eklund, PhD
Louise Nordström, PhD Candidate
Date: 2010-05-24
Subject terms: Executive compensation, OMX Stockholm large and mid cap
Abstract
The results obtained from this research indicates that there is no statistical relation between the chosen financial variables and the total compensation to the CEO, except sales.
CEO compensation is a highly debated subject in Sweden. The debate concerns whether or not CEOs are paid too much in relation to their results. This research investigates what decides the CEO compensation. Can the CEO compensation be explained by the financial variables ROA, ROE, Sales, Tobin’s q, and the size of the largest shareholder?
In this paper companies listed on the Swedish Stock Exchange OMX Stockholm large and mid cap during the years 2003 to 2008 are analyzed by empirically and theoretically adapted models.
Table of Contents
1
Introduction and Research Problems ... 1
1.1 Background ... 1
1.2 Problem Discussion... 1
1.3 Purpose ... 2
1.4 Scope and Delimitations ... 2
2
Theoretical Framework ... 3
2.1 Corporate Governance ... 3
2.2 The Principal Agent Theory ... 4
3
Method, Data and Variables ... 9
3.1 General Method ... 9 3.2 Data Collection ... 9 3.3 Tobin’s Q ... 11 3.4 Return on Assets ... 12 3.5 Return on Equity ... 12 3.6 Cash Flow ... 13
3.7 Sales and Compensation ... 14
3.8 Reliability, Replication and Validity ... 14
3.9 Criticism of the Sources ... 15
3.10 Criticism of the Methodology ... 15
3.11 Fall Offs ... 16
3.12 Hypotheses ... 16
4
Empirics, Results and Analysis ... 17
4.1 The CEO Compensation ... 17
4.2 Analysis ... 22
4.3 Further Analysis ... 23
5
Conclusion ... 25
6
Discussion ... 26
6.1 Suggestions for further studies ... 27
7
References ... 28
Appendix 1
Appendix 1 ... i1 Introduction and Research Problems
1.1
Background
In Sweden there is a debate whether CEOs receive too high of a compensation compared to their results. The two major players in this debate are shareholders and the media. There are several different opinions amongst these players regarding the compensation to the CEO. Some stakeholders find the compensation to the CEO as sufficient and fair, whereas some stakeholders find it too high and not justified by financial performance. The highly debated question is, if the compensation to the CEO is well-earned? In other words, is the compensation justified by the company’s financial performance?
The ongoing discussion concerns the question if there is a measureable relation between firm performance and CEO compensation. To be able to measure if it is supportable that a person earns so much money we are going to measure different companies’ performance and the salaries of their CEOs. This is very interesting through the eyes of an investor and for other employees, since if it is not explainable through performance measures, maybe the compensation should be questioned. However, if there is a correlation between CEO total compensation and the performance of Swedish companies there could be reasons for investors not to doubt the compensation to the CEO.
Recently a few companies chose to discard the bonus systems in order to follow the stakeholders’ demands, among these were SAS and Swedbank (Svd and Realtid 2010). However, the trustworthiness for Swedish companies as a whole is large and especially for small and medium-sized firms. However, critics have been focusing on the largest companies and their compensations to the CEO (Bäckström 2006). Therefore it is interesting if performance of the company can explain CEO compensation.
1.2
Problem Discussion
The CEO compensation is unproblematic in most of the Swedish companies. Research has shown that the chief executives for stock listed companies in Sweden has levels of compensation, which does not differ highly from those of well-educated and qualified workers in general. However, in some cases the CEO compensation has been perceived as high and hard to explain.
Translated quote from Bäckström (2006).
The compensation to the CEO is a well-researched and explored subject. Previous studies within this subject have shown results arguing both that the total compensation received by the CEOs has a positive relation to the companies profitability but also that the relation is negative. Firth et al. (1995) and Miller (1995) found that there is no correlation between stock market performance and compensation of executives. In a study made in Korea by Kato, Kim, and Lee.
(2004), the authors found contrary to what Firth et al. and Miller have found, a significant statistical correlation between stock market performance and executive compensation. However, Andersson et al. (2000) argues that if the CEO obtains too much compensation, other employees and executives will demand higher salaries, which will harm the performance of the companies. Bebchuk and Grinstein (2005), which covers all the S&P 500 companies, found a positive correlation between the salary of the CEO and compensation to group executive committee. They also found a relation between firm performance and compensation to the CEO. Bäckström (2006) discusses that investors and shareholders are losing confidence for the companies because of the the increasing compensation to the executives. Since Bäckström argues that the compensations to the CEOs at the Swedish stock exchange are unexplainable, we found it interesting to see if there is a correlation or not.
1.3
Purpose
The purpose of this thesis is to empirically and theoretically investigate the relationship between compensation to the CEO and firm performance for companies in Sweden.
1.4
Scope and Delimitations
This study is covering companies listed on the Swedish stock exchange OMX Stockholm mid and large cap. On OMX Stockholm large cap there are 58 listed companies, and on mid cap there are 85 listed companies. These companies account for several different industries, and we have chosen to exclude companies within the investment and the financial sector. This is because their revenue is not accounted under turnover since it comes from interest rates. Therefore, we have chosen to make a sample of the listed companies on mid and large cap.
The period for the research is 2003 to 2008. We have chosen this period in order to receive a fair analysis because it accounts for both downturns and upturns in the Swedish economy. Thus, it is not biased towards the Swedish stock exchange and not limited by external factors, such as macroeconomic factors.
When accounting for the compensation received by the CEOs we have chosen to include both the base salary and the bonuses. These two variables form the total compensation. Total compensation is because we see it as the whole salary works as an incentive for the CEO and not just the bonuses and this is in line with how Bäckströms did the analysis (2006). However, we will not include pension payments. This is because the total compensation is supposed to reflect the efforts and performance made by the CEO. Options on deposit and paid out are not included in the analysis which is because it is very hard to calculate and account for.
2 Theoretical Framework
2.1
Corporate Governance
When the Annual General Meeting for the company takes place, the board should choose what principles and policies should apply for the compensation to the CEO and top management (Bäckström 2006). After this, they will decide a reasonable compensation according to Swedish code for corporate governance (svensk kod för bolagsstyrning (2008). The decision should be well motivated and show a clear purpose so the shareholders can understand the purpose and therefore make up their minds if it is reasonable. Bäckström (2006) argues that it is important that there are a clear purpose and a correlation with the compensation to the CEO. The author also argues that the performance of the company and how well the CEO satisfies the objectives should be what defines the compensation. The bonus system and the flexible part should have a clear definition of what needs to be done, have a specific goal to achieve this compensation and should not be in any case seen as a gift to the CEO. Furthermore, Bäckström (2006) discusses that it is important that the compensation is plausible and is based on factors that can create shareholder wealth and therefore create trust among shareholders, prospective investors and the general public. The compensation should work as an incentive to be able to get and keep the best executives and motivate them to perform at their best (Bäckström 2006). The compensation varies severely between companies, and this is because CEOs’ bargaining position, competence, job output and the performance of the company varies substantially. As can be seen in figure 1, the shareholders choose the board of directors to represent them during the Annual General Meeting. The board of directors decides the compensation to the CEO with the help of the committee.
Source: Made by authors
The CEO and the owners have opposed meanings how to compensate for the specific position in the principal agent theory. Their preferences are diversified, and sometimes their objectives are different too. Finkelstein and Hambrick (1988) argue in their article that if there are only weak owners in a company, CEOs may obtain more power to reach a higher compensation than is justified by market forces. In another article made by Hambrick and Finkelstein (1995) there is evidence showing that when there is a stronger owner, the compensation to the CEO is lower than when the ownership is more diffused. Furthermore, in companies where there is a strong owner incentive alignments are larger than in companies where the ownership is diversified (David et al. 1998).
In addition, it showed that the institutional investors have a strong effect on the compensation to the CEO. However it depended on the relationship with the companies. When companies had strong institutional investors the incentive based compensation was stronger, and the fixed income was weaker in respect to other companies without institutional investors (David et al. 1998).
2.2
The Principal Agent Theory
The Principal Agent Theory occurs as an issue when parties that are cooperating have different objectives and how to reach them. Agency theory is in particular directed to the omnipresent relationship of agency. This is when one party (the
Figure 1: How the CEO compensation is decided
Shareholders
Annual General Meeting
The Board of Directors
The CEO
principal) deputizes work to another (the agent), who then performs this work. (Eisenhardt, 1989) The problem can occur due to several factors. However, Jensen and Meckling (1976) argue that the problem can occur when the principal and the agent have different long-term intentions. Eisenhardt (1989) has quite a similar idea and discusses that the problem can occur when the principal and the agent have different opinions about riskiness. This leads to different attitudes to use a proper action because of different preferences according to risk.
In addition, Eisenhardt (1989) discusses the question on how to manage a corporation. Is it most plausible to use a behavior-oriented contract, which refers to salaries and hierarchical governance, or is it more efficient to use an outcome-oriented contract, which refers to commissions, bonuses, stock options and market governance? Jensen and Meckling (1976) argue that if the parties are both there to maximize their utility, there is a big risk that the agent will not make the actions that will benefit the principal the most. To be able to get the agent to work in the principal’s interest, the principal can create incentives to decrease the divergence. The principal can also create a monitoring system, which is developed to limit the disobedient behavior of the agent. The authors also argue that it is impossible to make the agent do the optimal decisions from the viewpoint of the principal without any extra costs. The authors list the three agency costs as the following:
• The monitoring expenditures by the principal • The bonding expenditures by the agent • The residual loss
In our research the principle corresponds to stockholders, and the agent is the CEO. In the chosen publicly listed companies there are many stockholders, and few of them are not part of the board. Instead, a member of the board, which is chosen by the stockholders, represents them. Furthermore, we have chosen to not look at monitoring costs. Instead, the focus has been on how incentives (by incentives we mean the total compensation to the CEO) affect the performance of the company in our research.
There has been research conducted by Bebchuk and Grinstein (2005) and Jensen and Murphy (1990), which indicates a significant positive relation between compensation to the CEO and firm performance.
However, there is research done by Firth et al. (1995) and Miller (1995) that contradict the Principal Agent theory by showing no correlation between compensation and performance.
There is also a theory called the Stewardship Theory, which argues that the CEO is not taking actions in order to maximize the person’s own utilization. Instead, the CEO is working in a trustworthy manner and is allegiant to the stockholders (Davis and Donaldson, 1991). This theory is in reality the opposite of the Principal Agent Theory.
The CEO obtains the motivation from doing a good job and being a steward of the corporate asset. Thus, it assumes that there is no conflict of interest between the principal and agent and that the CEO wants to perform in the same way as the
principals have set their objectives. The issues are therefore not in different interests between the agent and the principal. Instead, the issues occur within the organizational structure. The structure of the company is an important part of how well the CEO can organize and implement the intended plans to create high corporate performance (Davis and Donaldson, 1991). Thus, according to the Stewardship theory, there is no need to monitor or control the CEO by using different techniques, for instance, bonuses. Furthermore, the authors are arguing that the company will perform better if the CEO has a more independent role since that is the person who knows the company best (Jensen and Meckling, 1976). In the table below one can see an overview about the agency theory.
Table 1: Agency Theory Overview by Eisenhardt
Key idea: Principal-agent relationships should reflect efficient organization of information and risk-bearing costs
Unit of analysis: Contract between principal and agent
Human assumptions: Self-interest, Bounded rationality, Risk aversion Organizational assumptions: Partial goal conflict among participants,
Efficiency as the effectiveness criterion, Information asymmetry between principal and agent
Information assumption: Information as a purchasable commodity Contracting Problems: Agency (moral hazard and adverse problems
selection), Risk sharing
Problem domain: Relationships in which the principal and agent have partly differing goals and risk preferences (e.g., compensation, regulation, leadership, impression management, whistle blowing, vertical integration, transfer pricing)
Source: Eisenhardt (1989)
The Principal Agent Theory is a large theory, which contains several other theories extending the Princiapal Agent Theory in various ways. Bebchuk and Fried (2003) argue that the CEO has an influence over the board and therefore make the directors accept the CEO payment as long as the payment is plausible and can be defended. A second reason is that the CEO can affect the director’s compensation and perks. Bebchuk and Grinstein (2006) show evidence that The Arm’s Length Bargaining Model and The Managerial Power Model are theories that can best explain the strong increases of the CEO payment. The Arm’s Length Bargaining Model explains that directors are trying to find the best executive for the company in order to be able to generate shareholder wealth, and executives are selling their
specialized services in management (Bebchuk and Grinstein 2006). A model for this can be explained by a simple supply and demand curve for any good. Bebchuk and Grinstein (2006) stated three reasons for how the increases in compensation occur in a Bull Market.
• The demand curve shifts when the demand for executives changes and therefore executives need more money.
• The boom makes the executives better compensated leading to a decrease in supply since executives no longer want to work. To keep them working compensation increases. • During booms more work is required and therefore
compensation increases.
The Managerial Power Model is focusing on that directors are not taking actions that will profit the shareholders interest and therefore are willing to give larger compensations to the executives that have a more beneficial impact on the executives than on the shareholders. This theory usually means that the directors are fooling the shareholders. Furthermore, by giving an executive equity in the company the shareholders becomes only more fooled by thinking that the executives will act in their interest. However this is just a justification for escalating the compensation to the executives even more (Bebchuk and Grinstein 2005).
Lambert, R. A., Larcker, D. F., Weigelt, K (1993) are in line with Bebchuk and Grinstein discussion about the Managerial Power Model. According to them, the power the executive possesses increases the influence the person has over the board of directors or the compensation committee. The more power the CEO posesses the higher the compensation. Furthermore, the authors are arguing that the CEOs can accumulate power by using their own personal wealth to increase their equity ownership. By increasing their equity they can influence the selection of the board members. These equity holdings of the CEO become extra strong when external parties have weak ownership interests. The CEO can nominate individuals to the board that the CEO thinks are “loyal” to him or her (Lambert et al. 1993). Irrespective of where the power rises from, the managerial power model formulates a positive relation between the power of the CEO and the size of the compensation. By discussing this theory, there is another reason to include how large the biggest ownership in the respective ccompanies is. Since when the external owners are weak the Chief executive officer’s compensation will be higher, according to the managerial power model.
Both the Arm’s length bargaining model and the managerial power model are two models describing how the total compensation is decided upon and what different aspects they encapsulate. Murphy (1999) found that the compensation to the CEO is related to the size of the corporation. Bebchuk and Grinstein (2005) found a positive correlation between the salary of the CEO and payouts to group executive committee. They also found that an increase in the compensation to the CEO was related to the firm’s turnover, ROA and stock return. However, Mäkinen (2007)
found that there was no relation between the total compensation received by the CEO and ROA. Oxelheim et al. (2009) found a strong relation between Tobin’s q and the compensation to the CEO in terms of the received bonus.
Previous research has shown different results regarding different variables’ relation towards the total compensation of the CEO. However, one variable that seems to be positively related throughout the different investigations is the size of the corporation.
3
Method, Data and Variables
3.1
General Method
The methodology mostly builds on already established financial instruments. These instruments will work as the foundation of our research in order to detect the relationship between total compensation and company performance.
The choice of method is characterized by the deductive approach because these financial instruments work as the theories and tools to support or reject the hypothesis we have created. The research will start with a theory that there is a positive relation between total compensation received by the CEO and the financial performance of the company. This theory will be tested when using the financial instruments as already existing theories to test the hypotheses. The inductive approach is also an alternative way of conducting the research, if we are creating a theory after analyzing the results from the study (socialresearchmethods 2006). However, the deductive approach is the one that will characterize our investigation.
3.2
Data Collection
In order to be able to analyze and find a relation, there are several important variables that need to be retrieved so that the financial instruments will become applicable. These important numbers and variables will be gathered from respective company’s annual report, which in turn can be retrieved from the corporations’ web pages. In order to be able to analyze and find support for the relation, annual reports ranging from the consecutive years 2003 to 2008 have been gathered for each of the companies. The numbers have also been gathered from Svenska Handelsbanken’s database, which also has based their information from annual reports.
From the annual reports and the database, key variables and numbers have been assembled and compiled in an excel document so the different financial ratios could be calculated. Then the data was assembled to a pooled panel data, which also was adjusted for some extreme values.
When choosing the total compensation, we have decided to exclude options on deposit and paid out to the CEO. We also chose to exclude termination wage since Bäckström (2006) argues that it is the compensation paid out during the active career that is the important incentive for CEOs. An exclusion has also been made with social fees since it is not compensation to the CEO. It is a fee to the state which is in line with a study made by Bebchuk and Grinstein (2005) that also excluded social fees. We also chose to exclude extra benefits as car benefits etc. In figure 2 one can see how we have composed the total compensation. However, the numbers have not been adjusted for inflation.
Figure 4.1: Total Compensation to CEO
The Total Compensation
Fixed income - Base Salary Flexible income - Bonus Excluded income - Options - Termination wage - Social fees - Extra benefits
Source: Made by authors
The data set consists of a panel of 428 to 448 observations. Dougherty (2002) argues that research made with the use of time series implies that one variable is tested several times within the same time interval. According to Dougherty, Panel data is a mix of cross-sectional and time series data. In our study we will be using panel data since we will test the total compensation to the CEO to several variables during the years 2003-2008, which therefore becomes multidimensional.
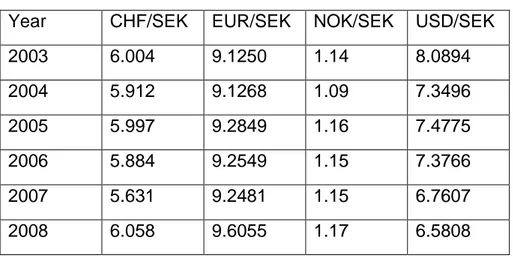
The study is done with a quantitative method of research since we have mainly gathered our information data from annual reports and databases. The gathered data comes from annual reports and are secondary data, which is compensation to the CEO, assets and earnings before interest, equity and market value. From Handelsbanken’s database, debt, cash flow and revenues have been retrieved. Most of the companies’ annual reports where the gathered information havs been taken from have declared their numbers in Swedish Krona. However, some of the chosen companies declare their information in other currencies, which are EURO, NOK, USD, and CHF. We will use the average exchange rate each year from Riksbanken, which we have obtained from Riksbanken’s website and converted all numbers to SEK. We have chosen to declare in SEK since it is the Swedish currency, and this is a Swedish study and most of the gathered information is already in SEK.
In Table 2 it is declared which average exchange rate is used for each year. Base
Salary
Bonus
Excluded income
Source: Made by authors with numbers gathered from Riksbanken 2010
3.3
Tobin’s Q
James Tobin developed a ratio called Tobin’s q Ratio, which purpose is to compare the total market value of a company with its total asset value.
The ratio shows if a firms stock is more expensive than the replacement cost of its assets. The use of including debt is because companies can have big debts and therefore it can affect a company in a severe way without being seen in Tobin’s q. If q is between 0-1 the stock is undervalued. When q is greater than 1 the stock is overvalued. Tobin’s q plays an important role in many different financial interactions. The ratio is used to help explain several different phenomena regarding investment decisions (H. Chung and W.Pruitt 1994).
The more attractive the CEO makes the company, the more attractive the stock will become. According to Bond et al. (2004) Tobin’s q encapsulates all the important information regarding expected profitability of investment. L. Lang et al (1996) concludes that there is a negative relation between leverage and growth for corporations with a low Tobin’s q, but this relation does not hold for firms with high Tobin’s q. This means accordingly to the author last mentioned that the leverage does not have a negative impact in companies with good investment opportunities. However, it has a negative relation for firms with a large debt in their financial account.
Furthermore, Bond et al. (2004) argue in their article that by looking at Tobin’s q one can see a strong evidence for investment opportunities in companies. However the authors also discuss the weakness of Tobin’s q when there is a financial bubble.
Year CHF/SEK EUR/SEK NOK/SEK USD/SEK 2003 6.004 9.1250 1.14 8.0894 2004 5.912 9.1268 1.09 7.3496 2005 5.997 9.2849 1.16 7.4775 2006 5.884 9.2549 1.15 7.3766 2007 5.631 9.2481 1.15 6.7607 2008 6.058 9.6055 1.17 6.5808
They argue that there is a need for more financial ratios and information to rely on when analyzing the data.
Tobin’s q
Number of shares x Share price + Debt Average total assets
3.4
Return on Assets
This ratio is important because it paints a clear picture of what a company can do with available resources.
The ratio can be calculated with the following equation; net income divided by average total assets. This is the chosen way to calculate because total average assets is covering more of the whole year than just using total assets in the final annual report.
In a study conducted by Bebchuk and Grinstein, (2005) they used ROA and past return to control for CEO performance. This is very helpful in order to fulfill our purpose because well-known economists have used this ratio for similar purposes in the past. This ratio will very clearly help to detect whether or not the performance made by the chief executive officer has been of importance to the company’s financial situation and progress. Furthermore, Bebchuk and Grinstein (2005) argue that there is a correlation between total compensation to the CEO and increases in the company’s turnover, return on assets and return on stocks. However, Mäkinen (2007) discusses the correlation between compensation and return on stocks but not the relation with return on assets.
Return on Assets (ROA) Net income Average total assets
3.5
Return on Equity
Return on Equity is an often used measure on how well a company performs. This ratio tells how well a company uses invested capital to generate earnings growth. It measures the rate of return on the shareholder’s equity of the common stock owners. This is important because the financial improvement of the firm is directly related to how well it is being managed by the chief executive officer. Therefore it makes a strong case to include in our research in order to fulfill the purpose. Lambert and Larcker (1987) argue that return on equity measures performance in bonus contracts, which implies that a good return on equity has a positive relation to bonus contracts, hence vice versa. The authors also argue that changes in return
Tobin’s q =
on equity are statistically related to cash compensation. However, in a research made by Chakravarthy (1986) of American firms the author did not find a significant relation between firms performing excellent and non-excellent when measuring return on equity. However, this research has been criticized by McGuire and Schneeweis (1983) “They have (1) scope for accounting manipulation; (2) undervaluation of assets; (3) distortions due to depreciation policies, inventory valuation and treatment of certain revenue and expenditure items; (4) differences in methods of consolidating accounts; and (5) differences due to lack of standardization in international accounting conventions.” Thus, this is evidence that supports the need of more sources to evaluate financial performance.
I E. Brick et al. (2005) state in their article the hypothesis that what they call excessive compensation to the CEO is linked to poor performance of the firm. Thus, their hypothesis is the opposite of our hypothesis. We expect to see a correlation between how well compensated the CEO is and how well the company is performing. In the article, they expect to see a negative relation between firm performance and excessive compensation to the CEO, where the board of directors is also well compensated and there is an ongoing cronyism. Their findings also supported their hypothesis, which means that over compensation led to under performance.
In order to measure the financial performance we need to understand the variances of different ratios since there could be significant differences in prices of stocks. In the article: Explaining the Variance of Price-Dividend Ratios by John. H. Cochcrane (1992), the author is doing two volatility tests in order to answer the question: are prices to volatile? When we are developing our regression models we need to figure out whether it is plausible to use price per share or if it is too volatile to use. Since CEO total compensation is rather smooth it can be a problem by using a volatile number, which stock prices actually are, when we explore the financial situation through the eyes of any investor. However, for an investor the price is still of high importance.
Return on Equity (ROE) Net income
Average shareholders’ equity
3.6
Cash Flow
Jensen (1986) argues that there is a big issue when companies have substantial strong free cash flow. Managers and shareholders obtain different interest in payout policies. The author then argues that debt can many times replace paid out dividends and also how debt can reduce agency costs of free cash flow. Therefore a measure with Tobin’s q including debt is important but also to make a measure in cash flow when the analysis is developed. However, Dechow (1994) argues that cash flows are a more primitive form of measuring performance than earnings. Kaplan and Zingales (1997) found in their research that the least constrained
companies and the ones that performed best financially were companies that primarily relied on internal cash flow.
Cash Flow – measure
Net cash flow EBIT
3.7
Sales and Compensation
According to McGuire et al. (1962) Kostiuk (1990) compensation to the executives increases with firm size. This relation is relatively constant and has been stable over the years (Kostiuk 1990). Sales is also a measurement of size and performance of a company, thus we have chosen to include this variable in our analysis of the data.
Sales growth
t – t -1 t -1 Sales
When deciding on what different variables to include in the different formulas in order to retrieve the most suited result, we have used different sources of information. Allen, Myers and Brealey (2008) presented several formulas, which we have used in consultancy with Peter Karlsson and Janne Köll at Handelsbanken capital markets. We have also consulted with our tutor Johan Eklund on Tobin’s q.
3.8
Reliability, Replication and Validity
It is important that the same result will show up even if this study was made another time. Bryman and Bell (2005) argue that the three most vital criteria for doing research are reliability, replication and validity. Reliability measures how trustworthy the result of this study is. This study has a high reliability since the information is gathered from annual reports. Since these annual reports have been published and reviewed by external people, one can see them as trustworthy sources. Handelsbanken’s database is also a reliable source since the information is gathered from annual reports from the chosen companies and is used by one of the biggest companies in Sweden with a commercial purpose.
Sales growth=
Sales2
Replication is how easy it is to remake this research (Bryman and Bell, 2005). Since our information is gathered mainly from publicly accessible sources, we find it possible to replicate our study without issues. However, even though all information is not gathered from only publicly available sources the same numbers can be found at public sources. In addition, how we have conducted the reserach is well described, the regressions is detaily described and all the needed information is included in the appendixes.
There are different criteria for validity when it comes to conducting research. According to Bryman and Bell (2005), the most important criteria to have in mind when conducting a quantitative research is that the measure reflects what is going to be measured. Because the total compensation received by the CEO reflects on the firm’s financial performance we believe that total compensation measures what we want to investigate.
3.9
Criticism of the Sources
We consider our sources as reliable since the information is gathered from annual reports that have been reviewed by external people and is also regimented by IAS/IFRS and Svensk kod för bolagsstyrning. Handelsbanken’s database is secondary sources since they have gathered information from the annual reports and published them.
However, manipulation, errors and mistakes can occur in the annual reports and lead to errors in our calculations. Yet since we gathered a quite big amount of data this will probably not have a large impact on our calculations. The gathered information regarding the exchange rate is from Riksbanken and is therefore a trustworthy source, but mistakes can occur even there.
Due to the fact that we have used a lot of different sources with a variety of perspectives, we believe that we have reached a strong objectivity. Most of the sources have been referred and cited by many other authors and researchers. This increases the reliability of this study. The use of theories is well known and well used and is still used by a variety of researchers.
3.10 Criticism of the Methodology
There are reasons to believe that the results would differ if we included industry codes and used dummy variables to be able to analyze these industries. However, there are too few companies in our data set in order to include industry codes and therefore it is not measurably sufficient.
Thus, we suggest if one will do a similar analysis, to make a larger data set so it is possible to have several companies in every industry. However, it will be quite hard if one will only use listed companies in a certain size on the Swedish market.
3.11 Fall Offs
The data has been gathered from annual reports, Handelsbanken’s database. There has been some data that has not been available. It has happened when the companies do not declare separately between the board fees and the chief executive salaries. Some companies did not have all the annual reports needed available for the older years and the data has therefore a few partial fall offs. However, since the research has been made with a relatively big data set, which includes many years and several companies, this will not severely affect the analysis and conclusion.
3.12 Hypotheses
Hypothesis 1: There is a positive relation between ROE and total compensation to the CEO.
Hypothesis 2: There is a positive relation between sales and the total compensation received by the CEO.
Hypothesis 3: There is a positive relation between Tobin’s Q and the compensation to the CEO.
Hypothesis 4: There is a positive relation between Cash flow and the total compensation to the CEO.
Hypothesis 5: There is a positive relation between weak ownership and high compensation to the CEO.
Table 5.1: The development of the CEO compensation
4
Empirics, Results and Analysis
4.1
The CEO Compensation
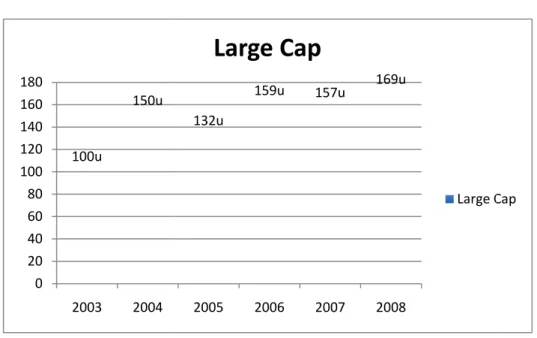
The table below shows the increases in the CEO compensation between the years 2003-2008, where 2003 is chosen as the base years and the reference point. There is an increase in large cap until 2008. However the increases are not stable. The increases are not deducted for inflation.
In table 5.2 there is a quite fitful increase of the compensation to the CEO for companies listed on mid cap. One can see that there is a large increase between the years 2004 and 2005. 2003 is chosen as the reference point. The numbers are not adjusted for inflation.
100u 150u 0 20 40 60 80 100 120 140 160 180 2003 2004
Note: 2003 is the base year with 100u and u corresponds to units.
Table 5.1: The development of the CEO compensation
Empirics, Results and Analysis
The CEO Compensation
The table below shows the increases in the CEO compensation between the years 2008, where 2003 is chosen as the base years and the reference point. There is an increase in large cap until 2008. However the increases are not stable. The
ot deducted for inflation.
In table 5.2 there is a quite fitful increase of the compensation to the CEO for listed on mid cap. One can see that there is a large increase between the years 2004 and 2005. 2003 is chosen as the reference point. The numbers are not adjusted for inflation.
132u
159u 157u 169u
2005 2006 2007 2008
Large Cap
Large Cap
Note: 2003 is the base year with 100u and u corresponds to
The table below shows the increases in the CEO compensation between the years 2008, where 2003 is chosen as the base years and the reference point. There is an increase in large cap until 2008. However the increases are not stable. The
In table 5.2 there is a quite fitful increase of the compensation to the CEO for listed on mid cap. One can see that there is a large increase between the years 2004 and 2005. 2003 is chosen as the reference point. The numbers are
Table 5.2: The development of the CEO Compensation
Table 5.3: The development of the CEO Compensation
Table 5.4: Descriptive Statistics
Note: u corresponds to units and 2003 is the base year
In table 5.3 one can see that there is a more stable increase in the total compensation when a comparison is made with both companies listed on large and mid cap. Even though the stock market went
increases of CEO compensation continued to increase. 2003 is chosen as the reference point. 100u 107u 0 20 40 60 80 100 120 140 160 180 2003 2004 100u 136u 0 20 40 60 80 100 120 140 160 180 2003 2004
Note: u correponds to units, with year 2003 as the index year.
Table 5.2: The development of the CEO Compensation
Table 5.3: The development of the CEO Compensation
Table 5.4: Descriptive Statistics
to units and 2003 is the base year
n table 5.3 one can see that there is a more stable increase in the total compensation when a comparison is made with both companies listed on large and mid cap. Even though the stock market went down during the recession, the increases of CEO compensation continued to increase. 2003 is chosen as the
148u 131u 143u 158u 2005 2006 2007 2008
Mid Cap
Mid Cap138u 148u 148u
158u
2005 2006 2007 2008
Large & Mid Cap
Large & Mid Cap correponds to units, with year 2003 as the index year.
n table 5.3 one can see that there is a more stable increase in the total compensation when a comparison is made with both companies listed on large and down during the recession, the increases of CEO compensation continued to increase. 2003 is chosen as the
Mid Cap
The descriptive statistics of all variables in the data set is presented in table 5.4. As one can see, there is a large difference between the minimum and the maximum value regarding ROA and ROE. As one can see both ROA and ROE had negative values. This can be due to that the data set includes one year when the Swedish economy faced a recession and when the whole stock market together faced a downturn. However, both of their mean values are positive with relative good numbers. Furthermore, Tobin’s q had a r
large maximum value. However, the mean value is stable. Cash flow through EBIT has a large difference between the minimum and the maximum value. Sales growth is interesting to look at due to the large difference bet
maximum value, -92.5% and 181% respectively together with a relatively low mean value. The large difference between those two numbers can perhaps be explained in a similar fashion as the relationship with ROA and ROE. The large difference between the minimum and the maximum value regarding Sales and Sales2 can be explained by that co
compared to companies listed on the large cap. There is a large difference between the compensation to the CEOs. T
companies are relatively small compared to the largest companies in Sweden listed on the stock exchange.
Table 5.4: Descriptive Statistics
The descriptive statistics of all variables in the data set is presented in table 5.4. As one can see, there is a large difference between the minimum and the maximum value regarding ROA and ROE. As one can see both ROA and ROE had negative n be due to that the data set includes one year when the Swedish economy faced a recession and when the whole stock market together faced a downturn. However, both of their mean values are positive with relative good numbers. Furthermore, Tobin’s q had a relative low minimum value but a relative large maximum value. However, the mean value is stable. Cash flow through EBIT has a large difference between the minimum and the maximum value. Sales growth is interesting to look at due to the large difference between the minimum and 92.5% and 181% respectively together with a relatively low mean value. The large difference between those two numbers can perhaps be explained in a similar fashion as the relationship with ROA and ROE. The large ence between the minimum and the maximum value regarding Sales and
can be explained by that companies on mid cap have a lower
compared to companies listed on the large cap. There is a large difference between the compensation to the CEOs. This can be explained by that some of the companies are relatively small compared to the largest companies in Sweden listed on the stock exchange.
Table 5.4: Descriptive Statistics
The descriptive statistics of all variables in the data set is presented in table 5.4. As one can see, there is a large difference between the minimum and the maximum value regarding ROA and ROE. As one can see both ROA and ROE had negative n be due to that the data set includes one year when the Swedish economy faced a recession and when the whole stock market together faced a downturn. However, both of their mean values are positive with relative good elative low minimum value but a relative large maximum value. However, the mean value is stable. Cash flow through EBIT has a large difference between the minimum and the maximum value. Sales growth ween the minimum and 92.5% and 181% respectively together with a relatively low mean value. The large difference between those two numbers can perhaps be explained in a similar fashion as the relationship with ROA and ROE. The large ence between the minimum and the maximum value regarding Sales and mpanies on mid cap have a lower revenue compared to companies listed on the large cap. There is a large difference between his can be explained by that some of the companies are relatively small compared to the largest companies in Sweden listed
Table 5.5: Simple Linear Regression
Table 5.6: Correlation
Note: *** p<0.01, **p<0.05, * p<0.1
In table 5.5 the results are shown from the regression, which investigates if there is a relation between large shareholders and the total compensation to the CEO. However, the table shows that there is no statistical evidence to support this theory. There are also no
mean value of the total compensati
Table 5.5: Simple Linear Regression – Largest Shareholder
: Correlation
Note: *** p<0.01, **p<0.05, * p<0.1
the results are shown from the regression, which investigates if there is a relation between large shareholders and the total compensation to the CEO. However, the table shows that there is no statistical evidence to support this theory. There are also no strong correlations between large shareholders and the mean value of the total compensation, which is shown in table 5.6
Largest Shareholder
the results are shown from the regression, which investigates if there is a relation between large shareholders and the total compensation to the CEO. However, the table shows that there is no statistical evidence to support this strong correlations between large shareholders and the
Table 5.7: Multiple Regression
Note: *** p<0.01, **p<0.05, * p<0.1 statistics is declared below the paranthesis
Table 5.7 shows the results from the multiple regression, which of the measurement variables
CEO. The table also declares for how robust the regression is. One can see that the only significant value in the whole regression.
measurement variables do change when new variables are added to the regression.
Table 5.7: Multiple Regression – All Predictor Varables
Note: *** p<0.01, **p<0.05, * p<0.1: coefficient in paranthesis and t-statistics is declared below the paranthesis
shows the results from the multiple regression, which
measurement variables, affected the total compensation received by the able also declares for how robust the regression is. One can see that
value in the whole regression. Overall, the table shows that the measurement variables do change when new variables are added to the shows the results from the multiple regression, which investigated if all affected the total compensation received by the able also declares for how robust the regression is. One can see that SS is Overall, the table shows that the measurement variables do change when new variables are added to the
4.2
Analysis
In hypothesis 1 we claimed that there is a positive relation between ROE and total compensation to the CEO. This claim is supported by earlier studies done by Jensen and Murphy (1990) and Bebchuk and Grinstein (2005), where they found a correlation between how well the company performs and total compensation to the CEO. Yet this Hypothesis is not supported in Mäkinen’s (2007) research. However, the principal agent theory supports a relation between ROE and total compensation since it tells that financial performance of a company affects the compensation to the CEO. Several companies state in their annual reports how the compensation is decided and in many cases they are partially based on performance. Thus, a found relation can probably be explained by the different incentive programs created by these companies.
In table 5.7 our regression results for hypothesis 1 is shown. The findings from the regression do not indicate that ROE affects the total compensation to the CEO. The t-value is too low in order to be statistically significant, which results in that this hypothesis is rejected.
We chose not to include ROA together with ROE, due to that those two variables have a too high correlation, which can be seen in appendix 1. However, both of them are performance measures, which are very similar. In order to be sure that ROA was not significantly related to total compensation, we conducted a single linear regression that showed no relation between the variables.
The findings can however be supported by other researchers, Firth et al. (1995) and Miller (1995) who contradict the Principal Agent theory where there was no correlation between compensation and performance. Furthermore, there are other models supporting that there is no correlation between firm performance and compensation. The Managerial Power Model could support this rejection of the hypothesis.
In Hypothesis 2 we claim that the sales of the company affect the compensation to the CEO. This is in line with McGuire et al. (1962) and Kostiuk (1990) who argue that the compensation increases with the size of the firm.
The result shows no statistical significant correlation between sales growth and the compensation to the CEO (table 5.7). This contradicts McGuire’s (1962) and Kostiuk’s (1990) findings. However our result only includes sales growth from year to year and does not include a long-term growth.
This hypothesis also includes that there is a positive relation between sales and sales2 of the company and the total compensation received by the CEO.
The result can also be seen in table 5.7. There is a very strong statistical significant relation between sales and sales2 and the compensation to the CEO. This is supported by earlier findings by McGuire et al. (1962) and Kostiuk (1990). The positive relation between sales and sales2 and total compensation is logical. First of all, it is supported by earlier researchers and second, a larger company implies a larger responsibility for the CEO, which is in line with requirements of higher experience and thus, a higher salary.
Because sales growth has no significant relation to total compensation, but sales and sales2 did, the hypotheses is neither rejected nor accepted.
We claim in Hypothesis 3 that there is a positive relation between Tobin’s Q and the compensation to the CEO. The result shows no statistical significant correlation between the two variables (table 5.7). With no significant relation, this hypothesis is rejected. This contradicts the findings made by Oxelheim et al. (2009), where they found a relation between Tobin’s q and the compensation to the CEO. However, there are reasons to believe that the findings would be different if we could analyze the companies on an industry basis. Since, companies numbers differs widely between industries. For instance, the service sector mostly have lower total assets than what manufacturing firms have.
In hypothesis 4 we claim that there is a positive relation between cash flow and the total compensation to the CEO. However, as table 5.7 shows, no statistical relation between those two variables could be established, which is also supported by the correlation matrix in appendix 1, and therefore the hypothesis is rejected.
In Hypothesis 5 we claim that there is a positive relation between weak ownership and high compensation to the CEO. This is in line with earlier studies conducted by Bebchuk and Fried (2003), Bebchuk and Grinstein (2006), Lambert et al. (1993) where they indicate that the stronger power the executive possess, the higher the compensation will be. This power can be measured through weak diversified owners. Furthermore, these findings and discussions are well supported by the two models: the Arm’s Length Bargaining Model and the Managerial Power Model. The result from the regression (table 5.5) shows no indication of supporting the models and earlier studies done by the discussed researchers. The correlation also shows no significant correlation (table 5.6). Because neither a significant t-value nor a significant correlation can be seen, the hypothesis is rejected.
4.3
Further Analysis
As one could see through our regressions and hypotheses there is no relation between the financial performance of the company and the total compensation. Despite this fact and that we have included a year when the economy faced a recession, the compensation has quite steadily increased during the period of investigation (table 5.3). Furthermore, this cannot be explained by the inflation if one takes it into consideration.
Additionally, our findings can might be explained by the fact that the CEO actually is driven by an internal motivation and do not need more money to perform at its best. Thus, there is no conflict between the principal and the agent. The Arm’s Length Bargaining Model can be questioned in this case when the board is acting in the interest of the shareholders and is trying to find the best executive for the job and therefore gives the person a relative high compensation, since what the findings say is that the performance and compensation do not correlate.
The result can also be discussed through the Managerial Power Model where the board is setting the compensation to the CEO just in the interest of the CEO and themselves and not by the interest of the shareholders. One can argue for this since
the performance is not applicable to the compensation paid out to the CEO. The one who seems to benefit of the rejection of this hypothesis is the CEO and maybe the board who can take higher fees. This could also be in line with the findings of Brick et al. (2005) that a cronyism can affect over payment among board of directors and CEOs and lead to under performance. However, since we have not included options paid out and options in deposit, there is a chance that the numbers would be different than we have found out.
5
Conclusion
This paper has investigated the relationship between a firms’ financial performance and the total compensation received by the CEO. The research has discussed theories and analyzed data to see what decides the CEO compensation. The study included companies listed on the Swedish Stock Exchange OMX Stockholm large and mid cap during the years 2003 to 2008.
The results from the analysis only indicate that sales and sales2 is related to the total compensation. Obviously the compensation cannot be explained by our chosen financial factors, except sales and sales2,, which also were the measures that we expected to be most significant.
To conclude, we found that it is contradictory for companies to state in their annual reports that the CEO compensation is based on the financial performance of that company. This is because, as our research has shown, it is hard to explain the CEO compensation through the use of financial variables, as no statistical relation could be detected.
Therefore, our results are more in line with Firth. et al. (1995) and Miller (1995), which found no correlation between firm performance and total compensation. This contradicts the finding done by Bebchuk and Grinstein (2005) who found a correlation between firm performance and executive compensation. However, we have not included options paid out and in deposit, which maybe could have showed a different level of significance.
6
Discussion
The CEO compensation is unproblematic in most of the Swedish companies. Research has shown that the chief executives for stock listed companies in Sweden have levels of compensation, which do not differ highly from those of well-educated and qualified workers in general. However, in some cases the CEO compensation has been perceived as high and hard to explain.
Translated quote from Bäckström (2006).
It seems like the board of directors has drifted away from the interest of the shareholders since the compensation cannot possibly be based on financial performance according to our study. The Managerial Power Model can possibly explain the board of directors’ actions, when they are not acting in the interest of the shareholders. Instead they are acting to benefit themselves and the CEO. This could possibly be explained by an ongoing cronyism in many of the largest companies in Sweden, which Brick et al. (2005) also argued for in their article where companies performed worse when the CEO was ”excessive” compensated. However, it was not for the Swedish stock market. Yet it still shows how the compensation to the CEO can escalate in a similar market. Thus, our result is more in line with Firth. et al. (1995) and Miller (1995), which found no correlation between firm performance and total compensation. However, it is not in line with what many of the companies are stating in their annual reports, which is that the CEO compensation is based on the financial performance of the firm.
Furthermore, the shareholders have a limited possibility to affect the compensation to the CEO, especially in Sweden where shares are divided into A and B stocks. One could argue that it would be more in line to decrease the fixed salaries of the CEOs and increase the bonus system and consequently make it more important.
Perhaps one could argue that the Stewardship theory is suited when explaining why so few correlations were found. In other words, the CEO might be driven by self-efficacy and therefore a CEO with a lower compensation performs just as well as a CEO with a higher compensation. As we see it, there is no reason to have high fixed salaries through the perspective of an investor. Instead, one could increase the proportion of the bonuses and through that way increase the financial performance of the company.
As the quote from Bäckström (2006) says, we agree that the compensation in some cases are high and are hard to explain.
6.1
Suggestions for further studies
For people who wants to do research within this subject, it would be interesting to conduct a study that includes more companies. Thus, the researcher could probably make it possible to divide the companies into differentet industries. This could have been done by including companies from small cap as well. By doing this, different results might be obtained. Furthermore, one could include return on stocks as a measure together with ROA or ROE in order to see if there would be a strong relation. It would also be interesting to compare the Swedish stock exchange and the relation between financial performance and compensation to the CEO in other countries. If one has more time than we did, it would be very interesting if the researcher could include options in deposit and paid out in order to see if there would be a difference.
It could also be interesting to conduct a study that only involves the bonuses and see how those relate to the financial performance of the company and vice versa. Hence, one might see a stronger monetary relation with incentives.
7
References
Almgren, J. (2010). Swedbank slopar bonus, Retrieved April 19, 2010, from http://www.svd.se/naringsliv/nyheter/swedbank-slopar-bonus_4158051.svd
Allen. F, Myers. C.S and Brealey. A.R (2008). Principles of Corporate Finance, ninth edition. MC GrawHill
Andersson, D., Bystedt, E., Carleson, A., Fransson, A., and Törnström, O. (2000).
”Näringslivet ökar takten; en studie av inkomstutvecklingen för makteliten perioden 1950-2000”, LO-tidningen
Arditti F.D., (1967). ‘Risk and the required return on equity’ The Journal of Finance Balaji, S. Chakravarthy (1986). Measuring Strategic Performance. Strategic
Management Journal Vol. 7, No. 5 (Sep. - Oct., 1986), pp. 437-45
Bebchuk, L., Fried, J. (2003), ”Executive Compensation as an Agency Problem”, Journal of
Economic Perspectives 17 pp. 71-92
Bebchuk L., Grinstein Y. The Growth Of Executive Pay. (2005). Oxford Review of
Economic Policy, v.21 iss.2 pp. 283-303
Bond S., Klemm A., Newton-Smith, R., Syed M., Vlieghe G. (2004). ‘The roles of expected
profitability, Tobin’s Q and cash flow in econometric models of company investment.’ The
institute for fiscal studies
Boyd, B. K. Board Control and CEO Compensation. (1994). Strategic management
Journal, Vol. 5 pp. 335-344: John Wiley and Sons.
Brick I E., Palmon O, Wald, K. J.(2005).‘CEO Compensation, Director Compensation, and Firm Performance: Evidence of Cronyism’ Journal of Corporate Finance, Vol. 12 pp.
403-423
Bryman, Alan och Bell, Emma (2005). Företagsekonomiska forskningsmetoder, Liber Malmö
Bäckström, Urban (2006). ”Vägledning avseende ersättning”, Svenskt Näringsliv
Chakravarthy B.S (1986). Measuring Strategic Performance. Strategic Management
Journal, Vol.7, No. 5 pp. 437-458
Chung, K. H. and Pruitt S. W. (1994). A Simple Approximation of Tobin’s q. Financial
Management, Vol.23, No.3 Autumn 1994 pp 70-74.
Churchill G. A., Brown T. J. (2007). Basic Marketing Research, (sixth edition). Mason: Thomsom Higer Education
Cochcrane, J. H, (1992) Explaining the Variance of Price-Dividend Ratios. National Bureau of Economic Research (NBER)
David, P., Kochhar, R., Levitas E. (1998). The Effect of Institutional Investors on the Level and Mix of CEO Compensation The Academy of Management Journal, Vol. 41, No. 2, (1998). pp. 200-208
Davis, J. H. Donaldson, L. (1991). ”Stewardship Theory or Agency Theory: CEO Governance and Shareholder Returns”, Australian Journal of Management, 16, 1, June 1991, The University of New South Wales
Dechow, P. M. (1994) Accounting earnings and cash flows as measures of firm performance The role of accounting accruals, Journal of Accounting and Economics 18 (1994) pp. 3-42
Eisenhardt, K. M. (1989). "Agency Theory: An Assessment and Review," Academy of
Management Review 14(1) pp. 57-74.
Finkelstein, S., & Hambrick, D. C. (1988). Chief executive compensation: A synthesis and reconciliation. Strategic Management Journal, 9 pp. 543-558.
Firth, M., Lohne, J.C., Ropstad, R. och Sjö J. (1995). “Managerial Compensation in Norway”, Journal of Multinational Financial Management 5(2/3) pp. 87–101
Hambrick, D. C., & Finkelstein, S. (1995). The effects of ownership structure on conditions at the top: The case of CEO pay raises. Strategic Management Journal, 16 pp. 175-193.
Jensen M. C. (1986). Agency Costs of Free Cash Flow, Corporate Finance, and Takeovers, The American Economic Review, Vol. 76, No. 2, (1986), pp. 323-329
Jensen, M. C. and Meckling, W. H. (1976). ”Theory of the Firm: Managerial Behavior, Agency Costs and Ownership Structure” Journal of Financial Economics, October, 1976, V. 3, No. 4, pp. 305-360.
Jensen, M., Murphy, K. (1990). ”Performance Pay and Top-Management Incentives”, Journal of Political Economy 98 pp. 225–264.
Kaplan S. N. and Zingales L. (1997). Do Investment-Cash Flow Sensitivities Provide Useful Measures of Financing Constraints?. The Quarterly Journal of Economics, Vol.112, No. 1 (Feb.1997), pp.169-215
Kato T., Kim W., Lee J. H. (2004) ‘Executive Compensation and Firm Performance in
Korea’: School of Public Policy and Management
Kostiuk, P. F. (1990). Firm Size and Executive Compensation The Journal of Human
Resources, Vol. 25, No. 1 (Winter, 1990), pp. 90-105 University of Wisconsin Press
Lambert, R. A., Larcker D.F. (1987). An Analysis of the use of Accounting and market Measures of performance in Executive Compensation Contracts. Journal of Accounting
Research, (1987), Vol.25, pp. 85-125.
Lambert, R. A., Larcker, D. F., Weigelt, K (1993) The Structure of Organizational Incentives Administrative Science Quarterly, Vol. 38, No. 3 (Sep., 1993), pp. 438-461
Lang, L. Ofek E., Stulz, R. Leverage, investment, and firm growth. (1996). Journal of
Financial Economics, Vol.40 Issue.1 pp. 3-29.
McGuire, J. W., Chiu J. S. Y., Elbing A. O. Executive Incomes, Sales and Profits The
American Economic Review, Vol. 52, No. 4 (Sep., 1962), pp. 753-761
McGuire, J., Schneeweis, T. (1983) 'An analysis of alternate measures of strategic
performance.' Paper presented at the third Annual conference of the Strategic
Management Society, Paris.
Murphy, K. J. (1999), ”Executive Compensation”, In Handbook of Labor Economics,
edited by Orley Ashenfelter and DavidmCard. Vol. 3, bk. 2. New York: Elsevier
Murphy, K. J., Zábojník, J (2006) Managerial Capital and the Market for CEOs, Queen’s Economics Department Working Paper No. 1110
Murphy, K. J. (2002)Explaining executive compensation: Managerial power versus the Perceived Cost of Stock Options. The university of Chicago Law Review, 96,3 pg. 847 Oxelheim, L, Wihlborg, C., Zhang, J. (2009), ”Considering Macroeconomic Fluctuation in
Designing CEO Compensation Schemes” University of Göteborg
Riahi-belkaoui, A. Pavlik, E. Effects of Ownership Structure, Firm Performance, Sixe and Diversification Strategy on CEO Compensation: A Path Analysis (1993) Managerial
Finance, Vol. 19 Nr.2
Realtid, (2010, March). ”SAS slopar bonusar” Realtid. Retrieved April 19, 2010, from http://www.realtid.se/ArticlePages/201003/11/20100311073808_Realtid945/2010 0311073808_Realtid945.dbp.asp
Riksbanken (2010) ”Räntor och valutakurser” retrieved April 2, 2010, from http://www.riksbank.se/templates/stat.aspx?id=16745
Suit, D. B. (1984). Dummy Variables: Mechanics V. Interpretation The Review of
Economics and Statistics, Vol. 66, No. 1 (Feb., 1984), pp. 177-180 Svensk kod för bolagsstyrning (2008)
Trochim, W. (2006). Deduction and Induction;