Current and future shopping conditions in Sälen
48
0
0
Full text
(2) Abstract Going from having bought the most essential at the small shops close to home, better communications and an increasingly consumption oriented lifestyle has created a change in shopping behavior and has led to phenomenon such as shopping centres and more. These are constantly being built in Sweden: in the cities, outside the cities and more recently even in small cities -small cities as for one reason or another have access to a larger customer base which can have businesses to flourish economically. During the first decade of the 21st century, shopping centres have been established along the Swedish/Norwegian border. Since the Norwegian Krone is much stronger than the Swedish Krona Norwegians save a great deal of money on going to Sweden to shop. During the shopping trips to Sweden, it is mostly alcohol, meat, tobacco and candy that are being bought. However, other products such as clothing, technology, household appliances and more are also being purchased, all to save money on the trip. Together these cross border shoppers spent 11, 6 billion in Sweden during the year of 2010. This gives an average spending of approximately 10 900 SEK per cross border shopper on annual basis. Nordby, Töcksfors and Charlottenberg (small cities located in southwestern Sweden) are places characterized by Norwegian cross border shopping. Together, they generate billions every year and this only seems to increase. These places are relatively small in size but have prominent attributes such as proximity to the Norwegian border. Apart from these resorts and shopping centres, there are few or none similar places near the Norwegian border in the rest of Sweden. However, a place which is geographically well located and has a relatively large Norwegian and Swedish customer base is the ski resort of Sälen in west central of Sweden. Sälen is a village located near the Norwegian border, although fairly sparsely populated. The destination has annually about one million official guest nights, based on the 414 000 visitors who stay an average of about 4, 5 days. Per visit, these tourists individually spend an average of 862 SEK on shopping at the destination. The expenditure of the mountain tourists together with the Norwegian border shoppers makes it very interesting to explore the opportunities for shopping development in terms of a shopping centre in the region of Sälen..
(3) Table of contents 1. Introduction ........................................................................................................................ 1 1.1. 2. Aim and research questions ......................................................................................... 5. Theoretical Framework ...................................................................................................... 6 2.1. Cross border trade ........................................................................................................ 6. 2.2. Consumer behaviour and Consumption patterns ......................................................... 7. 2.2.1 Rational shopping behaviour ................................................................................ 8 2.2.2 Hedonistic shopping behaviour ............................................................................ 8 2.2.3 The value equation ............................................................................................... 9 2.3 Image enhancement and marketing of a place ........................................................... 11. 3. 4. 5. 2.4. Distance Decay .......................................................................................................... 12. 2.5. Central place theory ................................................................................................... 13. Method ............................................................................................................................. 16 3.1. Collection of data....................................................................................................... 17. 3.2. Assessment of the quality of data .............................................................................. 17. 3.3. Scope of study ........................................................................................................... 18. Cross border shopping between Norway and Sweden ..................................................... 19 4.1. Nordby, Töcksfors and Charlottenberg ..................................................................... 20. 4.2. Norwegians shopping in Sälen .................................................................................. 21. Mountain tourists shopping in Sweden ........................................................................... 26 5.1. 6. Tourist groups in Sälen .............................................................................................. 27. Analysis and Result .......................................................................................................... 30 6.1. Buying power of mountain tourists ........................................................................... 30. 6.2. Norwegian cross border shoppers buying power ...................................................... 30. 7. Discussion and Conclusion .............................................................................................. 34. 8. References ........................................................................................................................ 38.
(4) 1. Introduction. In the first chapter of this thesis we describe the background to the topic and the research questions chosen, this in order to create an understanding for the current characteristics of Sälen and the existing trade between Norway and Sweden. During the beginning of the 1940´s Europe was characterized by small neighborhood shops, in addition there were often some larger shops in the center of the cities. People were, within a small distance, able to buy what they needed and the shops were the ones deciding what people could buy. 1 The Second World War acted as a trigger for the commerce in Europe. Now the time of mass production and mass consumption had its start. At this time the power had been moved from the producers to the consumers, e.g. people were now increasingly able to demand products. 2 The consumers got access to cars and were thereby no longer confined to frequently visit the small neighborhood shops, now they could travel more often to the larger shops. Soon Europe was characterized by supermarkets, where the consumers were able to save time since these shops offered a greater range of products than small shops, e.g. consumers could buy everything needed within one and the same shop.3 Since the consumers became increasingly mobile through owning cars, the shops were able to buy cheap land outside the city and in this way the supermarkets became even more competitive by lowering prices.4 The smaller shops responded by gathering in one building in the cities’ peripheral areas, e.g. shopping centres were invented and now grew everywhere around the world.5 Trading in the rural areas has recently undergone major changes. In urban areas, commercial centres and shopping malls have been built with the result that they out-competed the smaller shops in rural areas. People who once shopped in these shops have become more mobile and thereby they see no major problems in traveling a longer distance to shops, also individuals working outside the city could stop at the shopping centres on their way to or back from work.. 1. Nylén (1997) Normann (1994) 3 Ibid 4 Ibid 5 Ibid 2. 1.
(5) In areas with larger shopping centres, the price of goods is often lower than in areas with fewer and smaller shops. In areas with bigger shops there are a greater range of products; customers can buy everything they need within one and the same shopping centre. Even if it is more common with shopping centres in connection to big cities there are also small cities where shopping centres have emerged. However, this has taken place at sites located in areas where people/customers like to travel to of one or more reasons. An example of this is the small city of Töcksfors in Sweden. Here, due to the proximity to the Norwegian border shopping centre has been built. The Swedish Krona is relatively weak against the Norwegian Krone with the result that Norwegians who choose to buy their groceries on the Swedish side of the border can save relatively large sums of money. It should be added that from the beginning it was the daily goods such as groceries that originally attracted parts of the Norwegian population to cross the border and shop in Sweden. Nowadays it is clothing, technological products and particularly alcohol and tobacco which are the most attractive commodities as these can be bought at a much lower price than in Norway. In other words, it is possible to build shopping centres or retail centres in rural areas as long as attractive product offers are made and there is a sufficiently large customer base in the hinterland area. Even if it is primarily shopping centres and their owners who earn the most money, the areas where the shopping centres are located also these benefit from the increased trade in the region. This might lead to reduced out- migration and instead result in a positive net migration. Municipalities benefits from increased trade in terms of tax revenues stemming from new jobs being created and also an improved service is on the up-side. Shopping and relations between suppliers and consumers are an ever changing procedure but there are people believing that electronic trade (Internet) will be dominant in the future.6 Other believes that shopping will increasingly become an experience and that consumer behavior will change from buying the things needed to become a hobby and a way to fill consumer leisure time.7 With constant development of technology and with that, greater and advanced experiences, people today do not solely go to shopping malls for the shopping itself. Nowadays one. 6 7. Mathews (1997) Lundblom (1997). 2.
(6) expects a joyful experience besides the actual purchase of products. This can be compared to car manufacturers who today not only build and sell cars, they produce services connected to the car purchase, such as: future oil changes, best warranty of all car salesmen, best comfort of all car brands and more.. 8. The same idea can be applied on shopping centres where the. customers demand good accessibility, large areas and spaces, a great variety of shops and products, superb personal service, short queues, attractive interior, welcoming atmosphere, good prices and more. Today, these are the conditions and areas in which the shopping centres have to compete.9 The establishments of shopping centres can also be seen as a factor in developing a destination into a blooming place with more people visiting, greater incomes, new work opportunities and higher turnover for the municipality.10 In terms of destination development, there are several factors to be handled, such as areas carrying capacity and its will to grow. The ones involved in destination development must ensure that local people (in this case the already existing businesses and inhabitants in the area of Sälen) through information and empowerment feel involved rather than anxious and hostile towards the development of the area.11 To understand what can contribute to a positive destination development, problems of joint action and efforts towards the same vision has to be acknowledged. Within destinations there are numerous wills and perceptions which need to be synchronized in order to reach a common purpose to strive for.12 The municipality of Malung-Sälen is located in the north-western part of the region of Dalarna. In December 2010 the municipality had 10 356 13 inhabitants spread over an area of 4100 sq kilometers.14 This gives that Malung-Sälen has about 2.4 inhabitants per sq km. OECD's criteria to be classified as rural are a population density less than 150 inhabitants per sq km. It then goes without saying that the Malung-Sälen Municipality falls into the rural category, but perhaps this situation would call for new categories being added to the OECD. 8. Gilmore & Pine (1997) McGoldrick (2002) 10 Evans, Fox & Johnson (1995) 11 Bohlin & Elbe (2007) 12 Gibson (2006) 13 Malung-Sälen Municipality (2011) [Electronic reference] 14 Ibid 9. 3.
(7) (the Organization for Economic Co-operation and Development) nomenclature which more readily identifies areas having a very low population density.15. In the year of 2010 the population of the Sälen Mountains was 2259. 16. people. Sälen village. offers basic services such as schools, a health centre, dental services and a pharmacy. There are also grocery shops, restaurants, a sport shop (Stadium) and Systembolaget. The area of Sälen is located close to the Norwegian border which means there is a potential for Norwegians to be part of customer base for the area of Sälen regarding development of shopping possibilities. The different ski resorts of Sälen are designed to meet the need of mountain tourist. There are grocery shops, retail shops where the visitors can buy for example skiing outfits (often more exclusive brands) and a number of restaurants in different price ranges. The attractions in the whole Sälen area consist primarily of ski slopes and snowmobile tracks.17 Sälen is probably best known for the ski race Vasaloppet and for its range of alpine skiing resorts. Sälen has a total of seven winter sports facilities namely Kläppen, Lindvallen, Tandådalen, Hundfjället, Högfjället, Stöten and Näsfjället. These are all located in connection to the village of Sälen.18 In the year of 2010, the whole mountain area of Sälen received approximately 223 827 visitors.19 These visitors mostly travel to Sälen by car or bus. However, a plan of building an airport close to the ski resorts of Sälen has recently been revealed.20 This could mean great opportunities to enhance both image and visitor numbers. Although this has not been decided upon yet, it must be taken into account for the future tourism in Sälen. Within a distance of 60 kilometers from Sälen the Norwegian ski resort Trysil is located. This destination has about 250 000 visitors. 21. per year and is a popular destination among. Norwegians.. 15. Glesbygdsverket [Electronic reference] Malung-Sälen Municipality (2011) 17 Skistar (2011) [Electronic reference] 18 Ibid 19 SCB (Number of reported official guest nights during 2010 divided with the average length of stay 1 005 719/4,493287= 223 827) 20 Expressen (2011) [Electronic reference] 21 Skistar (2011) [Electronic reference] 16. 4.
(8) Given these characteristics of an upcoming airport, proximity to the Norwegian border and the ski resort Trysil in combination with the number of visitors to the ski resorts, a development of shopping opportunities in Sälen is of interest for many, foremost local actors.. 1.1. Aim and research questions. On behalf of the County Administrative Board of Dalarna, this master's thesis will investigate the possibilities for commercial development with a primary focus on the potential for establishing a shopping centre in the area of Sälen. Our research questions can be stated as follows: . What are the characteristics of the existing supply of retail trade in the Sälen area today? How can this demand for shopping be portrayed in terms of volume and type? Is the potential customer base large enough for establishing a shopping centre in Sälen in the near future?. 5.
(9) 2. Theoretical Framework. This chapter intends to create an understanding for the essential theories used in our study and how these are used in a commercial context. The theoretical framework aims to provide the researcher with an understanding for the area that is to be explored. The purpose of this paper is as mentioned earlier, to analyze the possibilities for commercial development of a shopping centre in the Sälen area. It is then relevant to investigate how existing trade along the Norwegian has developed. Major such establishments are found near the border south of Sälen. In order to develop trade in one place, in this case Sälen, a number of factors has to be considered. Depending on the range of products, pricing, location and image it is possible to, through existing theories and studies calculate the size of a hinterland to Sälen. This would also include an assessemnt which target group is most likely to be attracted. Based on the purpose with this thesis, the most essential concepts and theories for our research are: Cross border trade, Consumer behavior and Consumption patterns, Image Enhancement and Marketing of places, Distance decay functions and Central Place theory. These concepts and theories will now be explained briefly in the following.. 2.1. Cross border trade. Between countries today, there may be considerable differences in price levels regarding products and services. The reasons for these differences are numerous, however some of them are more determinant than others like in differences in various taxes or protectionist schemes regarding industry and agriculture. Further reasons are the general price level, the monetary and competitive conditions as well as the topographical and climatic conditions.22 23 The trade across borders is mostly prominent in regions located in direct connection to neighboring country borders. Cross border trade most often occur in the foreign city and or. 22 23. HUI (2010) Lundén (2002). 6.
(10) market place nearest to one’s home.24 Most of the cross border trade is carried out during day visits.25 Products which differ in availability and price between countries create steps by the borders. These steps affect the trade flows and the consumers in the sense that the economically rational individual tends to act when earnings are in sight, e.g. the consumer compares prices on similar products available in different places. If a product is cheaper on the other side of the border the distance (travel cost) becomes the determinant for the consumer whether to take the trip or not. The cost and effort it takes to travel is reduced when purchases of larger quantities are possible.26. 2.2. Consumer behaviour and Consumption patterns. In order to understand individual’s consumption behavior it is appropriate to review the consumption process. Thus, consumption patterns n be seen as reflections of lifestyles in so far it shows the choice individuals make, the demand they exert and the priorities they exercise regarding products, time and money.27 Through choice of consumption, individuals are able to create a lifestyle and image in order to strengthen their identity.28 It is important to clarify relationships between place and consumption, i.e. the supply within the place vs. demand from the consumers. For example tourists, they are only able to control their consumption through choice of destination, interests and economic conditions. Non-tourists (permanent living people) have the opportunity to travel wherever they want (with regards to economic conditions) in order to buy the things needed, these people are not “chained to a destination” in the same way that tourists are.29 There are a vast number of concepts that could be included when explaining Consumer behaviour. These concepts look at the consumer as the cornerstone in the activities of. 24. HUI (2010) Timothy (2005) 26 Lundén (2002) 27 Solomon, Bamossy & Askegaard (1999) 28 Hanefors & Mossberg (2007) 29 Archer (1989) 25. 7.
(11) shopping. In terms of development of shopping centres, there are some concepts better suited to explain the consumer behaviour than others. Two examples of these are Rational - and Hedonistic shopping behaviours. 30 Also the Value Equation31 is suitable since it deals with different components with a positive and negative impact on the consumer, these components affects the consumer to make certain choices regarding place of shopping. 2.2.1 Rational shopping behaviour Rational shopping behaviour means that the consumer wants to achieve the same result in a shorter period of time.32 Today there is a continuous establishment of large shopping centres, with larger areas and more shops under the same roof. These shopping centres can satisfy the consumers´ different needs and demands. This enables the individual shops and chains to reach larger markets and target groups.33 Instead of small shops with few items, these large centres force the consumer to choose from a larger variety of products, thereby the competition between different product-labels are increasing as well. Based on the consumer’s preferences, the five resources of their buying process; money, information, time, distance and energy can be used as substitutes as well as complements to each other.34 2.2.2 Hedonistic shopping behaviour Although the rational view of shopping behaviour is widely used, today it is the hedonistic shopping behaviour that is in focus when discussing consumer behaviour.35 Instead of spot lightening the convenience of many shops gathered in one place, the hedonistic view focuses on the sensorial and emotional aspect of the buying process, the interaction between the consumer and the product36. The hedonistic view implies that except from the need of the actual product, the consumer is looking at shopping as an escape from everyday life and as an inspiration for change in their environment and or personality as well as a way of relaxation to unwind.37 It is emphasized that by engaging in shopping, the consumer meets new people and. 30. Solomon, Bamossy, Askegaard, & Hogg (2006) McGoldrick (2002) 32 Kaufman & Lane (1996) 33 Hultén (2007) 34 Kaufman & Lane (1996) 35 Frostling-Henningson (2002) 36 Solomon, Bamossy, Askegaard, & Hogg (2006) 37 McGoldrick (2002) 31. 8.
(12) that shopping is in fact more about the social interaction between the consumer and other individuals than it is about the product.38 2.2.3 The value equation The Value Equation, (in figure 1) is a model that shows positive and negative components that may affect the consumer’s choice of place to shop, which centre and product/label. In the upper half of the model, Plus, the factors that affect the consumer in a positive way is displayed and in the lower half, In Minus, the factors that affect the consumer in a negative way is displayed.39. Plus (More) Quality of product, Option/Availability, Opening hours, Service, Environment. Minus (Less) Money, Time, Effort, Stress, Risk. Figure :1 Reconstruction of the Value Equation after McGoldrick (2002). 2.2.3.1 Plus –Positive Factors Quality of product is important since this determines the experience and satisfaction of a consumer, this by fulfilling and hopefully overachieving its purpose regarding its durability and reliability together with other valuable attributes.40 Choices of Option and Availability are other important factors that affect the consumer’s choice of place to shop. If the shop has a variety of products, if it has the products of choice in stock and or if the shop is close by and easy accessible.41 38. Kim (2002) McGoldrick (2002) 40 Ibid 39. 9.
(13) Generous Opening Hours is also a factor that affects the consumer in a positive way since this creates a higher value in the experience and product. If competitive shops have better opening hours, the consumer chooses to shop there. However, opening hours are decided upon based on the merchandiser’s economic situation as well as which opening hours that are expected in a particular market.42 The Service is a crucial factor for the consumer’s choice of shopping place as well as for which product to buy. A good service and with that a well handled social interaction can reduce the Minus factors of stress, risk and time a great deal. Other factors that may affect the consumer are clean and nice restrooms, good parking areas and efficient ways of paying. 43 At last, a nice Environment is the most important deciding factor that affects the consumer’s choice of shopping place.44 The shop should be easy to move around in as well as having an appealing and up to date design.45 By fulfilling all of these factors, the consumer will hopefully be satisfied. 2.2.3.2 Minus- Negative Factors The first negative factor mentioned is Money. It is argued that money is the factor that most people have least of and are therefore very sensitive to differences in product price. Also, money spent on transportation and other costs concerning the shopping experience are crucial for most consumers’ choice of shopping place.46 Today it is argued that Time is greatest negative factor that affects the consumer’s choice of shopping place and or product. Since time cannot be stored or handed over it is more determinant than money regarding the consumer’s option of choice. Also, today people tend to take part in activities after work and on their leisure time more frequent than before, this makes time precious and opening hours of shops become crucial for the busy consumers.47 To what degree the consumer is facing factors of physical and mental Effort are important in the process of deciding which shop to go to or what product to buy. If there are a lot of stairs 41. McGoldrick (2002) Ibid 43 Ibid 44 Ibid 45 Armstrong & Kotler (2007) 46 McGoldrick (2002) 47 Kaufman & Lane (1996) 42. 10.
(14) or other physical obstacles on the way to the shop or if the weather conditions are adverse, these are all factors that may affect the consumer not to go or to buy another product. Besides this a badly structured shop or not enough cashiers may also affect the consumer in a negative way.48 Stress is a contributing factor that has changed over time. Formerly consumers were stressed by distraction in the shopping environment or surveillance cameras. Today people are educated, well informed and secure regarding the products and are more stressed over bad service and time consuming activities related to the shopping occasion.49 The consumer can experience certain Risks involved in the shopping activity and these risks are factors that affect the choice of shopping place and product. The five risks are; physical, economic, dissatisfaction regarding the product or shop and time. When deciding place and product, the consumer reflects upon these risks and analyzes what and how great the consequences could be if any of these would occur.50 However, not all consumers are negatively affected by these factors, on the contrary some consumers enjoy spending money and some want to be as busy as possible. Also the consumer can find the risk and effort involved in purchasing and using a certain product can be thrilling and exciting, therefore these negative factors can also be positive.51. 2.3. Image enhancement and marketing of a place. Place marketing is a continuous process in order to design a place to meet the consumers’ needs. This process aims to continuously improve a place and contains following five parts:52 . Design; the design of places reflects the qualities and could enhance its attractiveness. One way of designing a place is to create “a whole“, e.g. through connecting buildings together in order to achieve a more complete environment. The place design also put emphasize on an environmental association between physical, local, regional, national and historic characteristics in order to strengthen the image.. 48. McGoldrick (2002) Ibid 50 Ibid 51 Ibid 52 Kotler, Asplund, Rein & Haider (1999) 49. 11.
(15) . Infrastructure; a place needs to develop a well functioning infrastructure which is amalgamated into the environment without compromising the environmental standards. A well functioning infrastructure supports well functioning economic activities.. . Basic services; such as security and education are important parts of the development of a place in order to meet the needs of both public and businesses.. . Attractions; are the physical characteristics or events that attracts visitors, potential residents and businesses. Through creating attractions, for example sport arenas, the place image becomes strengthened and the degree of attraction increases.. . People; a service minded welcoming gives the visitors a positive perception of a place whilst an unpleasant welcoming creates a negative perception among the visitors. It is of importance that everybody involved in the destination development possess the right competence and “the right” attitude.. 2.4. Distance Decay. For destination development to be successful there are several conditions which have to be met. One of the most important of these is distance, distance between the destination/place and the market in terms of consumers in a hinterland.53. Within the destination hinterland there have to be enough customers for the companies within the destination to be successful. From a consumer perspective the distance could be seen in kilometers or time but also as a perception of mental distance, e.g. how mentally close a destination feels like from a consumer perspective.54. Distance can also be seen as a combination of physical distance in kilometers, the time it takes to travel and the mental distance; this is what can be called the distance experienced by the consumer and becomes clearer if the concept distance decay is used.55. 53. Hall (2005) Ibid 55 Hall (2005) 54. 12.
(16) Distance decay is highly affected by the communications and infrastructure between places, the better communications and infrastructure the less experienced distance. Places with a good image, well developed- infrastructure and attractions are the ones that are perceived as most accessible.56. Distance between destinations and target markets (consumers) could be seen as different degrees of accessibility, e.g. consumers living close to the destination (or company) are more likely to travel here than people living further away.57 This is shown in figure 1.. Figure1. Distance decay for different type of shops 58. From figure 1, one can read that the interaction between people and the destination decreases as distance increases; the greater the distance between people and shop, the less interaction there will be. Further it shows that people travel short distances to reach a convenience shop while they travel longer to reach the Superstore. Convenience shops are to be found almost everywhere while Superstores are geographically more spread.. 2.5. Central place theory. Central place theory assumes that a central location is the place where goods and services are available.59 In hierarchical way this theory ranks places scattered over a geographical area.60. 56. Hall (2005) Ibid 58 Hofstra university (2010) [electronic reference] 59 Knox & Marston (2001) 60 Wheeler, Muller, Thrall & Fik (1998) 57. 13.
(17) The theory is based on the idea of larger regional centres which capture the needs of people living in peripheral areas of different types of goods and services.61 The most central places have the largest hinterland, e.g. these places attract people from a longer distance than the places being not equally central.62. For the place to grow and develop, it is important that there is a financial inflow to the city from these peripheral areas. The development demands that the relationship and interaction between city and periphery. There are four factors that decide how people consume; price, typical frequency of purchase, various thresholds / barriers (physical) and customer base area. As regards goods and services, these seldom have a need to be located in regional centres, there are other economic factors that decide that these highly valued businesses establish within the regional centres.63 In large cities there is lower price sensitivity than in smaller cities, i.e. a niche company can charge a higher price for products if the market is larger than on smaller markets/cities.64. The central place theory requires well developed communications between the central place and its surroundings.65 Some central concepts are threshold value, range and hinterland: 66 . The threshold value; is the smallest number of customers needed for a shop to be profitable, e.g. the market size. The range; decides how far customers are ready to travel to access a product. The hinterland; is the market area surrounding a place.. The central place theory is based upon the creation of large centres that catches the need from customers from in peripheral hinterland of the center by offering certain services and products.67. 61. Wheeler, Muller, Thrall & Fik (1998) Ibid 63 Knox & Marston (2001) 64 Ibid 65 Ibid 66 Wheeler, Muller, Thrall & Fik (1998) 67 Wheeler, Muller, Thrall & Fik (1998) 62. 14.
(18) When establishing a company the theory suggests six different factors to help investigating the conditions. These factors read as follow:68. 68. . The size of the hinterland.. . The number of people (potential consumers) within the hinterland and the demographic development in the area.. . The purchasing power and trade flows within the hinterland.. . The extent of existing retail and how it develops. Possibilities of differentiation within retail.. . Competition; location, size and quality.. . Change in competition.. Hanink (1997). 15.
(19) 3. Method. In this chapter we present our choice of method, study selection and data collection. In the end of the chapter we address the reliability of the study as well as the delimitations we chosen to do. Qualitative methods are best suited when trying to understand and explain an event or individuals/groups experiences. Qualitative method is used when the researcher tries to capture people's actions as the meaning of these actions.69 The quantitative method is most appropriate when doing generalization results from studies. Quantitative method means the processing of large data sets and is used to explain a phenomenon's prevalence.70 Quantitative method is often also used when applying the phenomenon from a sample to a population with a known or estimated probability.71 The method we have chosen in this thesis is both qualitative and quantitative. The qualitative part represents the interviews and the observations while the quantitative part consists of the analysis and compilation of information already collected in the form of statistics and data, e.g. from SCB (Statistiska Centralbyrån –Bureau of Statistics) and HUI (Handelns Utredningsinstitut -the Swedish Research Institute of Trade). Since a large part of our study is based on our own observations and the way we interpret the environment we have chosen an interpretative approach. In our study we investigate and analyze individuals’ with leading positions within the companies concerned perceptions regarding trade development in the area of Sälen, foremost by conducting interviews with grocery shops managers and owners. The interviews lasted between 20 minutes and one hour each. Given these interviews, an interpretative approach is the approach that suits our study the best.. 69. Veal (2006) Jacobsen & Sandin (2002) 71 Patel & Davidsson (2003) 70. 16.
(20) 3.1. Collection of data. Before conducting the interviews we put together an interview guide consisting of themes that were going to guide us and the respondents through the interviews. All interviews are conducted through sound recordings which are saved in separate files in our computers. These interviews are transcribed and the answers are divided into the interview guide-themes. This is an easy way of keeping track of the information that is collected. It also gives the possibility to go back and listen to the recordings to ensure that we do not miss anything vital for the study. Further, by visiting Swedish shopping centres based on Norwegian cross border trade we have found out what kind of stores which are typical for this trade and can thereby compare and apply the existing border trade in south west of Sweden with a possible trade development by an establishment of a shopping centre in the area of Sälen. During the visits we photographed shops, interior and the design, parking spaces etcetera to map what different types of customer and trade that already exist.. 3.2. Assessment of the quality of data. Within qualitative research it is hard to find a single, true result; instead the result found could be classified as more or less reliable and authentic.72 The reliability shows the value in the interviews while the authenticity aims to give you an idea about if the study shows the respondents and their opinions in a rightful way.73 The aims of the qualitative part -our interviews- were to investigate the opinions regarding shopping among the companies in the area of Sälen. Since we interviewed managers within the different companies in Sälen it is our belief that we got opinions from people being familiar with the companies’ customers and who these are. It is therefore our belief that the interviews are as credible and authentic as needed for this study. When it comes to the secondary data consisting of already conducted surveys these surveys has been conducted by HUI and it is our belief that it is in their interest to use valid surveys. The numbers used in our calculations in this thesis are sometimes from different years. However, since they are the most updated within their own categories we choose to use them in the same calculations. 72 73. Bryman & Bell (2005) Ibid. 17.
(21) Regarding the literature review we tried to choose sources which are central with respect to the topic. We also tried to find recent research in order to make the study based on timely information.. 3.3. Scope of study. After visiting the shopping sites in Nordby, Töcksfors and Charlottenberg along the Swedish and Norwegian border, we assume that it is possible to apply existing data of cross border trade the case of Sälen. In the studies we have chosen to use in our thesis, the Swedish, Norwegian, Danish and Finnish consumption in Sweden is analyzed. However, our focus is on the Norwegian cross border trade in Sweden and therefore the other countries are not discussed. One assumption we make is that the Norwegians travel farther than Swedes for shopping. Since the Norwegian Krone is stronger than the Swedish; this makes it cheaper to shop in Sweden. Norwegians travel from a high price- to a low-cost country. Swedes do not travel as far to shop in Sweden as Norwegians since they do not benefit from this economically. The data from HUI used is based on a survey of Norwegian cross border shoppers and their shopping patterns and consumer behaviour among persons of age 17-75 years old. This age range is considered to be representative for the adult population. People are, according to the Central place theory, in our calculations evenly distributed geographically.. 18.
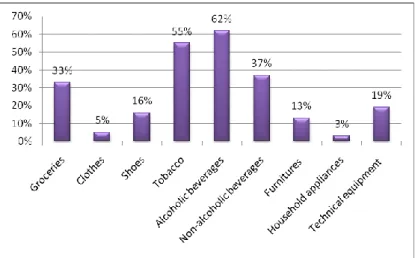
(22) 4. Cross border shopping between Norway and Sweden. In this chapter we will process the data collected concerning current Cross border shopping between Norway and Sweden. Using tables, charts and maps a distinct picture regarding this information is presented. During 2010, Norwegian cross border shoppers spent a total of 11, 6 billions SEK on shopping in Sweden. This gives an average spending of 10 900 SEK per cross border shopper.74 Norwegian cross border shoppers in Sweden purchase mainly tobacco, meat, candy and alcohol. 74 percent purchase meat, 63 percent purchase candy, 58 percent purchase alcohol and 52 percent purchase tobacco. In addition to this, they purchase clothing, shoes and sports / leisure products.75 Figure 2 shows the differences in price between various commodity groups in the countries concerned, using Sweden as the reference point. 76. Figure2. Norwegian prices compared to Swedish prices regarding different types of products.77. 74. HUI (2011) HUI (2010) 76 Ibid 77 Ibid 75. 19.
(23) In figure 2 it can be seen that the Norwegians save most money when buying alcoholic beverages, tobacco and groceries in Sweden, this explains why these products are the most popular in cross border trade. The fact that the Norwegian Krone has been higher than the Swedish Krona during the past ten years (and still is) is considered to be a major reason for the increased border trade between the two countries as is seen in figure 3.. Figure 3: Exchange rate SEK vs.NOK between the year 2000-2011.78. 4.1. Nordby, Töcksfors and Charlottenberg. As an example and a comparison with the general figures for cross border trade in Sweden today, one can look at the three shopping centres of Nordby, Töcksfors and Charlottenberg today. Thus, during 2010 with 42 shops and 930 000 visitors, Töcksfors had a turn over of 748 million NOK (831 million SEK). Charlottenberg with its 50 shops and 2, 69 million visitors had a turn over of 1 471 million NOK (1 634 million SEK). The largest centre in every sense is Nordby which with its 110 shops and 6, 4 million visitors had a turn over of 3 546 million NOK (3 939 million SEK). (The SEK based on the exchange value of 29th of April, 2011). 79 80 81. 78. Riksbanken (2011) [electronic reference] Nordby Shopping Center [electronic reference] 80 Charlottenberg Shopping Center [electronic reference] 79. 20.
(24) Plans of expansion has recently become official when the owner of the shopping centre announced that Töcksfors will add 12 000 square meters, 6 to 7 shops and 50 new employees to the now existing shopping centre. The expectations is that the turn over will increase with 452 million SEK to 1 200 million SEK.82 In March, 2011, we made a visit to the shopping centres of Nordby, Töcksfors and Charlottenberg in south west of Sweden. The three shopping centres are all situated in small places within a distance of 10 to 50 kilometers from the border to Norway. The roads from Norway are good and the centres are easily accessible by car or bus. When arriving at all three of these shopping centres the first thing we noticed was that approximately eight out of ten of all the cars in the parking lots had Norwegian liscense plates. Also, the parking lots were half full at the time we arrived at two of the shopping centres, between 10-12 am on a week day. The third shopping centre was full at 6-7 pm on a week day. Since the parking lots were half full or more during “office hours” one can assume that the cross border trade is spread out both in seasonal terms and during the week. On our visit, we found out that the shops most visited were grocery shops such as Maximat 83 and Eurocash. 84 Further the interior designs were the same for all three centres; large and airy spaces and modern design. The exterior designs were relatively bland with a flat roof box-like building. The shopping centres have between 40 and 110 shops each and include shops like supermarkets and clothing-, tobacco-, toy and candy shops.. 4.2. Norwegians shopping in Sälen. Today the Norwegians travel to Sälen for shopping. According to Systembolaget (Swedish Government owned shop that sells liquor), located in the central village of Sälen, approximately 30 percent of their customers throughout the year consist of Norwegians, while the grocery shops in the village of Sälen estimates that approximately between 10 to 30 percent Norwegians. The merchants in village of Sälen appreciate that the Norwegian. 81. Töcksfors Shopping Center [electronic reference] NWT (2011) [electronic reference] 83 Maximat (2011) [Electronic reference] 84 Eurocash (2011) [Electronic reference] 82. 21.
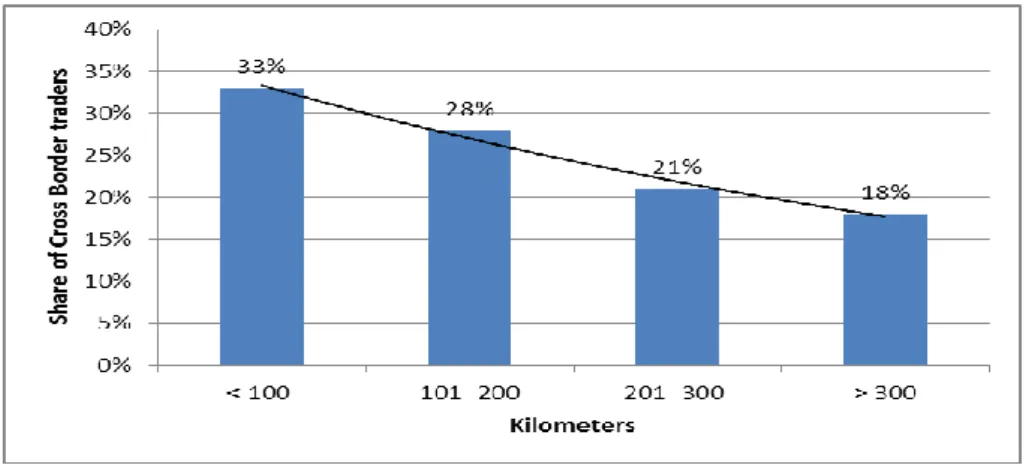
(25) customers spend between 500 and 2000 SEK. According to the same source the products bought by Norwegians are predominantly alcohol, meats, tobacco and sodas.85 86 87. The owner of the grocery shop ICA in the ski resort Lindvallen a few kilometers from the village of Sälen, do suffer an economic loss during April 2011. And since 95 percent of his customers are Swedish mountain tourists and very few of the remaining 5 percent are Norwegians, he can never count on Norwegians to come to his shop. The reason for this, he argues, is even though his grocery shop is closer to the Norwegian border the village of Sälen has Systembolaget, which provides goods of high attraction to the border trade. Norwegians tend to travel to places which sell alcohol and when visiting these places they take the opportunity to shop for groceries. This means that the village of Sälen has a great advantage and thus attracting Norwegian customers, an advantage that the companies in all ski resorts outside Sälen village lack. The village of Sälen is now the central place to the Norwegians.88 As regards the existing Norwegian border trade in Sweden, the median catchment area is estimated to be within 300 kilometers travel distance in Norway.89 Figure 4 shows the percentage distribution (the distance decay) of the distance travelled for Norwegian cross border shopping in Sweden during 2010.. Figure 4 Distance travelled by Norwegian cross border shopper during 2010. 90. 85. Sven-Ove Samils, manager Ica Nära Sälen (interview), 2011-05-09 Employee, Systembolaget Sälen (interview), 2011-05-09 87 Peter Antoniusson, manager Systembolaget Sälen (e-mail), 2011-05-03 88 Tomas Olsson, manager Ica Nära Lindvallen (interview), 2011-05-09 89 HUI (2010) 90 Ibid 86. 22.
(26) Figure 4 shows that Norwegian cross border shoppers travel between 0 and 300 km to shop.91 Out of these, 33 percent travel up to 100 kilometers, 28 percent travel between 101-200 kilometers and 21 percent travel 201-300 kilometers for cross border shopping. The remaining 18 percent travel farther, however the distance beyond these 300 kilometers are not calculated for. According to the merchants in the village of Sälen, their Norwegian customers travel as far as from Oslo, 260 kilometres from Sälen, to shop. During high seasons e.g. Easter, Christmas and the National day of Norway, the merchants in Sälen can see a significant increase in customers as is seen in Nordby, Töcksfors and Charlottenberg.92 93 94 95. 91. HUI (2010) Sven-Ove Samils, manager Ica Nära Sälen (interview), 2011-05-09 93 Employee, Sytembolaget Sälen (interview), 2011-05-09 94 Peter Antoniusson, manager Systembolaget Sälen (e-mail), 2011-05-03 95 Mattias Henriksson, manager Coop Konsum Sälen (interview), 2011-05-09 92. 23.
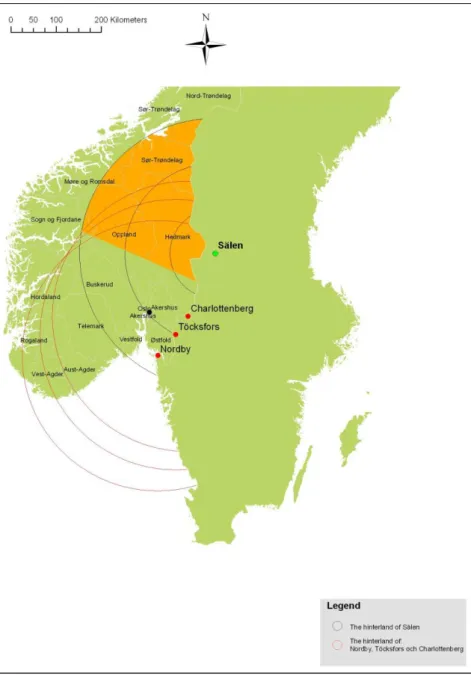
(27) The map in figure 5 shows the regions within the Norwegian hinterland of Sälen. The affected regions in Norway are: Hedmark, Sör-Trondelag, Nord-Trondelag, Möre og Romsdal, Sogn og Fjordane, Oppland, Buskerud, Telemark, Vestfold, Oslo, Akershus and Östfold.. Figure 5: Map of the 0-300 kilometer hinterland of Sälen.. Within the affected regions in figure 5, inside the hinterland area, lives a total of 2 434 592 96 Norwegians. Within the 0-100 kilometers distance the population numbers 52 931 97 Norwegians. Within the 101-200 kilometers distance the corresponding figure is 1 283 821 98 Norwegians and within the 201-300 kilometers distance, a total of 1 097 840 99 Norwegians live.. 96. Appendix 1 Ibid 98 Ibid 99 Ibid 97. 24.
(28) The map in figure 6 shows the hinterlands of Sälen, Charlottenberg, Töcksfors and Nordby. It shows that all four of these destinations share a great part of the hinterland area with Sälen. At the same time Sälen has a larger hinterland which is exclusive to Sälen. This is being shown as the orange part of the map in figure 6. This map was created through measuring the shortest distance for possible consumers to travel and assuming that they do so.. Figure 6: Map of the potential hinterland of Sälen. Orange segment indicates an area without competition from Nordby, Töcksfors and Charlottenberg.. Within the orange area a total of 556 537 100 people live. Out of these 47182 101 people lives within area distance of 0-100 kilometers from Sälen and 169 346 102 people live within a distance of 101-200. Within 201-300 kilometers from Sälen, a total of 340 010 people live. 103. 100. Appendix 2 Ibid 102 Ibid 103 Ibid 101. 25.
(29) 5. Mountain tourists shopping in Sweden. In this chapter we will process the data collected concerning Mountain tourists’ shopping in Sweden. Mountain tourists consist of downhill skiers, snowmobilers, backpackers and general visitors. The different categories all spend different amounts during their stay due to the choice of destination and reason to visit.104 Figure 7 shows the development between 1997- 2004 (latest available statistics) regarding what products ski tourists spend their money on during their vacation in the mountains.. Figure 7: The turnover in SEK within different categories during 1996-1997 and 2003-2004. 105. The numbers in the table are based upon touristic skiing, e.g. the table only includes tourists´ travelling to the mountains with primary intentions to ski. Also figure 7 shows that Accommodation and Shopping are the items that have increased the most. The turnover on Accommodation has almost doubled while the turnover on Shopping has more than doubled.106 Today the average mountain tourist spend 3 708 SEK per person and visit to the Swedish mountains. Of this sum 628 SEK (16, 9%) is used to buy food and pay for restaurant visits. If. 104. Fredman (2008) NUTEK (2007) 106 Ibid 105. 26.
(30) one adds to this the cost of gasoline (within the final destination), oil, clothing, souvenirs and gifts, the sum will increase and average 862 SEK within the category shopping.107. 5.1. Tourist groups in Sälen. The mountain tourists can be divided into two groups; the ones who stay in official accommodations as hotels, camping or others during their visit. The second group are the ones staying in unofficial (private owned) accommodation/ houses during their stay. However, the latter group is complicated in regards of statistics since these private house owners do not report to the same extent their statistics of overnight stays as the hotel owners do. During the year of 2010, Sälen had an estimated total of 223 827. 108. visitors (official. statistics) and with an average length of stay of 4,49 nights. This number includes both Swedish –and foreign tourists. Figure 8 shows the distribution of visitors throughout the year.. Figure 8: The distribution of official visitors in Sälen during the year of 2010. 109. As can be seen in figure 8 the season peaks in the time period January to April. December is also a month with a lot of visitors. During these months Sälen receives 168 263 visitors. 107. Fredman (2008) Total number of guest nights divided with average length of stay 1 005 719/4,493287=223827 109 SCB (2010) [electronic reference] (Number of reported official guest nights per month during 2010 108. 27.
(31) (official statistics) which represents 75 percent. 110. of the total number of visitors during the. year of 2010. During 2009 the number of visitors staying in private houses (unofficial statistics) was estimated to be 190 667.111 These are also assumed to stay 4, 49 nights per visit and person. Regarding the behaviour and consumption of tourists in Sälen today, there tends to be two types; one part that do not care greatly about price but fall into the category of hedonistic shopping behaviour, where the shopping is a joyful part of the trip as an experience as well as a lifestyle. According to the ICA merchandiser in Lindvallen 112, very often these are the tourists that have expensive cars –and skiing equipment and eat at restaurants frequently during their visit in Sälen. The other part fall into the more rational shopping behaviour category where price matters a great deal and where preferably all the shops necessary should be gathered close to each other or in one place, quite the contrary to the first category. Interviewing the merchandisers in Sälen, it becomes clear that both categories mentioned above seek to obtain as much value out of the shopping experience and products as possible but with different perquisites and expectations. However, they both want quality, choice, reasonable opening hours, good service and a nice shopping environment. They do not want to spend money on bad quality, spend too much time and effort on shopping or feel stressed during their ski vacation in Sälen.113 114 115 116 117. 110. Number of visitors during January-April + December divided with the total number of visitors during 2010 168263/223827=0,751755 ~0,75 111 TEM (2009) 112 Tomas Olsson, manager Ica Nära Lindvallen (interview), 2011-05-09 113 Sven-Ove Samils, manager Ica Nära Sälen (interview), 2011-05-09 114 Employee, Sytembolaget Sälen (interview), 2011-05-09 115 Peter Antoniusson, manager Systembolaget Sälen (e-mail), 2011-05-03 116 Mattias Henriksson, manager Coop Konsum Sälen (interview), 2011-05-09 117 Tomas Olsson, manager Ica Nära Lindvallen (interview), 2011-05-09. 28.
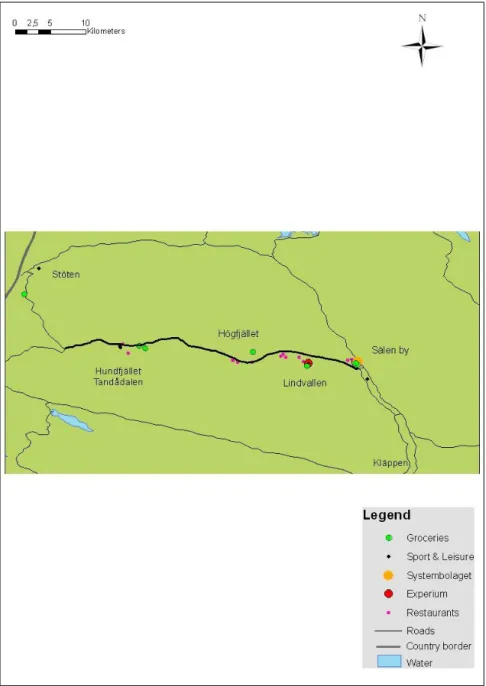
(32) Regarding Sälen as a destination, the infrastructure is primarily based on cars. Visitors arriving to Sälen without a car are dependent on buses or taxis. All of the ski resorts are geographically separated with a distance between 5 to 30 kilometers as seen in figure 9.. Figure 9: Category and location of different businesses and shops in Sälen 2010.. Figure 9 shows category and location of the different businesses in the area of Sälen. The majority of the companies are located in Lindvallen and on Högfjället. Each one of the ski resorts and Sälen village has at least one grocery shop and one restaurant. The largest selections of restaurants are to be found in Lindvallen and Högfjället. Stöten is the only resort not having a sport & leisure shop and Systembolaget only exists in Sälen village.. 29.
(33) 6. Analysis and Result. In this chapter we will analyze the data collected regarding the current shopping situation and tourism in Sälen as well as for the Norwegian cross border shopping in Sweden in order to reach a result which will form the basis for our discussion and conclusion. In order to get an idea of earnings of a future shopping centre in Sälen, it is necessary to calculate upon possible scenarios regarding buying power of Norwegian cross border shoppers related to distance travelled within the Norwegian hinterland. Given the numbers regarding the individual expenditure of Norwegian cross border shoppers during 2010, it is possible to calculate how great of buying power with Norwegians there is for a future shopping centre in Sälen. Taking into account the calculated hinterland of Sälen and its possible cross border shoppers as well as the average expenditure of a Norwegian cross border trade a future shopping centre in Sälen could earn economically.. 6.1. Buying power of mountain tourists. Mountain tourists can roughly be divided into two groups; the ones that live in official accommodation during their stay and the ones who rent or own a private house. During the year 2010 Sälen received 223 827 tourists with a total buying power of 192 938 874 SEK. The number of tourists staying in private homes during 2009 was 190 667 and their total buying power a total of 164 354 954. 118. since the average tourist spend 862 SEK. per visit in the mountains. This gives the mountain tourists a total buying power within the category shopping of 357 293 541 SEK.119. 6.2. Norwegian cross border shoppers buying power. When applying the distance decay theory (see figure 4) and the percentage of number of possible cross border shoppers in the different areas inside the hinterland, this gives that within the 0-100 kilometers hinterland area a number of 17 467 potential customers. 120. are. 118. TEM (2009) The total number of tourists, living in private homes (not reported statistics) multiplied with the average expenditure of a mountain tourist in Sweden 190667*862=164 354 954 119 The total number of tourists in Sälen, using 2010 years numbers, multiplied with the average expenditure of a mountain tourist in Sweden (223 827*862) +(190 667*862)= 357 293 541 120 Total amount of people living in the 0-100 kilometer area multiplied with the percentage that are likely to travel cross border to Sweden to shop 52 931*0,33=17467,23 ~17467. 30.
(34) likely to take the trip to Sälen in order to shop. Within the 101-200 hinterland area 359 470 121. people are considered to be possible consumers in the area of Sälen. Within the 201-300. hinterland the equivalent number is 230 546. 122. possible consumers live. The Norwegian. hinterland without competition of larger shopping centres In the area without competition (orange marked, see figure 6) of Nordby, Töcksfors and Charlottenberg there are today a total number of 134 389 live. Out of these 15 570. 124. 123. possible cross border shoppers. live within an area of 0-100 kilometers, 47 417. 125. live within. 101-200 kilometers from Sälen and the remaining number of 71 402 126 people lives within an area of 201-300 kilometers from Sälen.. A total of 134 389 cross border shoppers (within the area without competition) gives a summarized buying power of 1 464 840 100SEK.127. 121. Total number of people living in the 101-200 kilometer area multiplied with the percentage that are likely to travel cross border to Sweden to shop 1 283 821*0,28=359469,88 ~359470 122. Total number of people living in the 201-300 kilometer area multiplied with the percentage that are likely to travel cross border to Sweden to shop 1 097 840*0,21=230546,4 ~230546 123. The number of people within 0-100 multiplied with the percent who travels this distance added with the same numbers within 101-200 km added with the same number within the 201-300 area (47182*0,33)+( 169346*0,28)+(340010*0,21)= 134389,04 ~134389 124. The number of people within 0-100 km multiplied with the percent who travels this distance 47182*0,33=15570,06 ~15570 125. The number of people within 101-200 km multiplied with the percent who travels this distance 169346*0,28=47416,88 ~47417 126. The number of people within 201-300 km multiplied with the percent who travels this distance 340010 *0,21=71402,1 ~71402 127. The number of cross border shoppers multiplied with the average sum spent by one person 134389 *10900=1464840100. 31.
(35) In order to get an idea of potential outcomes of a future shopping centre in Sälen, it is necessary to calculate upon possible scenarios regarding buying power of Norwegian cross border shoppers related to distance travelled within the Norwegian hinterland. A number of outcomes from a future shopping centre in Sälen could be possible; the following four, presented in figure 10, are to us most possible to be expected:. Scenario 1. Norwegian Number NCBS population of buying NCBS power in SEK 52 931 17 467 190 390 300. Scenario 2. 1 283 821. 359 470. NCBS buying power +MT´s buying power 383 329 174. 4 108 613 4 301 552 174. The total buying power of NCBS, MT´s and MTPH’s 547 683 841 4 465 906 841. 300 Scenario 3. 1 097 840. 230 546. 6 621 564 6 814 503 574. 6 978 858 241. 700 Scenario 4. 563 767. 135 906. 1 464 840 1 657 778 974. 1 822 133 641. 100. Figure 10: Potential outcomes of a future shopping centre in Sälen , illustrated in four scenarios. *NCBS: Norwegian cross border shoppers *MT: Mountain tourists *MTPH: Mountain tourists staying in private homes. Scenario 1: Buying power within 0-100 km från Sälen Scenario 2: Buying power within 0-200 km från Sälen Scenario 3: Buying power within 0-300 km of Sälen Scenario 4: Buying power without competition from similar shopping centres, Nordby, Töcksfors and Charlottenberg, within 0-300 km of Sälen. The summarized buying power among both mountain tourists and Norwegian cross border shoppers in the area of Sälen could on a yearly basis be 6 978 858 241 SEK.128. 128. Total buying power of cross-border shoppers added with the total buying power of tourists 6621503952+192938874= 6 814 442 826 SEK. 32.
(36) The scenarios possible are many and economically varied in their results. However, these calculations which present a range, from less to great earnings, are necessary in order to cover and be prepared for most outcomes of a future shopping centre in Sälen. In order to estimate which outcome or outcomes most likely to occur, it is necessary to discuss the results and findings.. 33.
(37) 7. Discussion and Conclusion. In this chapter the result is weighed to the research questions and we describe whether the result met the aim and research questions. . What are the characteristics of the existing supply of retail trade in the Sälen area today?. Today, Sälen is one of Sweden's top ski resorts with approximately 1, 8 million overnight stays annually, this gives about 414 000 annual visitors (official and unofficial overnight stays). For these tourists, the range of shops and their product offerings is currently quite small and one sided. The shops that are most prominent in both Sälen village and the surrounding mountain resorts (Kläppen, Lindvallen, Tandådalen, Hundfjället, Högfjället, Stöten and Näsfjället) are Systembolaget in Sälen village, ICA, Stadium, restaurants and several small clothing shops as United by altitude and more. Based on our own observations of shopping opportunities in Sälen, it appears in the current situation that there are no major shopping opportunities for the broader mass today. . How can this demand for shopping be portrayed in terms of volume and type?. Today's tourists in Sälen has a consumption regarding groceries, retail, clothing as well as refueling within the destination that reaches approximately 357 million SEK per year. The consumption takes place mainly during the ski resorts high season (December to April). Based on the Central Place theory, during high season from December to April, Sälen region qualifies of being a Central place in terms of having the answer to peoples, in this case the visiting tourists, wants regarding skiing and other outdoor activities. It also has the grocery shops and restaurants to further fulfil their needs. However, regarding the centre village of Sälen, it cannot qualify as a central place. During low season having few tourists and visitors, the village does not play an important role as a crucial provider of services and goods other from the inhabitants of the village and the few cottage owners. Using the Central Place theory, individuals in the nearby region are not lightly to travel to Sälen since there are other easy accessible, both mentally and physically, and larger places. These also have more to offer in similar (or even lower) price range within the same, closer or slightly longer distances, e.g. Malung and Mora.. 34.
(38) As an induction and base for the topic of this thesis, the possibilities for commercial development with a primary focus on the potential for establishing a shopping centre in the area of Sälen, the shopping centres of Nordby, Töcksfors and Charlottenberg are used as comparison. These places were prior to their shopping center establishment, comparable to the current Sälen area in respect of distance to the Norwegian border, shopping hinterland and the population density but with some disparities; Sälen today has something that Nordby, Töcksfors and Charlottenberg did and do not have: 414 000 visitors in terms of winter tourists. The tourists may be seen as an advantage as they can be counted as spending power in the event the establishment of a shopping center in Sälen. On the other hand, Sälens lacks the catchment area of the Norwegian population density which Nordby, Töcksfors and Charlottenberg have, in its and the purchasing power available in Oslo residents, assumed that the Oslo residents will not be traveling all the way to Sälen even if they are in it for Sälen estimated periphery with a radius of 200 km. Although, with the new airport that most likely will be built, Sälen will be more accessible for foreign tourists as well as for Swedish tourists living farther away. However, depending on which type of flights that would traffic the airport, if the airport traffic regular flights, charter and or private flights, many different types of visitors with different buying power and consumption patterns would be possible. They all would result in different incomes for the actors and merchandisers in Sälen. . Is the potential customer base large enough for establishing a shopping centre in Sälen in the near future?. Given that the potential shopping center has the elements such as easy access, grocery, tobacco and alcohol sales at reasonable Swedish prices that the successful shopping centers in Värmland and Bohuslän have, the Norwegian border shoppers, mainly from the counties and places such as Hedmark and Trondheim and others, will hopefully be attracted to go there and shop. If a shopping center in the approximate size as Töcksfors (42 shops) or more would be built in Sälen, it can be concluded that both affluent Norwegians in a radius of 200-300 kilometers, Sälen mountain tourists as well as permanent residents in the surrounding region is likely to be attracted. Depending on what turnover that is necessary, there is a reasonably large Norwegian customer base for a future shopping centre in Sälen. This added with the possible total expenditure by 414 000 tourists in Sälen and the possible expenditure of the calculations on Norwegian likely to go there and shop, an establishment of a shopping centre in Sälen could be successful in terms of income and turnovers for the driving and engaged actors: The 35.
(39) whole area without competition added with Sälen tourists gives a turnover of approximately 1, 8 billion SEK. This is the scenario we feel most reasonable if the shopping centre is built. This based on the fact that this area has no competition similar to a shopping centre productand size wise. Sälen today is as already mentioned a destination existing of smaller destinations and with no obvious centre place. It is our belief that a shopping centre located at a strategically suited place would create such a centre place and thereby strengthen the destination as a whole. Furthermore, the closeness to Trysil and this destinations visitor number could also be seen as advantages for a future establishment of a shopping centre in Sälen. The two destinations Sälen and Trysil strengthen each other's identities when they create a symbiosis of trendiness, accessibility and availability of goods and attractions. This can result in more people are attracted to come to Sälen while visitors in Trysil are attracted to go to the Sälen if a shopping centre is located there. In order to get an idea of how a shopping centre could affect Sälen in terms of potential work opportunities and not just in terms of SEK. One full time employee in Sweden within retail costs an average of 1 991 500 129 SEK of the total turnover. Applying this calculation on a potential shopping centre in Sälen (based on the hinterland area without competition) that would have a turnover of roughly 1, 8 billion SEK, a total of 915 130 people could be employed. At last and most importantly, what we would like to emphasize is that all of our calculations are solely results of current statistics together with possible future scenarios and can therefore be analyzed and discussed further. Suggestions on further research would be to collect material that would give the correct statistics regarding the number of tourists in Sälen, more precise to calculate the hidden statistics-unrecorded guest nights (in terms of private leisure homes). Also, a market analysis regarding the wants and needs among tourists in Sälen would be appropriate. A market 129. HUI (2009) The cost of the average employee within retail in Sweden for companies with employees in groups of: 1-4, 5-9, 10-19 and 20 <. (1261000+1822000+2206000+2677000) /4=1 991 500 SEK 130. Possible turnover divided with the cost of an average employed within retail 1822133641 /1 991 500=914,95 ~915. 36.
(40) analysis would find out what products and services necessary to succeed with a possible establishment of a shopping centre in Sälen. Even if the total expenditure of tourists in Sälen is relatively small compared to the Norwegian cross border shoppers’, it is still relevant to meet the needs and expectations of the Sälen tourists so that they experience Sälen as a ski resort and not just a shopping destination. If these needs and expectations become neglected, Sälen will risk loosing its attractiveness as a ski resort.. 37.
(41) 8. References. Printed Archer, B.H., (1989), Tourism and Island Economies: Impact Analyses in C.P. Cooper (ed.), Progress in Tourism, Recreation and Hospitality Management. London and New York: Belhaven Press.. Bohlin, M., Elbe,J. (2007). Utveckla turistdestinationer-ett svenskt perspektiv. Stockholm:08tryck.. Bryman, Alan & Emma Bell. (2005) Företagsekonomiska forskningsmetoder, 1:a uppl. Malmö, Liber ekonomi.. Evans, M. R., Fox, J. B., & Johnson, R. B. (1995). Identifying competitive strategies for successful tourism destination development. Journal of Hospitality and Leisure Marketing, 3(1), 37–45.. Fredman, P. (2008) Determinants of visitor expenditures in mountain tourism, European Tourism Research Institute, Mid-Sweden University, S-83125 Östersund, Sweden.. Gibson, L. (2006). Learning Destinations - The complexity of tourism development. Karlstad University Studies 1403-8099; 41.. Gilmore James H. and Pine II B J. (1997) Beyond Goods and Services in Strategy & Leadership, Vol. 25, No. 3, May-June 1997. Hall, M. (2005) Tourism: Rethinking the social science of mobility. Harlow: Pearson Education.. Hanefors, M & Mossberg, L. (2007) Turisten i upplevelseindustrin, Lund: Studentlitteratur. Hanink, D.M. (1997), Principles and applications of economic geography – Economy, policy, enviroment, John Wiley & sons Inc, New York.. HUI (2009) Centrala nyckeltal för detaljhandeln år 2008.. HUI (2010) Nordisk gränshandel och turism i Sverige 2010: Kvartal 1. 38.
(42) HUI (2011) Nordisk gränshandel och turism i Sverige 2010 Kvartal 4 och helåret 2010.. Jacobsen, D.I. & Sandin, G. (2002). Vad, hur och varför: om metodval i företagsekonomi och andra samhällsvetenskapliga ämnen. Studentlitteratur, Lund. Kim, Y. (2002) Consumer value: An application to mall and Internet shopping. International Journal of Retail & Distribution Management, 30(11/12), pp. 595-602. Knox, P. L. & Marston, S. A., (2001) Places and Regions in Global ContextHuman Geography. Prentice Hall Inc. Upper Saddle River, NJ.. Kotler, P., Asplund, C., Rein, I., & Haider, D. H. (1999). Marketing Places Europe. Edinburgh: Pearson Education Limited. Lundblom Lena, ”Dagens konsumenter vill njuta av livet”, Resumé, nr 15, 1997 Lundén, T., (2002) Över gränsen – Om människan vid territoriets slut. Studentlitteratur, Lund.. Malung-Sälen Municipality (2011) Sälenfjällens befolkningsutveckling;urval.. Mathews Ryan, Consumer direct: will stores survive? Progressive Grocer, May v 76 n 5 p 30, 1997. Normann, R. och Ramíerz, R. Den nya affärslogiken. Liber-Hermods AB, Malmö, 1994.. NUTEK (2007). Fjällturismen i Sverige Infonr 007-2007Utveckling 1978-2004. Rapport 007:2007.. Nylén K, "Från kvartersbutik till köpcentrum - detaljhandel i en småstad under 50 år", Lidköpings köpmannafören., Lidköping, 1997.. Patel, R. & Davidson, B. (2003) Forskningsmetodikens grunder: Att planera, genomföra och rapportera en undersökning. 3:e upplagan. Lund: Studentlitteratur.. 39.
(43) Solomon, M. Bamossy, G. & Askegaard, S. (1999) Consumer behaviour a european perspective. Prentice Hall Europé.. Solomon, M., Bamossy, G., Askegaard, S., & Hogg, M.K. (2006) Consumer behavior: A European perspective (3rd Ed.). London: Pearson Prentice Hall.. TEM (2009) Ekonomiska och sysselsättningsmässiga effekter av turismen i Sälen. Timothy, D. J., (2005) Shopping tourism, Retailing and Leisure. Channel View Publications. Clevedon, UK.. Veal, A.J. (2006) Research methods for leisure and tourism: a practical guide. Harlow, England: Prentice Hall.. Wheeler, J, Muller, P, Thrall, G & Fik, T (1998): Economic Geography, John Wiley and Sons, Inc. New York.. Internet Eurocash’s homepage Available: http://eurocash.se/butiker.htm (2010-05-16) Expressen’s homepage Available: http://www.expressen.se/resor/vinterguiden/1.2314255/salen-hoppas-pa-en-egenflygplats (2011-05-21). Glesbygdsverket´s homepage Available: http://www.glesbygdsverket.se (2011-03-15). Hofstra university homepage Available: http://people.hofstra.edu/geotrans/eng/ch7en/meth7en/retaildistancedecay.html (2011-05-03). Malung-Sälen homepage Available: http://www.malung-salen.se//start/kommunen__38 (2011-04-25) Maximat’s homepage Available: http://m.maximat.se/?url=http://www.maximat.se/ (2011-05-16). 40.
(44) NWT´s (Nya Wärmlands Tidningen) homepage Wik, C. ”Töcksfors shoppingcenter byggs ut – 50 nya jobb” Available: http://www.nwt.se/arjang/article879180.ece?service=mobile (2011-05-01). Olav Thon group´s homepage “Charlottenberg Shopping Center” Available: http://www.olavthon.no/Vare-virksomheter/Kjopesenter/Varekjopesentere/Charlottenberg-shoppingsenter/ (2011-03-23) “Nordby Shopping Center” Available: http://www.olavthon.no/Vare-virksomheter/Kjopesenter/Varekjopesentere/Nordby-Shoppingcenter/ (2011-03-23) “Töcksfors Shopping Center” Available: http://www.olavthon.no/Vare-virksomheter/Kjopesenter/Varekjopesentere/Tocksfors-Shopping-Center/ (2011-03-23). Riksbanken´s homepage Available: http://www.riksbank.se (2011-04-28). Statistiska centralbyrån´s homepage Available: http://www.scb.se (2011-03-27). Skistar´s homepage “Fakta” Available: http://www.skistar.com/sv/Pressrum/Salen/Fakta/ (2011-03-27) “Nyheter Skistar Trysil säsongen 10/11” Available: http://www.skistar.com/Pressrum/Trysil/Pressmeddelanden/?item-id=473181. Interviews Employee, Sytembolaget Sälen (interview), 2011-05-09 Mattias Henriksson, manager Coop Konsum Sälen (interview), 2011-05-09 Peter Antoniusson, manager Systembolaget Sälen (e-mail), 2011-05-03 Sven-Ove Samils, manager Ica Nära Sälen (interview), 2011-05-09 Tomas Olsson, manager Ica Nära Lindvallen (interview), 2011-05-09. 41.
(45) Appendix 1: Population within the buffer zones Fylke Akershus Buskerud Hedmark Møre og Romsdal Nord-Trøndelag Oppland Oslo Sogn og Fjordane Sør-Trøndelag Telemark Vestfold Østfold. Size in square kilometers. Area within 0-100. Fylke Akershus Buskerud Hedmark Møre og Romsdal Nord-Trøndelag Oppland Oslo Sogn og Fjordane Sør-Trøndelag Telemark Vestfold Østfold. Percentage of total area within 101-200. 4 918 14930 27433 15121 22396 25192 465 18623 18832 15299 2224 4 184. 0,277548937. Area within 101-200. Area within 201- 300 3947 986 17545. 7614. 9575 465 1944. 416. Percentage of total area within 101-200. 734 12599 2274 2711 3123 14522 1911 11616 3969 1661 3200. Percentage of total area within 201-300 0,802562 0,066042 0,639558. 0,380081 1,000000 0,103229. 0,099426. 0,149248 0,843871 0,082893 0,179287 0,139445 0,576453 0,102615 0,616822 0,259429 0,746853 0,764818. 42.
Figure
Related documents
consumerist public life City centre loosing stores.. to shopping centres and
In some ways, channels were used by changing between them while shopping, but it was most of the time only two channels used in each shopping practice where the activities
46 Konkreta exempel skulle kunna vara främjandeinsatser för affärsänglar/affärsängelnätverk, skapa arenor där aktörer från utbuds- och efterfrågesidan kan mötas eller
The increasing availability of data and attention to services has increased the understanding of the contribution of services to innovation and productivity in
Närmare 90 procent av de statliga medlen (intäkter och utgifter) för näringslivets klimatomställning går till generella styrmedel, det vill säga styrmedel som påverkar
• Utbildningsnivåerna i Sveriges FA-regioner varierar kraftigt. I Stockholm har 46 procent av de sysselsatta eftergymnasial utbildning, medan samma andel i Dorotea endast
I dag uppgår denna del av befolkningen till knappt 4 200 personer och år 2030 beräknas det finnas drygt 4 800 personer i Gällivare kommun som är 65 år eller äldre i
The EU exports of waste abroad have negative environmental and public health consequences in the countries of destination, while resources for the circular economy.. domestically
