KTH ROYAL INSTITUTE OF TECHNOLOGY
SCHOOL OF INDUSTRIAL ENGINEERING AND MANAGEMENT
DEGREE PROJECT IN TECHNOLOGY AND ECONOMICS, SECOND CYCLE, 30 CREDITS
STOCKHOLM, SWEDEN 2017
The effect of M&A activity
on R&D intensity
- A quantitative study on the
Swedish biotechnological industry
ELLINOR AHLFVENGREN
LOUISE BLOMQVIST
The effect of M&A activity on firms R&D intensity
-
A quantitative study on the Swedish biotechnological industryEllinor Ahlfvengren
&
Louise Blomqvist
Master of Science Thesis INDEK 2017:31 KTH Industrial Engineering and Management
Industrial Management SE-100 44 STOCKHOLM
Master of Science Thesis INDEK 2017:34
The effect of M&A activity on firms R&D intensity
-
A quantitative study on the Swedish biotechnological industryEllinor Ahlfvengren & Louise Blomqvist Approved 2017-05-19 Examiner Kristina Nyström Supervisor Anders Broström Abstract
This is a quantitative thesis of the Swedish biotech industry, that intends to study what effect M&A activity has on firms R&D intensity. It is an important question as the market demand is changing rapidly and puts high pressure on companies to constantly deliver new innovations. The study is based on panel data and ordinary least squares regressions. The findings are similar to previous studies, which points towards both positive and negative directions when referring to M&A activity and its impact on R&D intensity. This thesis show lack of statistical significant results when it comes to how R&D intensity (R&D intensity is defined as the ratio of R&D expenditure to total sales) is affected by M&A activity.
Key-words
Acknowledgements
We would like to take the opportunity and thank our supervisor Anders Broström at Royal Institute of Technology. He has supported us through the process and guided us with discussions and meetings. We would also like to thank our friends and families that has helped us and kept us motivated.
Roral Institute of Technology, Stockholm, June 2017
Ellinor Ahlfvengren Louise Blomqvist
TABLE OF CONTENTS
1. INTRODUCTION 1
1.1 Background 2
1.2 Purpose and research question 3
1.3 Delimitations 3
1.4 Assumptions 4
1.5 Sustainability 4
1.6 Disposition 5
2. THEORETICAL FRAMEWORK 6
2.1 M&A waves throughout the history 6
2.2 Incentives to engage in M&A activities 7
2.3 M&A as a strategy 10
3. LITERATURE REVIEW 12
3.1 The effect of M&A on R&D activity 12
3.2 M&A in the biotechnological sector 15
4. DATA AND METHODOLOGY 19
4.1 Validity and reliability 19
4.2 Research design 20
4.3 Collected data 21
4.4 Empirical model 27
5. RESULT 29
6. EMPIRICAL ANALYSIS 32
7. CONCLUSION AND SUGGESTION FOR FURTHER RESEARCH 35
8. REFERENCES 36
LIST OF FIGURES
FIGURE 1 . NUMBER OF M&A IN BIOTECH FIRMS IN SWEDEN BETWEEN THE YEARS 2000-2015 ... 2
FIGURE 2 CHANGES OF R&D EXPENDITURE IN PERCENT BETWEEN THE YEARS 2000–2015 ... 25
FIGURE 3 R&D EXPENDITURE FOR THE COMPANIES BETWEEN THE YEARS 2000-2015 ... 26
LIST OF TABLES
TABLE 1. SUMMARY OF PRIOR STUDIES ON M&A AND R&D --- 18TABLE 2. VARIABLE DESCRIPTION --- 22
TABLE 3. SUMMARIZED DATA OF THE VARIABLES --- 24
TABLE 4. CORRELATION MATRIX FOR THE VARIABLES USED IN THE REGRESSION --- 24
1
1. INTRODUCTION
In recent years, a pattern has been established where large corporations try to become more innovative. At the same time, they are rarely active in early-stage scientific research (Fortune, 2016). This is an interesting pattern and raises questions of how they retain a high level of innovation. Some argue that the large corporations instead “outsource” the research and development (R&D) department to start-ups and seek to acquire successful innovators (ibid). Innovation comes from creating new products or services, which is usually done by the R&D department. The Nordic market is attractive for its well-known researchers, well-developed infrastructure and high innovation rate. At the same time, the biotech industry is more dependent on innovative business models in order to execute R&D programs as efficiently as possible. These factors, together with the rapid technology development and increased demand on health care systems, make the Swedish biotech industry highly relevant to study. The biotech industry has potential to transform many sectors; bioengineering, manufacturing, genomics, medicine and agriculture (Sweden bio, 2014).
This thesis will focus on mergers and acquisitions (M&A), which are defined as a consolidation of two companies and are used as a growth strategy (Faulkner et. al 2012). The market for M&A:s is significant and in the year 2015, M&A accounted for 195 billion SEK in Sweden (SvD Näringsliv 2016). One fraction of that amount refers to M&A within the biotech industry in Sweden. Biotech aims at developing breakthrough inventions as new technologies or products in order to positively affect the cure of diseases, preserve the environment and make use of cleaner energy (Biotechnology Innovation Organization 2017). Biotech is characterized by high investments in R&D and for new firms in the biotech industry the amount of revenues is often not substantial. With that said, firms within this industry are often required to merge with each other as an exit strategy, especially for firms acting in the first critical years of its existence. Consequently, there might be two different sides from using M&A as a strategy. One is that there are larger firms and multinational corporations that might use M&A as a strategy to increase innovation instead of investing in R&D. The other is that there are smaller start-ups with high R&D rate that might use M&A as an exit strategy (Faulkner et. Al 2012).
2
1.1 Background
Successful and efficient R&D is highly important for doing successful business in the biotech industry. The term R&D refers to activities that are conducted in order to improve already existing products or services and also in order to create new products and services. R&D contributes to sustainability, learning curve effects, creativity, innovation, spillovers and competitive advantages. However, firms need to be able to forecast future problems and demand to provide the right inventions. Money linked to R&D is seen as investments instead of expenditures because they will hopefully contribute to financial returns in the future (Ganapathy, 2014).
The idea of using M&A to achieve higher innovation, without investing more in R&D, is that large and successful firms take advantage of smaller and highly innovative firms and vice versa. The acquirer needs innovation and can instead of doing it by themselves, use a firm that are a specialist in order to be able to focus on its core products itself. The target on the other hand thinks alike except that it needs advertising and a brand name to be successful and make profit, and is therefore also using the acquirer (Szücs 2014).
Figure 1 displays how the number of M&A:s in the biotech industry in Sweden between publicly firms has changed during the years 2000-2015. The figure show that number of M&A between the years 2000 and 2012 goes up and down. However, there is a constant increase from year 2012 to year 2015.
FIGURE 1 . Number of M&A in biotech firms in Sweden between the years 2000-2015(SOURCE: COLLECTED DATA FROM ANNUAL REPORTS) 0 1 2 3 4 5 6 7 8 9 2000 2001 2002 2003 2004 2005 2006 2007 2008 2009 2010 2011 2012 2013 2014 2015 N u m b er o f M & A Year
3
When it comes to the effect of M&A:s on the level of R&D expenditure in a company, previous studies shows that the result fluctuate. One study that displays negative relationship is Szücs (2014), who finds that firms decrease their R&D efforts and R&D intensity for the acquirer after a merger. However, Al-Laham et.al (2010) shows positive relationship between M&A and R&D.
1.2 Purpose and research question
As mentioned in the introduction, innovation is seen as an important aspect to have in mind for firms to stay competitive. Consequently, a pattern where large corporation wants to stay innovative but at the same time rarely conduct early-stage scientific research has been established. Majority of previous literature focus on the US market and the European market and since the result from previous studies are ambiguous there is a need to further investigate the relationship between M&A and R&D intensity. Additional, there is a research gap when it comes to the Swedish biotech market. Therefore the main purpose of this thesis is to investigate how M&A activity in Swedish biotech firms affects their R&D intensity. Since most previous studies are made within the high-tech industry we choose to focus on the biotech industry. Further, this thesis partly aims at documenting M&A activities in 14 different firms within the Swedish biotech industry between the years 2000-2015.
A second part of the purpose is to analyze how these M&A activities have influenced the firm's R&D intensity throughout the last 16 years. The sample of our biotech firms is smaller than previous studies, mostly made in the U.S, but the advantage of this investigation is that all the data was collected exclusively for this thesis. In that sense, this thesis will contribute to a better overview of R&D expenditure and M&A activity in the contemporary Swedish biotech sector. It will also contribute to literature studying the relationship between these two phenomena.
The research question for this thesis is therefore:
What effect will M&A activity have on firms R&D intensity in the Swedish biotech industry?
1.3 Delimitations
As we identified several papers dealing with the effects of M&As in the U.S setting, the first delimitation was to focus on the Swedish market where a research gap was spotted in this subject. Thus, a second delimitation was a further focus on a specific industry, namely the
4
biotech industry. This thesis is focused on firms that are registered on the stock market. This was done to get a good representation of the biotech industry. During the collection of data, some problems arose because the data was not as available as desired. Hence some firms had to be eliminated from the data due to the amount of missing values or that they had deficient information regarding R&D expenses. This is since the dependent variable in this study, R&D intensity, is calculated partly from R&D expenses.
1.4 Assumptions
Some assumptions that have an underlying effect on the results are that the firms used in this study have made reliable and correct annual reports between the years 2000-2015. Also, that the calculation of missing values gives an approximate picture of the values in reality. Further it is assumed that firms who engage in M&As do so in order to achieve similar benefits and that firms work in the best interest of the firms and not of individuals. Lastly, a set of largely standardized assumptions of the statistical properties of the sample when conducting and interpreting the econometrical analysis were made.
1.5 Sustainability
The definition of sustainability is to meet the needs of today without comprising the needs in the future. To manage this, three pillars of economic, social and environmental sustainability have to be considered (OECD, 2003). So, for an industry to be economically viable it creates profits, value and growth by the use of capital. Social sustainability refers to ethics and responsible care, while environmental sustainability focus on clean and efficient processes and products in order to prevent pollution. So in order to create wealth, industries have to consider sustainability (OECD, 2001). R&D activity is highly relevant when it comes to sustainability in several aspects. One aspect is that biotech inventions can contribute to a more sustainable environment. This is because tools of biotech adapt organisms, products, systems and processes in order to create environment-friendly eco-efficient processes and products. Another aspect might be from a society point of view in the sense that R&D could be focused toward life changing innovations where social sustainability is vital. The overall level of private spending on R&D, as investigated in this thesis, is therefore an important societal factor. However, this thesis will not specifically address the question about how M&A and R&D can affect sustainability.
5
1.6 Disposition
This thesis begins with a theoretical framework that has functioned as a base for the study. In this section, M&A waves throughout the history are first explained as a background for where the appearance of M&A was spotted. In the same section, different incentives for choosing M&A as a strategy is defined in order to get an understanding for what motivates firms to use it. This is followed by a literature review on how M&A affect R&D intensity and a description of M&A in the biotech industry.
Next section in this thesis is data and methodology. It begins with a short introduction and then goes further into explaining the validity and reliability of this thesis. To be confident in our results and findings it is important that the thesis is constructed with high levels of both validity and reliability. Next step in this section is the description of the research design and where the data was found. This brings us further and describes how this data was collected. The collection of data is divided into an introduction and then a description of the different variables that was used in the model. After this, the thesis contains an explanation of the empirical models, estimated though ordinary least square (OLS) techniques, that were used in this thesis. The following section presents the results, followed by an empirical analysis. The thesis ends with a conclusion and suggestion for future research.
6
2. THEORETICAL FRAMEWORK
This section will present the theoretical framework. It begins with an overview of M&A throughout history, explaining the different M&A waves followed by a section discussing the different incentives to engage in M&A activity. The chapter will end with a section displaying the different strategies to have in mind when constructing an M&A.
2.1 M&A waves throughout the history
The market for corporate control often refers to M&A when one firm acquires another. The global market is averring about one trillion per year in transaction value. Throughout the history there has been different merger waves, which often correlate with the economic contractions and expansions. Each peak of the different merger waves has been characterized by different typical kind of deals and has occurred in the 1960s, 1980s, 1990s and 2000s. The wave that occurred in the 1960s is called the “conglomerate wave” since firms often acquired firms in unrelated businesses. They tried to achieve financial advantages by mergers since the belief at this time was that managerial expertise could transfer across business lines (Berk & DeMarzo, 2013).
The next wave that occurred in the 1980s where firms who acquired poorly performing targets and then sold off its individual business units. The units were sold for a higher price than the acquisition price. Thus the wave is called “bust-up”. Moving towards the 1990s the acquisitions became a part of a strategic move, where the strategy was to acquire firms in related business to be able to expand globally. Therefore, the wave is referred to as the “strategic” or “global” wave. The merger wave in 2000s was marked by consolidation, for example mergers between telecommunication and software companies. Due to the financial crisis in 2008 the last wave had an abrupt end but recent years have shown some recovery (ibid).
7
2.2 Incentives to engage in M&A activities
There are many different motives to engage in M&A. The most common motives are the possibility for achieving economies of scale or economies of scope, vertical integration, expertise, monopoly gains, efficiency gains or tax savings. What they all have in common is the belief that each motive will generate greater profit for the firm. These incentives will be described in the following section.
In order for an acquisition to be carried out, the acquirer pays a premium price for the target. However, for this investment to be worth it, the acquirer must add economic value to the acquisition. As previously mentioned there are several incentives to acquire a target. One of them is economies of scale, which means that a large company can achieve savings due to higher production volumes. One example of this is that a machine in the production requires a certain investment when being bought, but this investment will not be higher if one would use it more in order to produce higher production volumes. They can also achieve advantages such as distribution and marketing of products with, to some extent, related products. This is called economies of scope. A firm can take advantage of introducing a new product if it is related to another product. This is because it can avoid some initial costs of starting a marketing campaign if it uses an already existing one. On the other hand, there are difficulties by having a large firm as well, such as costs associated with size and the ability to manage a firm of bigger size. There is often a large gap between the CEO and the operation of the firm, smaller firms can often react faster to changes in the economic environment (Berk DeMarco, 2013).
Another reason why acquirers pay a premium for a target is that they can attain tax savings from operating losses. When a firm uses M&A, a loss in one section can be offset by a profit in another section. Therefore, M&A often have a tax advantage over firms by operating alone. The reason for why this is working is because firms must pay taxes on their profits but not on losses (ibid).
Additional possible incentive for M&A activity is the possibility of vertical integration, which is when two firms merge and work on different stages in a production line. One advantage of vertical integration is that firms get a higher level of control of the production. Examples of this are control over distribution channels, production process, sales, etc. It is easier to achieve
8
coordination because both firms, together, work towards the same goal. As with previous incentives, there are also difficulties in running a large organization and there are both pros and cons by vertical integration as well (ibid).
To be competitive, firms need expertise. One way to receive expertise is to hire individuals with skills that can be of interest for the firm. However, in a market with high innovation and new technologies, this may not be enough because it can be difficult to hire skilled individuals within a yet unknown technology. In that sense, it can generate higher value for a firm to acquire another firm with an already existing unit (ibid). Due to this, firms in the biotech and high-tech industry often use M&A in order to reach new levels of innovation because the market demands rapid changes of new products and services (Faulkner et.al 2012).
Another motive for M&As are monopoly gains. This means that a firm can reduce competition by acquire another firm within the same market, which will increase the market power for the acquirer. The cost of monopoly gains is paid by the society so there are antitrust laws, which works against such activity. Without antitrust laws, one could expect that merging firms would be common but at the same time, the acquiring firm is the only one paying for the costs associated with a reduction of competition. An example of such a cost is the cost of integrating one firm into another. Hence, all firms who are not engaged in the acquisition will benefit from it due to reduced competition in the market (Berk & DeMarzo, 2013).
Efficiency gains are another incentive for firms to use M&A as a growth strategy. This incentive often comes as an effect from an elimination of duplications. Acquirers often believe that they can achieve a more efficient organization than the previous targets management was able to (Berk & DeMarzo, 2013). Szücs (2014) further argues that M&As also reduce spillovers. He also states that the change of organizational structure and requirements that a merger brings could make economies of scale/scope to diseconomies if it is not taken care of correctly.
One more significant reason why firms sometimes choose to use M&A is because they can diversify. Diversification means that different problems or scenarios are spread out over a larger organization. Problems like this are risks, liquidity entrancement, debt capacity and costs of debt. The benefit of using M&A is that one can achieve a reduction of these
9
problems and risks. The risk reduction is achieved from the fact that firms of larger size can reduce the idiosyncratic risk (when firm-specific information result in variation in a stock’s return). (ibid)
However, investors can buy shares from two different companies and get the same result and benefit of diversification as M&A. The stockholders may not benefit when it comes to diversification when the firm choose to use M&A if they already have a diversified portfolio. It may be more profitable for the investors to have a diversified portfolio of their own instead of investing in M&A activity, due to costs associated with firm size. Common firm size costs are agency costs (costs associated with conflicts of interest) and resource inefficiency costs. By diversification the firms can use the same level of leverage and still reduce the probability of bankruptcy. To enable tax saving, larger firms can borrow even more. As always, in order for the M&A to be successful, the pros must be more than the cons. In this case the acquirer have to weigh the benefits of all these incentives against the disadvantages of running a large organization. Nevertheless, one incentive for the shareholders to be positive about M&A is that they can get their investment cashed out and invested in a new, more diversified, portfolio and therefore achieve a risk reduction (ibid).
Moreover, there are also some managerial motives to use M&A as a strategy. A majority of the incentives to use M&A are seen from an economic perspective but there are some other incentives as well. One example is conflicts of interest. This is when managers choose to run a larger firm in order to achieve some self-prestige and higher salary instead of running the business in the best interest of the firm itself. The problem is that the CEO of a firm often does not own enough in order to care about the costs of a bad merger. This is because the benefits of income and prestige are higher. The board of directors creates these incentives for managers due to the size of the firm and a belief in this strategy. Unfortunately, the monitoring problem with the manager can lead to an M&A that performs unsuccessfully. Another scenario is overconfidence among individuals ability. Individuals rarely learn from one mistake if he/she believe that their skills are above average, but instead must repeat it several times in order to learn from it. In M&A activity the problem is that, on average, a CEO run only one acquisition of larger size in his/her carrier. Another possible reason for overconfidence among managers is fear of losing importance and to be unpopular. It can be fear of not being creative and brave enough in order to run a firm in another direction
10
compare to its competitors (Faulkner et.al 2012). In this case managers think they are performing in the right way for the shareholders but have trouble to estimate its own abilities. In the conflict of interest case, the manager knows they are being unfair to the shareholders but act anyway due to personal gain (Berk DeMarco, 2013).
2.3 M&A as a strategy
There are many different aspects to consider before engaging in M&A activity to minimize the problems that can arise. One aspect to have in mind is the integration process of a new knowledge base, which can bring some problems. For companies with high knowledge that can be difficult to transfer, in other word tacit knowledge, can lead to some disruptions of existing innovation within a firm. This is because the process is complex and will be time consuming and risky (Cloodt, Hahedoorn & Van Kranenburg, 2006). Therefore, the acquirer will have to take resources from regular innovative activities and spend it on this integration process (Ahuja & Katila 2001). Due to difficulties in the knowledge absorption process, Hagedoorn & Duysters (2001) argues that a change in how the acquirer organizes their research is required but that this also can be counterproductive. There has to be a balance between knowledge and the capabilities in an M&A because if they are too similar the reward will not be sufficient and they could both be better off. The knowledge base of both the acquirer and the target should neither be too similar nor too diverse. If this balance is successfully managed, and M&A may strengthen the knowledge base of the merging firms, but also make room for learning opportunities (Cloodt, Hahedoorn & Van Kranenburg, 2006).
Before engaging in M&A there are some aspects to consider. One characteristic of M&A targets is often that they are highly innovative with approximately between 8-12 percent pre-merger R&D intensity. It is also desirable to have pre-merger targets that have impressive technology portfolios that are not yet properly commercially exploited. The acquirers are instead known to be large and profitable firms. Bertrand (2009) argues that M&A saps intensity and budget from the R&D department for the first three years and after the R&D budget and intensity will start to increase. Desyllas and Hughes (2010) further emphasize that horizontal mergers show higher performance than vertical mergers.
The most common strategy for acquirers is to focus at leveraging the already existing innovative activities and not to further create new innovations. Growth with respect to profits
11
does not have a significant effect on R&D expenditures. However, growth with respect to sales or employment rates has a positive effect on R&D spending. With this in mind, previous research suggests that firms often aim at sustaining a constant R&D ratio regarding sales and employment. After two firms have merged, this ratio will decline with approximately 3-4% for both firms. Average R&D growth is, despite this, positive, due to higher sales rates (Szücs 2014).
By using M&A as a strategy, firms can get a faster access to technologies, distribution channels, market positions and products. These pros are some of the reasons why the amount of M&A:s has increased during the recent years, especially in the biotech industry. The biotech industry requires specialized skills and knowledge, rapid innovation and complex technology. Therefore, M&A is a commonly used growth strategy in the biotech industry in order for firms to stay competitive (Al-Laham, Schweizer & Amburgey, 2010). M&A is also used as a strategy to increase knowledge and product varieties but also to reduce R&D expenses. It is therefore seen as an external foundation to achieve innovation within a firm and to increase a firm's patenting speed (Al-Laham, Schweizer & Amburgey, 2010). With that said it is difficult to transmit the intensive knowledge that is representative for the biotech industry (DeCarolis & Deeds, 1999).
Due to the significant investment that is required for an M&A, some executives may choose to invest in other areas such as R&D, advertising or quality control (Hitt et. al 1991). According to Franko (1989), long term performance is positively affected by investments in R&D. Acquisitions can intervene with a firm's R&D work in the sense that it is changing the pattern of innovative activities. It is then reducing investment incentives in R&D, which can have a negative impact on long-term performance (Hitt et. al 1991).
As previously mentioned, managing acquisitions requires balance. Acquisitions create opportunities to explore new markets, larger markets share and economies of scale/scope. With the right time preferences a firm can achieve the best of both worlds. Previous studies emphasize that acquisitions can be used as a substitute for innovation among managers. Over time, acquisitions may experience a decline of innovativeness and this could be an effect of high turnover at the targeted firm. Previous studies have also showed that if a firm has lower R&D investments than its competitors, it will lose market shares (ibid).
12
3. LITERATURE REVIEW
This section will present a literature review about M&A effects on R&D. The chapter will begin with a display of previous studies on how M&A can affect R&D activity. Followed by a section displaying studies on M&A activity in the biotech sector. The chapter will end with a summary table of previous studies made on the subject.
3.1 The effect of M&A on R&D activity
There are various actions that can affect R&D activity and M&A can be seen as one action that can reorganize R&D activity. By retrieving new technological assets and greater knowledge base from M&A activity, firms can reorganize their R&D programs (Capron, 1999). Nevertheless, there are no clear answers when it comes to how M&A effect R&D activity and from a theoretical point of view, the impact from M&A activity on R&D activity is still ambiguous. Bertrand & Zuniga (2006) attempts to investigate the relationship between M&A activity and R&D investment. They investigate how domestic and cross-border M&A in various industries affect R&D investments in OECD countries. They state that there are both positive and negative aspects when it comes to the impact of M&A activity on R&D. On one hand, firms can enhance their R&D efficiency with scale and scope economies, leading to a progress in firms R&D capabilities. On the other hand, diminishing competition reduce the incentive to engage in R&D. Consequently, diminishing incentives to engage in R&D can be a problem since R&D plays a crucial role when it comes to both economic growth and industrial performance (Bertrand & Zuniga, 2006). Another argument of how M&A affect R&D is that after an acquisition, managers are less engaged in firms’ innovation and become more risk-averse. This could be due to an increase in the firm's performance (Hitt et. al 1991). Baysinger and Hoskinsson (1989) argue that leverage affect R&D intensity in a negative way and acquisitions is often financed with debt.
R&D and innovative activity is regarded as an important future when it comes to economic growth and improvement in productivity. Recently, the effect of international M&A on R&D has been explored. One example is Stieble’s (2013) study which aims to analyses how investing firms R&D performance are affected by M&A activity.
13
Stieble’s (2013) intention was to investigate how cross-border M&A affect the domestic R&D activity on the acquiring firm by collecting data from balance sheets together with data from a M&A database from German firms, which is one of the world’s most technologically advanced countries. There are two different perspectives on how cross-border M&A affect R&D. For the home country, cross-border M&A can have a negative effect on R&D if the innovative activities are replaced by investments abroad. On the other hand, the transfer of knowledge from M&A can improve technological capabilities, which can improve the R&D activity. Furthermore, in a study performed by Stieble & Reize (2011), on cross-border M&A and innovation activity in the targeting firm, a negative relationship between M&A and innovative activities are displayed. They state that there is a large and significantly negative relationship between foreign M&A and the propensity to invest in R&D. The reason for this outcome might be reallocation of the R&D activity or rationalization. The R&D department might move to the acquirers headquarter since it is a study of cross-border M&A (ibid). Ornaghi (2009) state that M&A can affect R&D output, which in turn influences innovation output through different channels. First, M&A activity can lead to a reduction in research cost by eliminate duplication of research. Secondly, M&A can create knowledge synergies. One scientist’s discoveries can inspire other research activity in another field, which might stimulate the overall R&D activity. Consequently, these arguments imply that M&A should have a positive effect on R&D productivity. However, M&A often result in a reduction of number of researchers, which in the long run can influence the innovation performance in the company. Ornaghi (2009) performed a study of pharmaceutical companies between the years 1988-2004 and the result shows that on average the R&D performance is worse for the companies that have engaged in mergers. The study display that companies that have engaged in mergers have poorer performance when it comes to R&D than companies that has not engaged in any mergers.
Previous studies show different arguments concerning how M&A affect R&D activities and why firms choose to engage in M&A activity. According to Blonigen &Taylor (2000) there are two different strategies for firms that want to grow. One is to invest in internal R&D and the other is to engage in M&A activity. It is called the “make or buy” strategy and it is a strategy that can change over time. For example, in the short run the firm gets in to trouble and have to change the strategy.
14
The pros and the cons with the “make or buy” strategy remains ambiguous but according to Blonigen &Taylor (2000) there is a negative relationship between M&A and R&D intensity. In high-tech industries, a firm with higher R&D intensity is less likely to engage in M&A activity. There is a superior inverse relationship between M&A and R&D intensity in high-tech industries than in less high-technological industries. The explanation for this might be that high-tech firms have different strategies to develop; either invest in M&A or in internal R&D (Blonigen &Taylor 2000).
Desyllas and Hughes (2001) argue that there has been an increase of global acquisition the recent years. They state that it probably depends on the expecting benefits from such acquisition involving both financial and innovations performance. In their article “Do high
technology acquirers become more innovative?” they study how companies can become more
innovative through acquisitions. They also analyze which different factors that can improve absorptive and financial capacity to benefit from acquisitions. By studying both the impact on R&D productivity and intensity they analyse how acquisition affect the acquirer's innovation performance (Desyllas & Hughes, 2010). They use unbalanced panel data from US publicly traded firms including high technology firms where they choose different SIC codes to categorize different industries. The data consist of information on companies’ acquisition activity. From this data, they test different hypothesis that they have set up. To be able to study companies’ innovation performance they measure R&D expenditure with help of successful patent applications. Their result shows that there is a positive synergistic effect on knowledge base size and change in the R&D productivity in related acquisitions and the opposite in unrelated acquisitions. The sample cover three post-acquisition years and shows negative to neutral effect when it comes to R&D productivity but they also find a neutral to positive effects on R&D-intensity. They argue that time affect R&D intensity and productivity. During the first year, there is negative result but during the later years the result shift to positive. When it comes to the relationship between acquisition and the companies’ knowledge base the result is positive during all three years after the acquisition (Desyllas & Hughes, 2010).
15
3.2 M&A in the biotechnological sector
According to Faulkner et al. (2012) the use of M&A as a growth strategy has increased in recent years in the biotechnological sector. The reason for this is partly because the demand has increased for rapid innovation and contingency in knowledge. New patents have made it difficult for firms to make it themselves and to be competitive in the market. The use for M&A has shown its presence especially in the biotech industry through the last M&A wave. Biotech firms require huge investments and high innovation intensity to be competitive. Therefore, it has been common that small firms use this as a strategy to exit and large firms use it to reduce R&D expenses. For small firms, the first five years are the most critical and therefore, M&A can be a way for small firms to finance resources and to gain competence in different scientific and technological fields (Faulkner et. al 2012).
An important aspect to consider when pursuing with an M&A is to acquire diverse external knowledge. The critical part with this knowledge is how to enable it in order to achieve innovative performance. If the acquirer accomplishes to use the targets knowledge they will receive a competitive advantage (Cloodt, Hahedoorn & Van Kranenburg, 2006). In the biotech industry, with complex knowledge and skills, the acquirer is dependent on its absorptive capacity (Cohen & Levinthal, 1989). According to Ahuja and Katila (2001), the success when acquiring a knowledge base lies in the size and how wide and complex this knowledge is. Cassiman et al. (2005) further argue that the success also lies in size and similarities of R&D inputs or other innovative actions.
On the contrary, a study by Lin & Jang (2010) argues that M&A in the high-tech medical device industry can increase the innovation performance for the acquiring company if the acquired firm is in the same industry and have same proximity in terms of their technological field. Further Lin & Jang (2010) study M&A in the biotech industry. Their result show that companies that use M&A as a strategy to maintain versatility and increase patents in closer proximity to their own technology field benefit from M&A. Also, their innovative performance increases (Lin & Jang 2010).
16
Rossi et al. (2015) study how M&A between biotech firms and pharmaceutical companies affect stakeholder value in a company. They state that the turbulence in the economy and the trouble for the biotech sector to find investors have increased the incentives to engage in M&A with pharmaceutical companies. Further they discuss how the result differs and that there is a mixed result from how M&A affect the company. They also explain that another reason for the increase in the number of M&As between biotech firms and pharmaceutical firms is the lack of innovation in pharmaceutical companies (Rossi et al. 2015).
Therefore, M&As between pharmaceutical and biotech firms can be beneficial. The pharmaceutical firms contribute with capital from already existing sales. The biotech firms can contribute with their R&D work to solve the problem pharmaceutical companies faces with a dried-out patent and a product pipeline. It is more cost effective for pharmaceutical companies to engage in M&A with biotech firms that can contribute with new product platforms than developing these products from scratch. M&A activities can be seen as a shortcut in product development and a strategy to stay ahead and increase innovation in a company. However, to be able to create high firm performance, strong strategic target identification will be vital, where due diligence and post-merger integrations will be central (ibid).
James (2002) discusses the management difficulties regarding using M&A as a strategy to achieve increased company value and transfer non-marketable resources between companies. In a study of M&A activity in large pharmaceutical companies, they find that the result from M&A does not correspond to the expectation. The problem lies in the challenges to evaluate the performance which often is ambiguous. Further, the integration between two firms can be difficult due to imperfect information and tacit knowledge. The cost savings from M&A is often a short boost to profitability but it is uncertain if M&A can create a long-term platform for future business growth. One incentive to engage in M&A is the possibility to transfer R&D capabilities. By acquiring a company for its R&D portfolio the acquirer can tackle the problems with growing cost of new technologies and drug development. The belief is that it is cheaper to acquire R&D capabilities than to invest in R&D. Furthermore M&A can also be an opportunity to improve performance and competitiveness in a highly competitive market. Nonetheless the result from M&A differ and often the outcome does not equal the expectation from the M&A. To succeed with an M&A the management regarding integration is vital (James, 2002).
17
Furthermore, along the same line Demirbag et al. (2007) state that despite mixed experiences of the result from M&A activity, pharmaceutical firms continue to use M&A as a strategy to create value and stay ahead in the industry pressure where the largest competitor only has a 10-percentage share of the global market. Their research compares pharmaceutical companies that have engaged in M&A activity with other pharmaceutical companies that have not. Their results show no value creation regarding profit margin, return on investment and research productivity in a company through M&A. They argue that the reason for continuously increasing M&A activity is the belief that M&A provides an easier and faster way of achieving value for the company. The belief that M&A will lead to higher research productivity and increased value for the company comes from the manager but there is no theoretical proof of such result. The process of M&A is complex and the pros and cons should therefore be carefully examined before engaging in such process (Demirbag et al. 2007). The findings of previous studies presented in this chapter on M&A and R&D are summarized in Table 1.
18
TABLE 1.SUMMARY OF PRIOR STUDIES ON M&A AND R&D
Study Purpose Industry Location Findings
Rossi et al. (2015). Analyze the phenomenon of (M&A) in high-tech sectors
Biotech USA and Europe
It is a rigorous process for the acquirer to create a sustainable shareholder value and high firm performance
Stieble (2013) Analyse the impact of cross-border acquisitions on domestic R&D expenditures of the acquiring firms Various industries, little focus in high-tech Germany and cross border
Cross-border acquisitions have a positive effect on R&D intensity
Stieble, and Reize (2011) Examine how innovation activities in target firms is effected by cross-border mergers and acquisitions
Various industries
Germany and cross border
Negative effect on R&D activities
Al-Laham,et al. (2010) Study if acquisitions contribute for innovation in the biotech industry
Biotech USA M&A has a positive effect on R&D
Lin and Jang (2010) Analyse M&A effect in the biotech industry
Biotech USA M&A can help the innovative performance but it is important to still invest in R&D Desyllas and Hughes
(2010)
Study whether acquirers become more innovative from acquisition
High-tech USA First a decrease in R&D and then an increase for acquirers Ornaghi (2009) Analyse the effects of mergers on
R&D activity
Pharmaceutical USA Mergers have a negative effect on R&D efforts and
performance Bertrand (2009) Examine the causal effect of
foreign acquisitions on R&D activities of domestic target firms
Varies industries
OECD countries
Positive effect on R&D spending for targets
Cloodt et al. (2006) Analyse the post-M&A innovative performance of acquiring firms in four different industries
High-tech Worldwide Negative effect on R&D within nontechnological acquisitions
Bertrand and Zuniga (2006)
Examine how national and cross-border M&A effect private R&D investments in OECD countries
Varies industries
Europe, Canada, Japan and USA
M&A has a small effect on industry-level R&D investments Cassisman et al. (2005) Analyse how technological and
market-relatedness between M&A partners affects the R&D process.
High- and medium-tech
Europe Mergers has a positive effect on R&D
Ahuja and Katila (2001) Study how acquisitions effect the innovation performance of the acquiring firm
Chemicals industry
Worldwide M&A has a positive effect on R&D
Blonigen and Taylor (2000)
Study the relationship between R&D intensity and M&A
High-tech USA A negative relationship between R&D intensity and M&A
James (2002). Study how M&A can be used as a strategy to transfer non-marketable resources
Pharmaceutical Europe and USA
M&A can achieve short term boost to profitability but it is difficult to distinguish if it will last
Hitt et al. (1991) Investigate how M&A affect company performance and if it leads to lower investments in R&D
Varies industries
USA M&A has a negative effect on R&D intensity
19
4. DATA AND METHODOLOGY
The purpose of scientific research is to produce new knowledge and to describe the new knowledge in a systematic way. Consequently, it is important to choose a method that will enable the study to answer the research question in the thesis. Additional it is important that the method used is applied with awareness of its advantages and disadvantages. This chapter will present the methodology used in this thesis and argue why we choose it. It will also present and describe the collected data and variables. The chapter will begin with a brief discussion of validity and reliability followed by a section describing the research design. Furthermore, a description of the collected data will be presented and the chapter will end with a description of the different variables and methods used in this thesis.
4.1 Validity and reliability
To ensure high quality of research it is important to reflect over the validity and reliability of the study. Validity can be described as the absence of systematic measurement errors and it can be divided in to internal and external validity. Internal validity exists when the measurement equipment such as a questioner measure what it intends to measure. External validity can be described as how the study can be generalized to other situations. If the result from the study can be generalized the study has high external validity (Lundahl & Skärvad, 1999). This thesis use a multivariate econometric model, estimated through ordinary least squares (OLS) techniques (further explanation of the used model is found later in this chapter) to investigate the relationship between research intensity and M&A activity. Econometric models of this type can be useful to make predictions of how variables affect each other. However they are simplified reflections of reality, which is an argument many use to criticise the method. Nevertheless, a method used in research should be judged after the accuracy of its predictions and not by its assumptions (Blackford, 2016). To concretize our research is more likely to have higher internal validity than external validity. Because the numerous external affects that can mark the research intensity for a firm. Examples of this could be the general economic environment, the corporate culture between too firms or legislations.
20
Since we will examine the relationship between the chosen variables of the model, which will be clearly described and present in the model, a chance for higher internal validity exists.
High-quality studies need both high validity and reliability. Reliability can be described as the absence of random measurement errors. A study with high reliability characterizes low risk for coincidence affecting the study. It also highlights the essential for objectivity (Lundahl & Skärvad, 1999). To attain high reliability in this thesis the theoretical framework, academic articles and collected data were chosen carefully. The academic articles were the most recent ones and the theoretical framework point at the same direction. Our assumptions were clearly stated and in line with earlier studies. The data collected comes from a list with public biotech firms in Sweden and the annual reports for each company is collected. There is no reason to doubt the reliability of the annual reports and collected data since we used a systematic approach (a more detailed description will be found later in this chapter).
4.2 Research design
The main purpose of this thesis was to study how research intensity is affected by M&A activity in Swedish biotech firms. A quantitative method was used where financial data from annual reports has been collected. Therefore, the thesis relies on secondary data, which we collected from each company’s annual reports between the years of 2000-2015. We gained access to the Retriever database where all companies’ annual reports for each year were available. We downloaded and analysed a total of 224 annual reports. The collected data was then transferred to STATA where we analysed the data by using regression analysis. Since the data is collected between the years 2000-2015 it is a panel dataset, which allow for an overview of fluctuation over time and forecasts. Another important feature of panel data is the possible presence of dynamic relationship between variables meaning that the change in a variable can have an impact on itself or other variables in one or future time periods (Griffiths et al. 2011). M&A activity might not have an instantly effect on research intensity, it can be spread or distributed over future time periods. Therefore, a model with lags will be used in this thesis, which will make it possible to study how research intensity is affected by M&A activity.
21
4.3 Collected data
The selected companies for this thesis comes from Bolagsfakta’s (2017) list of biotech firms since the purpose for this thesis is to study how M&A affect the research intensity in Swedish biotech firms (see appendix for full list of companies). Companies that were younger than 16 years or didn’t have any M&A activity and companies where the annual reports were inaccessible were removed from the list. After the screening, there were 14 Swedish biotech firms left. The data collected from the annual reports were in line with earlier studies (Szücs, 2014). M&A activity, R&D expenditures, sales, debt, employees, age, assets and profit for each company and year. Before putting the data into STATA we discounted all the values in money for the inflation using SCB’s (2017) consumer price index.
The variables used in this thesis have been chosen in line with the paper made by Szücs (2014) and other theories presented in this thesis. Our main dependent variable was research intensity, which is a ratio between R&D expenses and total sales. Our explanatory variables were sales, total assets, number of employees, profitability (which is the ratio of net income to total asset), R&D growth (the growth rate of R&D expenditure defined as the percentage change in R&D expenditure between two consecutive periods), debt, age, number of acquisition and acquisition value. Table 2 gives a brief description of each variable used in this thesis and what expected impact each variable has. When studying the relationship between the variables we test different dependent variables and explanatory variables. This is because some of the explanatory variables describe the same objective such as number of acquisition and acquisition value or research intensity and R&D growth. In the regression analysis, we also take logs of assets, debt and sales to regularize the data. Additionally, we generate a variable for the variable employees as a ratio of sales.
22
TABLE 2.VARIABLE DESCRIPTION
Variable Description Expected impact on research intensity
Dependent variables:
Rd_intensity Reaserch intensity, the ratio between R&D expenses and total sales
Rd _growth The percentage change in R&D expenditure between two consecutive periods
Rd_exp A companies R&D expenditure each year
Explanatory variables
Company_id Each company has been given an id number
Sales Total sales for each year Positive
Assets A company’s total assets each year Positive
Employees Number of employees Positive
Profitability The ratio of net income to total assets Positive
Debt A company’s total debt Positive/negative
Age The age of the company Positive/negative
Nb_acq Number of acquisition made in each year Negative
Acq_value The value of the acquisition made each year Negative
Salesemploy Sales/employees Positive
Year The years between 2000-2015 Negative
Missing Values 38 missing values calculated by using average annual growth rate.
The variables of main interest in this thesis are the dependent variable R&D intensity and number of acquisition (nb_acq) which is chosen in line with Szücs (2014) study. The explanatory variable nb_acq were chosen to enable a study how M&A affect R&D. The belief is that nb_acq will have a negative impact on the variable rd_intensity.
Most of the values collected from the annual reports were sufficient but for some years and variables, information was missing. Therefore, a calculation for missing values was necessity. To calculate this, we needed to use values from four years after the missing value in order to calculate an average annual growth rate. First, we calculated the growth rate in percent from year t+1, t+2 and t+3 by dividing the variable from the ending year by the previous year. This is displayed in Equation 1.
23 𝑔 =𝑡1
𝑡 (1)
Next, the average annual growth rate was calculated according to Equation 2. Average annual growth rate (AAGR) can be calculated by adding the growth rates of t+1, t+2 and t+3 and then divide this by three.
𝐴𝐴𝐺𝑅 =(𝑔1+𝑔2+𝑔3)
3 (2)
Last, the missing values are calculated by using the variable for t+1 and then divide it by one plus the average annual growth rate that is already calculated. This is shown in Equation 3.
𝑀𝑉 = 𝑦𝑒𝑎𝑟1
1+𝐴𝐴𝐺𝑅 (3)
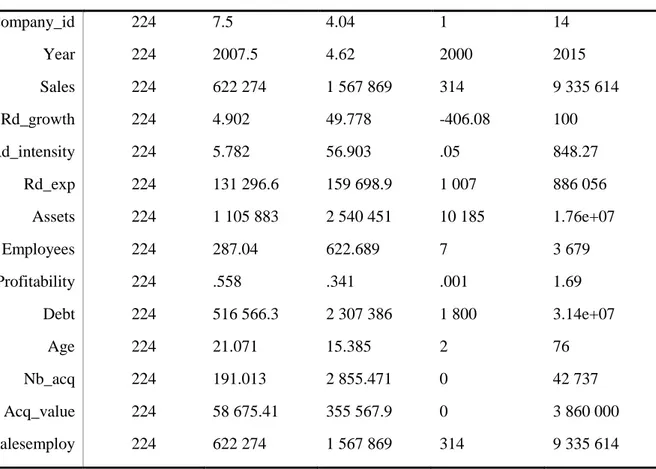
When analyzing the data, one could see that the amount spent by the firms differ a lot when it comes to R&D expenditure. Further, the R&D growth is positive for some firms, while it is negative for others. The trend of R&D intensity throughout these years shows that the ratio has decreased. There are differences in several variables when analyzing the different firms, especially when it comes to number of employees, R&D expenditure, sales, profit and number of acquisitions. The data is summarized in Table 3 where number of observations, mean values, standard deviations, min and max values are displayed.
24
TABLE 3.SUMMARIZED DATA OF THE VARIABLES
Variable Obs Mean Std. dev Min max
Company_id 224 7.5 4.04 1 14 Year 224 2007.5 4.62 2000 2015 Sales 224 622 274 1 567 869 314 9 335 614 Rd_growth 224 4.902 49.778 -406.08 100 Rd_intensity 224 5.782 56.903 .05 848.27 Rd_exp 224 131 296.6 159 698.9 1 007 886 056 Assets 224 1 105 883 2 540 451 10 185 1.76e+07 Employees 224 287.04 622.689 7 3 679 Profitability 224 .558 .341 .001 1.69 Debt 224 516 566.3 2 307 386 1 800 3.14e+07 Age 224 21.071 15.385 2 76 Nb_acq 224 191.013 2 855.471 0 42 737 Acq_value 224 58 675.41 355 567.9 0 3 860 000 salesemploy 224 622 274 1 567 869 314 9 335 614
Table 4 displays the correlation matrix of the variables that was used in the regression. The correlation matrix was done to provide further understanding of the variables, their characteristics and the correlation between the different variables.
TABLE 4. CORRELATION MATRIX FOR THE VARIABLES USED IN THE REGRESSION
Correlations 1 2 3 4 5 6 7 8 9 1 Rd_intensity 1.0000 2 Year -0.0698 1.0000 3 Salesemploy -0.0390 0.1760 1.0000 4 Lnassets -0.0057 0.1562 0.6962 1.0000 5 Lndebt -0.0209 0.2718 0.7222 0.9116 1.0000 6 Age -0.0875 0.3003 0.4556 0.5913 0.5934 1.0000 7 Age2 -0.0494 0.1649 0.3655 0.5693 0.5510 0.9616 1.0000 8 Profitability -0.1522 0.3042 0.1302 -0.1636 -0.0496 0.1050 -0.0194 1.0000 9 Nb_acq -0.0067 0.0799 -0.0154 -0.0039 -0.0185 0.0084 -0.0086 0.0524 1.0000
25
Figure 2 show an overview of how the variable R&D growth (which is the percentage change in R&D expenditure between two consecutive periods) has changed over time for the different companies. The variable has a range between -406 and 100 for the different firms and it is difficult to distinguish a clear pattern. It displays a vague pattern that the variable R&D growth has decreased throughout the years for most of the companies, which is in line with the belief that M&A activity has a negative effect on R&D investments. However, it also displays that R&D growth differ a lot from year to year making it hard to distinguish a clear pattern.
FIGURE 2 CHANGES OF R&D EXPENDITURE IN PERCENT BETWEEN THE YEARS 2000–2015(SOURCE: COLLECTED DATA FROM ANNUAL REPORTS)
To further investigate how R&D has developed for the companies a diagram displaying the variable R&D expenditure, which has a range between 1007 and 886056 (tkr) follows. Figure 3 show how R&D expenditure for the companies have changed between the years 2000-2015. It is still difficult to distinguish a clear pattern of how R&D expenditure has developed throughout the years. Some companies have increased their R&D expenditure throughout the
-410 -310 -210 -110 -10 90 2001 2002 2003 2004 2005 2006 2007 2008 2009 2010 2011 2012 2013 2014 2015
Changes of R&D expenditure in % between the years 2000-2015
cella vision Active biotech AB BioGaia AB
BioInvent International AB Biotage AB Boule Diagnostics AB Elekta AB Karo Pharma Mdivir AB
Orexo AB Ortivus AB Raysearch Laboratories AB Swedish Orphan Biovitrum AB Vitrolife
26
years while the spending of other firms goes up and down and some companies have stayed on the same level.
However, unlike Figure 2, Figure 3 has a rather vague pattern that the variable R&D expenditure has increased or stayed on the same level throughout the years for most of the companies.
FIGURE 3 R&D EXPENDITURE FOR THE COMPANIES BETWEEN THE YEARS 2000-2015 (SOURCE: COLLECTED DATA FROM ANNUAL REPORTS)
0 200000 400000 600000 800000 1000000 2000 2001 2002 2003 2004 2005 2006 2007 2008 2009 2010 2011 2012 2013 2014 2015
R&D expenditure (tkr)
cella vision Active biotech AB BioGaia AB
BioInvent International AB Biotage AB Boule Diagnostics AB Elekta AB Karo Pharma Mdivir AB
27
4.4 Empirical model
It is important to consider the nature of the data when modelling relationship between variables. This thesis consists of panel data meaning that it consists of cross-section units observed over time. To examine the relationship between the collected variables in this thesis an OLS estimator were used. Lagged value of the explanatory variable nb_acq were introduced since the effects from M&A activity may not occur instantaneously. It can be spread over future time periods (Griffiths et al. 2011).
First an OLS regression was conducted with rd_intensity as the dependent variable followed by a regression with rd_growth as the dependent value and lastly a regression with rd_exp as the dependent variable was conducted. The OLS regression with rd_intensity as the dependent variable and rd_exp were carried out with both fixed effects and random effects (a more detailed description will be found later in this section), a hausman test was conducted in order to evaluate which model that was most reliable. Further, there were tests with different explanatory variables. The explanatory variable that was lagged was nb_acq. It was tested with different number of lags, both in the model with rd_intensity as dependent variable and rd_growth as the dependent variable.
Equation 4 describes our empirical model where rd_ intensity is the dependent variable and nb_acq is the lagged explanatory variable. This equation will also be run with rd_exp as the dependent variable, the only differences is that the variable salesemploy is replaced by sales. Equation 4 consists of fixed effects. When using fixed effect in a model the differences are captured by the intercept. Consequently, all the different behavior between the variables, in this case the firms different characteristics, are denoted as heterogeneity between the variables. It is used to “control” for these differences and it is the intercept parameter in a fixed model that do this. It examine if firms with more M&A activity have higher R&D intensity. The subscript i denotes that each β can be different for each firm and the subscript γ denotes that it is a dummy variable (Griffiths et al. 2011).
𝑅𝑑_𝑖𝑛𝑡𝑒𝑛𝑠𝑖𝑡𝑦𝑖𝑡= 𝛼0+ 𝛾𝑦𝑒𝑎𝑟𝑖𝑡+ 𝛽𝑠𝑎𝑙𝑒𝑠𝑒𝑚𝑝𝑙𝑜𝑦𝑖𝑡+ 𝛽𝑙𝑛𝑎𝑠𝑠𝑒𝑡𝑠𝑖𝑡+ 𝛽𝑙𝑛𝑑𝑒𝑏𝑡𝑖𝑡 + 𝛽𝑎𝑔𝑒𝑖𝑡+ 𝛽𝑎𝑔𝑒𝑖𝑡2 + 𝛽𝑝𝑟𝑜𝑓𝑖𝑡𝑎𝑏𝑖𝑙𝑖𝑡𝑦𝑖𝑡+
𝛽𝑛𝑏_𝑎𝑐𝑞𝑖𝑡 − 𝛽𝑛𝑏_𝑎𝑐𝑞𝑖𝑡+1− 𝛽𝑛𝑏_𝑎𝑐𝑞𝑖𝑡+2− 𝛽𝑛𝑏_𝑎𝑐𝑞𝑖𝑡+3+ 𝑒𝑖𝑡 (4)
Equation 5 is like Equation 4 but consists of random effects instead of fixed effects and will be carried out with rd_intensity, rd_growth and rd_exp (when rd_exp is dependent variable,
28
salesemploy will be replaced by sales) as dependent variables. Some firms have negative R&D growth for some years and have high values some years after. One could think that this is due to large investments that were made, which can prevent R&D growth for a while but which will generate high growth in a later stage. The OLS regression with lags and random effects will hopefully give us more information about how R&D growth are affected by the different independent variables. When using random effects it is assumed that the differences are captured by the intercept parameters but the differences are treated as random effect instead as fixed effects. It makes it possible to examine the differences between the firms if firms with more M&A activity have higher R&D intensity. In the random effect model the differences is called random effects and are analogous to the random error term. It consists of the standard assumption that they are uncorrelated across the variables, have constant variance and that they have zero mean. Consequently, the error term is changed to 𝜇𝑖𝑡 , which consists
of the random differences from the population average (Griffiths et al. 2011).
𝑅𝑑_𝑖𝑛𝑡𝑒𝑛𝑠𝑖𝑡𝑦𝑖𝑡= 𝛼1+ 𝛾𝑦𝑒𝑎𝑟𝑡+ 𝛿𝑠𝑎𝑙𝑒𝑠𝑒𝑚𝑝𝑙𝑜𝑦𝑖𝑡+ 𝛿𝑙𝑛𝑎𝑠𝑠𝑒𝑡𝑠𝑖𝑡+ 𝛿𝑙𝑛𝑑𝑒𝑏𝑡𝑖𝑡 + 𝛿𝑎𝑔𝑒𝑖𝑡+ 𝛿𝑎𝑔𝑒𝑖𝑡2 + 𝛿𝑝𝑟𝑜𝑓𝑖𝑡𝑎𝑏𝑖𝑙𝑖𝑡𝑦𝑖𝑡+
29
5. RESULT
We began by running a simple OLS regression without any lags, robust standard errors or fixed- and random effects to test the data. After running this regression some tests were carried out to see if the model was reliable. The first test was a VIF (Variance Inflation Factor) test, which examines the model for collinearity, to eliminate variables that correlate with each other. To test if the variables were randomly correlated a test for heteroscedasticity was carried out. If heteroscedasticity were to be found it can be controlled by using robust standard errors in STATA.
After running the first regression one could see that none of the variables were significant. When testing for heteroscedasticity we could reject the null hypothesis that there is constant variance. Consequently, the test shows us that the regression was heteroscedastic and robust standard errors were therefore used. Next up was the test for multicollinearity, where we used the VIF command. It displayed that the variables lnassets and lndebt had a VIF between 5-10. Age and age2 had a VIF over 10. This suggests that lnassets and lndebt have high correlation that may or may not cause problems, while age and age2 are correlated and poorly estimated due to the collinearity. However, this is not surprising because age2 is the squared variable of age and are only used to correct for non-linear relationships. The mean VIF of all variables was 4.49. In order to see if fixed or random effects were most reliable, a hausman test was conducted. The hausman test for rd_intensity gave us an insignificant result which implies that the random effect model is safe to use1. The same test was conducted for rd_exp as dependent variable and the result was significant, indicating that fixed effect should be used2. Finally, an F-test was carried out for the different lags to test if they were significant together.
Table 5 displays a summarization of the results carried out from the different regressions. We used both fixed effect and random effect models since random effect are estimated with partial pooling while fixed effects are estimated without. In the fixed effect model, identification is based on inter-firm temporal variation in the variables. The fixed effects capture all time-invariant firm- specifics and can answer the question if nb_acq leads to higher rd_intensity. The random effects model enables us to analyze variation across the firms. It can be used to tell if firms with higher nb_acq have higher rd_intensity.
1 Result for hausman test: rd_intensity, Prob>chi2 = 0.7620 2 Result for hausman test: rd_exp, Prob>chi2 = 0.0048