Thermal analysis and
design improvement of
light module fixture
Main area: Mechanical engineering Authors: Henrik Samuelsson, Ronja Lindén Mentor: Tim Heikkinen
This bachelor thesis is performed at Jönköping University in mechanical engineering. The authors take full responsibility for the stated opinions, conclusions and results.
Examiner: Tim Hjertberg Mentor: Tim Heikkinen Extent: 15 hp (credits)
Abstract
Abstract
Introduction
One of the products made by SAAB Avionics Systems in Jönköping was in need of a better cooling solution. The product, a Head-Up Display, holds a LED that was overheating when run at desired input power. The purpose of this thesis was to identify the design weaknesses in the current solution regarding heat dissipation and produce new design proposals that fulfill the requirements. The parts analyzed consist of a LED light source, adjustment plates and a heat sink. The adjustment plates and heat sink where covered in a surface treatment.
Theoretical framework
A simulation of a finite element model was set up of the current solution in order to identify the influence of the different parts and their thermal properties. The simulation was set up as a steady state thermal model. The FEM and steady state equations used during this are mentioned and shortly explained.
The state of modern research was found in order to find new innovative ways of solving the heat problem.
Method
In order to understand the current solution, experiments were carried out. Interviews were used in order to get the correct information easily. A literature study was preformed to understand the different theories.
Reverse engineering was applied to get a detailed understanding of the functionality both mechanically and thermally. Brainstorming was used to generate new solutions, which was followed by a feasibility evaluation and Pugh’s method to sort out the best concepts.
Implementation and Result
Based on the simulations it can be concluded that some of the developed solutions pass the requirements and can be implemented right away. Some need some more work in order to fully pass the demands.
Conclusions
The thermal flow was greatly affected by the properties of the aluminum in the adjustment plates and heat sink, though there was not much room for thickness reduction. However, the oxide layer and the surface roughness also had a great impact on the high junction temperature. The requirements where therefore met when adjustment plates and interfaces were removed, to lower the amount of oxide and air between the LED and the heat sink. But the oxide layers needed to be thinner and the surface roughness needed to be reduced in order to meet requirements.
If the oxide layers need to stay at current thickness or the surface roughness cannot be changed, the heat sink needs to be redesigned.
The recommended concepts were smaller than the current solution. If this space is utilized with a bigger heat sink, the goals can be met with greater ease. There is also room for improvement when it comes to heat sink heat spreader pattern.
Discussion
The discussion covers what knowledge which was needed to write this thesis and how different problems that occurred along its path were solved.
Sustainability in different ways was also discussed. Keywords
Table of content
Table of content
1
Introduction ... 5
1.1 BACKGROUND ... 5
1.2 PROBLEM DESCRIPTION ... 5
1.3 PURPOSE AND RESEARCH QUESTIONS ... 6
1.3.1 Specifications ... 6
1.4 DELIMITATIONS ... 7
1.5 DISPOSITION... 7
2
Theoretical framework ... 9
2.1 FINITE ELEMENT METHOD ... 9
2.2 THERMODYNAMICS ... 9
2.2.1 FEM applied to heat transfer ... 9
2.2.2 Steady state ... 10
2.3 WAYS OF IMPROVING HEAT FLOW ... 11
2.3.1 Vapor chamber cooling ... 11
2.3.2 Heat pipes ... 12
2.3.3 Thermal Pastes ... 12
2.3.4 Design heat sink ... 12
2.4 CONNECTION BETWEEN RESEARCH QUESTIONS AND THEORIES... 13
3
Method ... 14
3.1 METHODS USED IN REPORT ... 14
3.1.1 Experiment ... 14 3.1.2 Literature study ... 14 3.1.3 Interview ... 14 3.1.4 Rapid Prototyping ... 14 3.1.5 Reverse engineering ... 14 3.1.6 Brainstorming ... 14 3.1.7 Feasibility evaluations ... 14 3.1.8 Pugh’s method ... 14
Table of content
3.2 CONNECTION TO RESEARCH QUESTIONS ... 15
3.2.1 Research question one ... 15
3.2.2 Research question two ... 15
3.2.3 Research question three ... 15
3.3 VALIDITY AND RELIABILITY ... 15
3.3.1 Methods ... 15
3.3.2 Source critic ... 16
4
Implementation and Results ... 17
4.1.1 Reversed engineering ... 17
4.2 THERMAL CALCULATIONS ... 18
4.2.1 Absolute Thermal Resistance ... 19
4.2.2 Available thermal Resistance ... 19
4.2.3 Level of influence from oxide and surface roughness ... 21
4.3 ELECTRICAL CALCULATIONS ... 22
4.3.1 Electric insulation ... 22
4.3.2 Power and Power efficiency ... 23
4.4 TEMPERATURE DATA ... 23
4.5 SIMULATION SETUP... 25
4.6 RESULT RESEARCH QUESTION ONE ... 26
4.6.1 Junction temperature dependent on thickness of oxide layer ... 26
4.7 RESULT RESEARCH QUESTION TWO ... 26
4.7.1 Amount of interfaces possible ... 26
4.7.2 Thermal pastes... 27
4.7.3 New concept ideas ... 27
4.7.4 Feasibility evaluations ... 31
4.7.5 Mechanical breakdown of concept 4 and 6 ... 31
4.7.6 Pugh’s matrix ... 33
4.7.7 Usage of vapor cooling and heat pipes ... 34
Table of content
4.8.1 Junction temperatures depending on oxide layer thickness for concept 4 and 6 35
4.8.2 Vapor and heat pipes, concept 4 and 6 ... 36
4.8.3 Change material of adjustment plate in concept 4 ... 37
4.8.4 Surface roughness concept 4 ... 37
5
Conclusions ... 39
5.1 RESEARCH QUESTION 1 ... 39
5.1.1 Factors affecting junction temperature ... 39
5.1.2 Total resistance ... 39
5.2 RESEARCH QUESTION TWO ... 40
5.2.1 Possible number of interfaces ... 40
5.2.2 New concept ideas ... 40
5.2.3 Heat pipes and vapor chambers ... 40
5.3 RESULT RESEARCH QUESTION 3 ... 40
5.3.1 Concept 4 and 6 ... 40
5.3.2 Concept 4 ... 41
5.4 FURTHER DEVELOPMENTS AND RESEARCH ... 42
6
Discussion ... 44
6.1 APPLIED AND ACCUMULATED KNOWLEDGE ... 44
6.1.1 Applied knowledge ... 44
6.1.2 Problems in Ansys and their solutions ... 44
6.2 SUSTAINABILITY IN DESIGN ... 46 6.2.1 Environmental sustainability ... 46 6.2.2 Social sustainability ... 46 6.2.3 Economical sustainability ... 46 6.3 ERROR SOURCES ... 46
7
Bibliography ... 48
8
Appendix ... 51
A. APPENDIX 2:SIMPLIFIED SIMULATION GEOMETRIES ... 51
Introduction
1
Introduction
This project is the work of two students from Jönköping University as their bachelor thesis in mechanical engineering, 15 hp (credits).
1.1 Background
The project was done at SAAB Avionics Systems in Jönköping, which has a wide range of aerospace products. One of the products in Saab Avionics portfolio is the Head-Up Display, which comes in many varieties. The Head-Up Display is a product which has undergone thorough development and numerous prototypes have been made.
The Head-Up display is part of an information system, designed to help situation awareness for the pilot during takeoff, flight and landing. Flight information is projected on the Head-Up display.
The Head Up-Display consists of a Projector Unit (PU) and a Combiner and Display Model (CDM). The CDM consist of two lenses which the light is reflected upon, creating an image for the pilot.
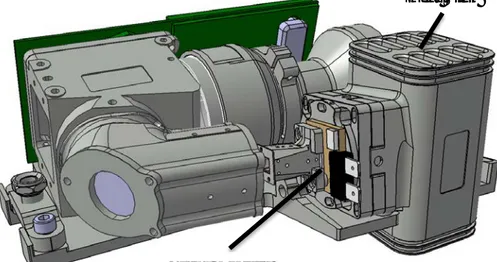
The Projector Unit consists of the Image Generator (IG) and the outer housing. The Image Generator projects the image on the CDM. The Light Module (LM) is mounted in the Image Generator.
Figure 1: The Image generator which holds the Light Module
The LM contains a LED, the lights shines through a light funnel, and then through high precision optics to finally generate a picture on the CDM.
The LM contains a LED which generates heat. In order for the PU to function properly, the heat must be dissipated into the environment. The current solution in one of the models cannot dissipate enough heat, and as a consequence the LM cannot be used with the desired power input, thus not generate enough light.
1.2 Problem description
In order to produce a picture with information for the pilot, a light source is needed. The light source in this case is a LED (light-emitting diode). LEDs are used in more and more applications. They appear in everything from televisions, mobile phones and cameras, but also in train and airplane lightning. To sum it up, the applications are many. The advantage with a LED is energy efficiency, since only a low voltage is needed. Also, they do not contain any mercury [1, pp. 3-4]. But the reliability is temperature dependent in a lot of cases. It is therefore important to have as stable temperatures as possible, especially in the light emitting area [1, p. 10].
Light Module
Introduction
Since LEDs are getting more and more common, the applications will also be in demanding environments. Therefor this report is a relevant contribution to how LEDs can be cooled when normal cooling solutions might not be applicable.
In this case the junction temperature has to be prevented from getting too high. But there is also a design problem concerning high mechanical demands on the product. Generalized the main problem is to transport heat out of a closed volume. This is a common problem when it comes to electronics since they have to be kept protected from dust and moisture to function properly.
The LM currently produces more heat than the nearby components can lead away, resulting in degraded performance. As a result, the LM cannot be used with desired power input. The high temperatures also shorten the lifespan of the LM and the electronics incorporated. The following points characterizes the problem.
• The PU casing is a closed volume to prevent dust and particles to affect performance of the optics. Therefor the LM cannot be cooled with direct airflow. • The existing cooling solution consists of a hollow heat sink, which is fed air with a
fan via inlets and outlets at the top and bottom of the outer housing.
• The LM needs to be able to be adjusted vertically, horizontally and rotational around the optical axis.
• The LM has to be electrically insulated, so that there is no current flowing in the casing. In the current design this has been solved by oxidizing the involved aluminum parts.
1.3 Purpose and research questions
The current solution was evaluated for design weaknesses. To see how the existing solution operated, a FEM analysis and manual calculations were made. When the part had been analyzed, the next step was to find new ways of improving heat flow and find the best solution for this specific application.
To solve the problem, the following research questions were answered:
• Where are the highest values of thermal resistance located in the current solution?
o How much do the existing surface treatments affect the thermal flow of the existing solution?
• Which applicable solutions for improved heat transfer are available?
• Which of these meet the given requirements best?
1.3.1
Specifications
The goal was to produce a cooling solution which could satisfy the following requirements: • It should be able to dissipate 30 W at 55 °C ambient temperature, and keep the junction
temperature below 110 °C.
• The LM was also to be electrically insulated by 106 Ω.
• The solution must have potential to be able to withstand the vibrations and forces that act upon the incorporated components when used in various aircrafts.
Introduction
• The solution has to be able to withstand variations in temperature.
1.4 Delimitations
As a result of the limited time, and prior knowledge of the authors the following limitations were set:
• The thesis will not generate a product ready for production, but possible solutions that improve heat flow with production potential.
• The work was limited by evaluating only two concepts. Heat conduction and adjustability in three different axes was considered.
• Data was gathered from the existing solution and from a test report.
• The software usage will be limited to the ANSYS Steady State Thermal Module and Catia.
• The thermal conductivities of the materials are assumed to be constant. • The produced solutions will not be evaluated for variations in air pressure. • No structural calculations concerning solidity will be made.
• No changes will be made to the heat sink spreader fins/heat sink pattern.
• Everything outside of the red box, shown in the figure Figure 2, will not be altered.
Figure 2: The red box defines the working volume
1.5 Disposition
The report starts with chapter 2, Theoretical framework which lists the theories used to solve the problem. The basics of the different cooling solutions which are available today were also explained here. These include heat pipes and vapor cooling.
Method explains the various methods that were used and how they were set up to reach the
result shown in the next part. These include FEM (Finite Element Method), Steady state and a number of thermodynamic laws.
In chapter 4, Implementations and Result, all the generated data are presented. This consists of various manual calculations, results from simulations and compiled data. The various concepts are also listed here together with their evaluation.
Introduction
Chapter 5, Conclusions, covers the findings for each research question. This is followed by design recommendations and areas to look further into.
Chapter 6, Discussion, treats the applied and accumulated knowledge gained during the project and error sources that could affect the result. Applied and accumulated knowledge covers the aspects of which areas of expertise that could be applied from studies and what was unknown territory for the writers of this report. Different sustainability aspects were also discussed.
Theoretical framework
2
Theoretical framework
The theoretical framework will present both theories that were used during the project and different ways of solving heat transfer problems.
To solve the research questions, the current status of scientific reaserach had to be aquired. This was desirable since this suggested different ways of solving heat transfer problem, that could be applicable.
2.1 Finite element method
When having a complex problem, it is easier to solve it when replacing it with a simpler version. With the Finite Element Method (FEM), the part studied is represented by a large number of small regions called finite elements. An approximated solution is calculated for each element, from which the solution to the whole problem is derived. This will give an approximated solution for the entire part. [2, p. 3]
As mentioned above, the finite element method calculates the result for each element. It is therefore important to use the correct number of elements to get a correct result.
To ensure the quality of the mesh, the stress concentration is compared to the number of elements. When the stresses are constant, adding more elements to the mesh will not reduce computational error [3, p. 381].
A problem with the automatic generated mesh in Ansys, a simulation software used to analyze heattransfer, is that it is a free mesh. Free meshes uses different geometries and sizes. This leads to a higher risk of element distortion. Therefore, free meshes should only be used in very complex geometries. In order to avoid the element distortion, a mapped mesh is preferable [3, pp. 383-385] .
It is important to to concentrate the number of elements in regions with high stress concentrations. If the elements of the mesh is not concentrated in regions where critical stresses are located, the results can be expected to be poor [3, p. 386].
High order element types, such as cubical elements lead to more accurate results. But they also lead to higher computing time [3, p. 381].
2.2 Thermodynamics
2.2.1
FEM applied to heat transfer
When calculating heat transfer with FEM, an energy balance equation is used, shown below: Ėin+ Ėg= Ėout+ Ėie
Ė represents energy flow at a time rate. Ėin is the energy that flows into the system, Ėgthe energy generated in the system, Ėout the outflow of energy out of the system and finally Ėie the change of the internal energy within the system. [2, p. 467]
The process for which thermal energy is transferred between a solid and a fluid or gas is called convection. Convection is calculated by:
Theoretical framework
Where q is the rate of heat flow by convection, σ the Stefan-Boltzmann coefficient, ε the materials emissivity, A the bodies surface area, T the surface absolute temperature and T∞ the surroundings absolute temperature. [2, p. 468]
When electric energy is generated, heat is often also generated. The process for which electric energy is converted to thermal energy can be expressed:
Ėg= q̇V
Where Ėg is the rate of heat generated, q̇ generated heat per unit volume and time and V the bodies total volume. [2, p. 468]
When heat gets generated into a solid, as described above, the solids temperature will increase, which means that energy gets stored. The equation describing the behavior of storing energy is shown below:
Ės= ρcVdTdt
Where Ės is the energy stored in the solid, ρ the materials density, c the materials specific heat, V the volume, T the bodies temperature and t the parameter of time. [2, p. 469]
When the equations described has been applied to each element, and then derived for the entire part, a result will be available.
2.2.2
Steady state
Within thermodynamics, steady state means that the temperature is not time dependent. In order to solve a steady state problem, Fourier’s law of heat conduction is used:
𝑞𝑞 = −𝑘𝑘𝑘𝑘𝑑𝑑𝑑𝑑𝑑𝑑𝑑𝑑
Where q represent the rate of heat transfer, k the materials thermal conductivity, A the area and 𝑑𝑑𝑑𝑑
𝑑𝑑𝑑𝑑 the temperature gradient.
But when heat flow or heat sinks are presents, they need to be considered. This is done by the statement that: 𝐸𝐸𝐸𝐸𝐸𝐸𝐸𝐸𝐸𝐸𝐸𝐸 𝑐𝑐𝑐𝑐𝐸𝐸𝑑𝑑𝑐𝑐𝑐𝑐𝑐𝑐𝐸𝐸𝑑𝑑 𝑖𝑖𝐸𝐸 𝑙𝑙𝐸𝐸𝑙𝑙𝑐𝑐 𝑙𝑙𝑓𝑓𝑐𝑐𝐸𝐸 + ℎ𝐸𝐸𝑓𝑓𝑐𝑐 𝐸𝐸𝐸𝐸𝐸𝐸𝐸𝐸𝐸𝐸𝑓𝑓𝑐𝑐𝐸𝐸𝑑𝑑 𝑤𝑤𝑖𝑖𝑐𝑐ℎ𝑖𝑖𝐸𝐸 𝐸𝐸𝑙𝑙𝐸𝐸𝑒𝑒𝐸𝐸𝐸𝐸𝑐𝑐 = 𝑐𝑐ℎ𝑓𝑓𝐸𝐸𝐸𝐸𝐸𝐸 𝑖𝑖𝐸𝐸 𝑖𝑖𝐸𝐸𝑐𝑐𝐸𝐸𝐸𝐸𝐸𝐸𝑓𝑓𝑙𝑙 𝐸𝐸𝐸𝐸𝐸𝐸𝐸𝐸𝐸𝐸𝐸𝐸 + 𝐸𝐸𝐸𝐸𝐸𝐸𝐸𝐸𝐸𝐸𝐸𝐸 𝑐𝑐𝑐𝑐𝐸𝐸𝑑𝑑𝑐𝑐𝑐𝑐𝑐𝑐𝐸𝐸𝑑𝑑 𝑐𝑐𝑐𝑐𝑐𝑐 𝐸𝐸𝑖𝑖𝐸𝐸ℎ𝑐𝑐 𝑙𝑙𝑓𝑓𝑐𝑐𝐸𝐸 Where the; 𝐸𝐸𝐸𝐸𝐸𝐸𝐸𝐸𝐸𝐸𝐸𝐸 𝑖𝑖𝐸𝐸 𝑙𝑙𝐸𝐸𝑙𝑙𝑐𝑐 𝑙𝑙𝑓𝑓𝑐𝑐𝐸𝐸 = 𝑞𝑞𝑑𝑑= −𝑘𝑘𝑘𝑘𝜕𝜕𝑑𝑑𝜕𝜕𝑑𝑑 , 𝐸𝐸𝐸𝐸𝐸𝐸𝐸𝐸𝐸𝐸𝐸𝐸 𝐸𝐸𝐸𝐸𝐸𝐸𝐸𝐸𝐸𝐸𝑓𝑓𝑐𝑐𝐸𝐸𝑑𝑑 𝑤𝑤𝑖𝑖𝑐𝑐ℎ𝑖𝑖𝐸𝐸 𝐸𝐸𝑙𝑙𝐸𝐸𝑒𝑒𝐸𝐸𝐸𝐸𝑐𝑐 = 𝑞𝑞̇𝑘𝑘𝑑𝑑𝑑𝑑 , 𝑐𝑐ℎ𝑓𝑓𝐸𝐸𝐸𝐸𝐸𝐸 𝑖𝑖𝐸𝐸 𝑖𝑖𝐸𝐸𝑐𝑐𝐸𝐸𝐸𝐸𝐸𝐸𝑓𝑓𝑙𝑙 𝐸𝐸𝐸𝐸𝐸𝐸𝐸𝐸𝐸𝐸𝐸𝐸 = 𝜌𝜌𝑐𝑐𝑘𝑘𝜕𝜕𝑑𝑑𝜕𝜕𝜕𝜕𝑑𝑑𝑑𝑑 and 𝐸𝐸𝐸𝐸𝐸𝐸𝐸𝐸𝐸𝐸𝐸𝐸 𝑐𝑐𝑐𝑐𝑐𝑐 𝐸𝐸𝑖𝑖𝐸𝐸ℎ𝑐𝑐 𝑙𝑙𝑓𝑓𝑐𝑐𝐸𝐸 = 𝑞𝑞𝑑𝑑+𝑑𝑑𝑑𝑑= −𝑘𝑘 �𝑘𝑘𝜕𝜕𝑑𝑑𝜕𝜕𝑑𝑑+𝜕𝜕𝑑𝑑𝜕𝜕 �𝑘𝑘𝜕𝜕𝑑𝑑𝜕𝜕𝑑𝑑� 𝑑𝑑𝑑𝑑�
For c being the materials specific heat, 𝑞𝑞̇ the energy generated and 𝜌𝜌 the density. Combining all of these expressions gives:
𝜕𝜕 𝜕𝜕𝑑𝑑�𝑘𝑘
𝜕𝜕𝑑𝑑
𝜕𝜕𝑑𝑑� + 𝑞𝑞̇ = 𝜌𝜌𝑐𝑐 𝜕𝜕𝑑𝑑
Theoretical framework
When solving three dimensional heat problems with constant thermal conductivity the same principals are used, the equation used is shown below:
𝜕𝜕2𝑑𝑑 𝜕𝜕𝑑𝑑2+𝜕𝜕 2𝑑𝑑 𝜕𝜕𝑦𝑦2+𝜕𝜕 2𝑑𝑑 𝜕𝜕𝑧𝑧2+𝑞𝑞̇𝑘𝑘=1𝛼𝛼𝜕𝜕𝑑𝑑𝜕𝜕𝜕𝜕 . [4, pp. 2-4]
2.3 Ways of improving heat flow
If a regular heat sink could not solve the problem, other means of dissipating the heat will be needed. Therefor these different methods might be useful.
2.3.1
Vapor chamber cooling
Vapor chambers are widely applied because of their ability to boost heat dissipation to heat sinks by an effective thermal spreader that leads to a more uniform heat flux distribution. [5, p. 140]
A vapor chamber can be considered a container which may contain a wicked structure. It is vital that it contains a working fluid, normally water. When the vapor chamber is in contact with the heat source, the working fluid evaporates. When the vapor reaches the cooler wall of the chamber, it cools to a liquid which is led back to the heat source. [6, p. 1774]
To get a significant improvement compared to a copper plate, a vapor chamber with a more efficient working fluid then water is needed. When using refrigerant R141b instead of water, the measured temperatures are lowered. The temperatures depending on cooling techniques are shown in figure 3. [5, p. 143]
Figure 3: A copper based heat spreader is compared to a vapor chamber filled with
refrigerant R141b (R), or water (W) [5, p. 143].
The writer of the report “Thermal performance of flat vapor chamber heat spreader” [7] claims that the resistance in a heat sink attached to a vapor chamber is not temperature dependent and therefore can be considered constant for a certain case. [7, p. 1783]
But the overall resistance, 𝑅𝑅𝑑𝑑, is temperature dependent. 𝑅𝑅𝑑𝑑 depends on the resistance in the condensation wall, 𝑅𝑅𝐶𝐶. To solve this issue, a forced convection could be used to reduce 𝑅𝑅𝐶𝐶 , and therefor also 𝑅𝑅𝑑𝑑. [7, pp. 1781-1782]
The two major ways to improve a vapor camber is to reduce the spreading resistance or improve the heat transfer coefficient [7, p. 1782]. The spreading resistance is shown below for temperatures T, power dissipation q, the effective heat transfer ℎ𝑒𝑒𝑒𝑒𝑒𝑒 and surface area 𝑘𝑘𝑠𝑠:
𝑅𝑅𝑠𝑠𝑠𝑠=𝑑𝑑𝑚𝑚𝑚𝑚𝑚𝑚−𝑑𝑑𝑟𝑟𝑟𝑟𝑟𝑟 𝑞𝑞 −
1
Theoretical framework
The spreading resistance is important, since this in addition to the hot spot effect caused by the high thermal concentration causes a high junction temperature. For LED lights, the junction temperature should be kept under 120°, so it is vital to keep the spreading resistance and the high thermal concentration under control. [9, p. 3990]
In conclusions from a report the writers claim: “Based on the present experimental study, it is found that the vapor chamber heat spreader is a good replacement for the traditional solid metal heat sink under the cases studied herein” [6, p. 1784].
A study made with a 30 W LED indicates that vapor chamber improves cooling performance by 20 % and weight by 20% when compared to metallic materials. Studies have also found that vapor chambers can achieve an effective thermal conductivity of 800𝑊𝑊 𝑒𝑒� 𝐾𝐾, which is twice as high as pure copper. [9, pp. 3990-3991]
2.3.2
Heat pipes
Heat pipes are based on the same principle as a vapor chamber. Likewise, they have a very low internal thermal resistance which means they are excellent for transporting the heat away from the heat source [10, p. 691]. They also provide a great degree of design freedom for different applications. They are usually made from copper tubing which can be bent to fit different applications, with a minimum bend radius of about 1, 5 times the tube diameter. [11]
They can also be flattened to provide a greater contact area, and fitted in narrow spaces [12]. A pair of embedded heat pipes can carry away 36% of the total heating power, while two pairs carries away 48% [10, p. 686]. The resistance for the heat pipes are dependent on the input power, were the resistance ranges between 0,32 - 0,27 K/W from 40 – 140W with two heat pipes. With four heat pipes, the total thermal resistance is close to constant around 0,24K/W. [10, p. 691]
There are existing heat pipes that are capable of extreme temperatures, -270°C -> 2000°C, that have been used in aerospace
[13]
. Other kinds of heat pipes have a more flexible design to enable more design possibilities, but do not have as wide of a temperature range. These are qualified for use in military aircraft. The temperature range for these heat pipes are -60°C - 135°C for freeze/thaw cycle testing. Flex testing has been made in a temperature range from −55°C - 65°C were it managed over 5 million cycles without failure. [14]2.3.3
Thermal Pastes
Thermal pads and fillers are commonly used in electronics to improve heat flow. There are silicon free thermal pads and fillers that could be used in this application [15] [16]. In order to be applicable, the thermal conducting material must be stable; no bleeding or outgassing can occur, since it can damage or degrade the performance of the optics incorporated [17]. Silicone based thermal compounds tend to outgas, dry out or bleed [18].
2.3.4
Design heat sink
In order to design a good heat sink, the design of the fins is of great importance. For a greater number of fins, the total area will increase, but the heat transfer coefficient decrease. It decreases since the cooling rate for the air is smaller and since the inlet area for the air also becomes smaller. This means that the air will get warmer faster, because of the reduced amount of air between the fins.
Concerning the fins length, a longer fin gives a larger area. But when the fins become too long, they start to overlap, leading to a higher resistance. [19, p. 25039]
Theoretical framework
2.4 Connection between research questions and theories
In order to answer any of the research questions experiments by simulations were vital. These simulations could not be made without FEM and Steady state.
The second research question is dependent on new information regarding different ways of transporting heat. Therefore the theoretical framework was important to find good ways of lowering the LEDs junction temperature.
In order to make sure that these alternatives are suitable for the IG, the information gathered during the theoretical framework was important.
So to find new means of solving the heat problem in the LM, new research and solutions were of great importance.
Method
3
Method
To get results that were reliable, methods with a good scientific connection were used. These methods and how they were linked to the research question are described below.
3.1 Methods used in report
The methods listed herein were used to ensure high credibility for this thesis.
3.1.1
Experiment
The purpose of an experiment is to compare outcomes when manipulating different properties of an object in order to see what factors impact the result, and to what degree. There are three different kinds of experiments; laboratory experiments, field experiments and simulations. [20, p. 40]
3.1.2
Literature study
In order to get an overview of the studied area, a literature study was performed. This helped to show the real impact of the problems in the thesis. It visualized today’s state of modern research and hint on good subjects, experiments, methods and so on. [20, p. 42]
3.1.3
Interview
An interview is a method of generating data under controlled circumstances. The researcher asks the respondent questions. The questions can be either open or closed questions, meaning the answers are formulated by the respondent, or predefined multiple choice. The interview can be classified in three ways, as an unstructured, semi-structured or a structured interview. [20, p. 40]
3.1.4
Rapid Prototyping
3D- printing or rapid prototyping is a fast way of producing a physical model from CAD geometry to check functionality, fit, ergonomic and aesthetical properties. In most cases in rapid prototyping, the geometry is broken down into thin 2D bodies. Which are then deposited as material layer by layer, to form the full 3D body. [21, p. 339]
SLA, or Stereolithography, uses a liquid resin which is cured by a laser tracer. The prototype is built layer by layer on a platform which is placed in the resin. When one layer is done, the build platform is lowered and another can be built on top. [21, p. 344]
3.1.5
Reverse engineering
Reverse engineering was used to understand the function of the product. By analyzing how
interfaces affect energy flow, the true function of the product is found. [22, pp. 178-180]
3.1.6
Brainstorming
Brainstorming is a technique that can be useful when looking for new ideas. It is a group
oriented technique with the purpose of generating as many ideas as possible. All the ideas are to be recorded. Most important is to not evaluate or comment on the ideas. The working principle of this technique is that among all the useless and wild ideas, some useful concepts will emerge. [22, p. 190].
3.1.7
Feasibility evaluations
The Feasibility evaluation sorts the concepts in three different groups; “it is not feasible”, “it is conditional” and “it is worth considering”. This is a method which is mostly based on gut feeling and is therefore more reliable the more experience the engineer has. [22, pp. 218-219]
3.1.8
Pugh’s method
Pugh’s method, a decision matrix, ranks the different criteria for the products, giving them
different amount of points. If a solution meets the requirements of a certain criteria, it gets the point given for that criterion. The different solutions are then ranked by how many points it has scored. [22, pp. 221-223]
Method
3.1.8.1
Weighting of points
When grading requirements on a scale, ranging from ex. 1-10, it is easy to either give very high or low scores. It can therefor give better results when weighting them against each other. If a solution is desirable, then points needs to be taken from another concept. This means that the decision has to be thought through more systematically. [22, p. 156]
3.2 Connection to research questions
The different methods and theories where used to solve the research questions. The methods and theories used for each research question are described below.
3.2.1
Research question one
In order to answer the first research question, an experiment was carried out to see how the results change when the oxide layers change. To study the full product a number of simulations were necessary.
To analyze the current product, reverse engineering was used. This gave an overview over the product, which helped in further analyzing with simulations.
3.2.2
Research question two
The second research question was dependent on the literature study. In order to see what kinds of new solutions that could be applicable to the product, the current state of research was investigated.
To easily acquire knowledge from the employees within the company, interviews were carried out.
To find new mechanical concepts that could be applicable, concepts needed to be generated. Brainstorming was used in order to get a large amount of new ideas. To ensure that the best ideas were chosen for further development, a feasibility evaluation was made.
3.2.3
Research question three
The last research question needed both experiments and the literature study to be answered. Experiments were needed to find the new mechanical concept’s junction temperatures. The literature study was needed to ensure that the new cooling solutions were applicable to the product. The concepts were 3D-printed, to help with the evaluation in Pugh’s method.
To rank the different mechanical concepts, to see which solution that handled the demands best, Pugh’s method was used. Pugh’s method was used with weighted points, to help get at good comparison of the different concepts.
3.3 Validity and reliability
In order to ensure a high quality work, it was needed to make sure that the work was connected to the methods and theories in a proper manner. It was also important that the sources used were credible.
3.3.1
Methods
The different methods chosen for the report are applicable to the problems that need to be solved. Even though feasibility evaluations are quite simple and do not give detailed analysis, they give fast and clear results. This was desired, since brainstorming gives a large amount of concepts, so an effective way of sorting them was needed. The concepts that were considered feasible were then thoroughly evaluated through Pugh’s method. Therefore it was considered that these different theories were a good match for the project.
The brainstorming method has some downsides; some of the concepts generated might not be applicable, since quantity is prioritized. But because of the theories used in order to sort out the best applicable concepts, a certain quality could be assured.
Method
3.3.2
Source critic
Most of the references in this paper are considered to be reliable. Many of them are from published books or reports. However, some of the references are from companies websites. These companies will of course want to sell their products, but it was considered to be the best option for finding cooling devices that were available on the market. Only established companies with proven products were used. For example Thermacore, which solutions has been used in military airplanes [23].
Implementation and Result
4
Implementation and Results
In order to fully understand the product, reverse engineering was used. The next step was to analyze a report, mentioned in the report as the test report, covering a previous benchmarking of the product. The report was regarding different temperatures in the different plates of the product and the heat sink in different ambient temperatures with and without a fan. The different temperatures and ambient temperatures from the test report were used to set up a simulation in ANSYS steady state.
4.1.1
Reversed engineering
Figure 4 shows the product with different functional parts named. Table 1 analyzes the named parts.
Implementation and Result
Part Detailed study Flow of energy, materials or
information in interfaces Light
funnel (A) In direct contact with LM.
The funnel leads the light in the right direction to minimize light loss.
Light flows through the funnel from the diode.
LM (B) The diode is in direct contact with the copper plate and the light funnel.
Since this is where the heat is produced, it will affect all parts. The LM is fastened with two screws on adjustment plate 1 (C).
The light produced from the diode is lead through the funnel.
On the other side of the LM, the majority of the heat generated is absorbed through the copper plate to adjustment plate 1(C).
Adjustment
plate 1 (C) Adjustment plate 1 is fastened with two screws into adjustment plate 2 (D). Adjustment plate 1 can rotate around its own axis as long as the screws are not fully fastened.
Energy in form of heat flows through the plate. In order to stop the electrical flow, the plate has a surface treatment.
Adjustment
plate 2 (D) Adjustment plate 2 (D) can be adjusted height wise with a screw placed at the top side of the plate. It is fastened with four screws, one in each corner.
Energy in form of heat flows through the plate. In order to stop the electrical flow, the plate has a surface treatment.
Adjustment
plate 3 (E) Adjustment plate 3 (E) can be adjusted sidewise with a screw at the side. It is fastened in the same way as adjustment plate 2 (D) in the heat sink (F).
Energy in form of heat flows through the plate. In order to stop the electrical flow, the plate has a surface treatment.
Heat sink
(F) The heat sink is fastened in the PU casing with three bolts. The heat sink absorbs heat from the last adjustment plate and then leads it out from the system.
Table 1: Reverse Engineering
4.2 Thermal Calculations
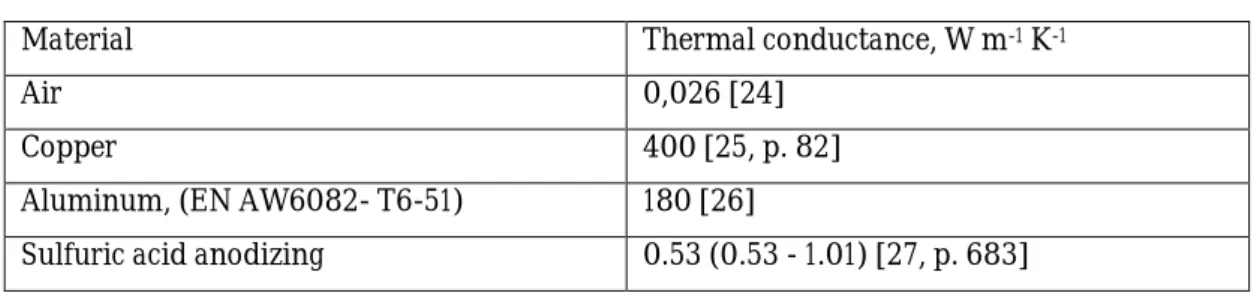
The new solution would need to dissipate 30 W which is a 73% increase from today’s 17,3W given in the test report. To see how this could be done, calculations shown below were used. In Table 2 different thermal conductance for the materials used are listed, which were needed for further calculations. The conductance of air is of interest when surface roughness is considered. Copper is used in the LM. Aluminum is used in the adjustment plates and the heat sink, and sulfuric acid anodizing is the oxide layer which is present on the aluminum parts.
Implementation and Result
Material Thermal conductance, W m-1 K-1
Air 0,026 [24]
Copper 400 [25, p. 82]
Aluminum, (EN AW6082- T6-51) 180 [26]
Sulfuric acid anodizing 0.53 (0.53 - 1.01) [27, p. 683]
Table 2: Table of Materials
4.2.1
Absolute Thermal Resistance
The absolute thermal resistance, R (K/W), can be calculated over the points of measure in the test report, following the formula:
𝑅𝑅 =
∆𝑑𝑑𝑃𝑃(1)
Where P is dissipated power and ΔT is difference in temperature in °C or °K.
4.2.2
Available thermal Resistance
The goal was to produce a cooling solution which can dissipate 30 W at 55 °C and keep the junction temperature below 110 °C. This states that the total thermal resistance is limited to 1,83 K/W.
The experiments preformed in the test report used probes on different part of the product to measure the temperatures. The locations of these probes are shown in figure 4.
Implementation and Result
Figure 5: Placement of thermocouples
The measurement from the test report, gives the values:
Interface by Channel Absolute thermal resistance (K/W)
8 – 1 0,6
1 – 2 0,35
2 – 3 0,35
3 – 4 0,25
Table 3: Absolute thermal resistance
A theoretical value of the absolute thermal resistance in the copper and aluminum can be calculated with formula 1 and 2. The formula for thermal resistance is as follows:
𝑅𝑅 =
𝑘𝑘∗𝐴𝐴𝐿𝐿(2)
Where L is thickness (m), k is thermal conductance (W m-1 K-1) and A is area (m2) [28]. Thickness L, surface area A, and thermal conductivity k was considered for each individual interface.
Implementation and Result
Interface by Channel Absolute thermal resistance (K/W)
8 – 1 0,016133
1 – 2 0,027902
2 – 3 0,02482
3 – 4 0,01695
Table 4: Absolute thermal resistance in the solid bodies.
With the above given numbers the percentage of thermal resistance located in the interfaces can be calculated. This includes both the oxide layers and the air gap due to surface roughness.
Interface by Channel % of Resistance, Interfaces
8 – 1 97
1 – 2 92
2 – 3 93
3 – 4 93
Table 5: Percent of absolute thermal resistance in the interfaces, compared to the
material between the listed points of measure.
Since the theoretical number of thermal conductance for the aluminum oxide varies much more than the number for the aluminum EN AW6082- T6-51, the conductance for aluminum was chosen as a reference when estimating how much of the resistance were located in the interfaces.
4.2.3
Level of influence from oxide and surface roughness
To be able to set up a reliable simulation, it must be determined how much of the thermal resistance is due to surface roughness and how much that is due to the oxide layers.
To achieve the thermal resistance calculated in the test report, it is reasonable to believe that the oxide thickness in reality is at the maximum specified thickness, since this gives the smallest possible air gap width.
Using formula 2 and 3 gives the theoretical layer of air to a thickness varying from 1.6 to 8.9 μm, which is reasonable since the Ra value given in blueprints is 3,2. These results are given in table 6 below.
Implementation and Result
Interface by Channel Thickness Air, µm Thickness Oxide, μm
Average 6,36039 75 8 – 1 8,4268 60 1 – 2 1,61681 120 2 – 3 7,42994 80 3 – 4 7,96797 40
Table 6
In table 7 which these calculations are based on, the thermal resistance due to surface roughness varies between 0,46 – 0,07 with an average of 0,23 K/W.
Interface by
Channel Thermal resistance, Air gap, (K/W) Thermal resistance, Oxide layer, µm
Average 0,23177498 0,140571612 8 – 1 0,45791328 0,15114492 1 – 2 0,069402796 0,252695418 2 – 3 0,212785406 0,112394206 3 – 4 0,18699844 0,046051901
Table 7
4.3 Electrical calculations
To ensure that the requirements were met, some calculations had to be done.
4.3.1
Electric insulation
The LM is also to be electrically insulated by 106 Ω.
Electrical resistivity of Aluminum oxide is given the value of 1012 Ω [29, p. A28].
Following the formula for resistivity below, it can be shown that the current oxide thickness were well beyond what is needed for the electrical insulation [25, p. 110]:
R = ρ L/A
(3)
R is resistance (Ω), A is area, L is thickness and ρ is resistivity.
However to ensure that the surface stay intact, it was made thicker to be able to withstand wear. The theoretical value for the needed thickness is calculated to 7, 49*10-10 m, when A is set as the backside area of the LM.
Implementation and Result
4.3.2
Power and Power efficiency
According to the datasheet [30] for the LM, the reference drive current is 18 A and the typical forward voltage is 4,7 V when run with continuous waveform. This gives a radiometric flux of 7 W.
Following the given formula where t is percentage of lit time in a wave cycle, U is voltage (V) and I is current (A) the power is 79,2 W, which gives a efficiency of 8,3 %.
P = U ∗ I ∗ t
(4)
At reference pulsed drive current and a reference duty cycle of 50 %, the peak drive current is 30 A and the typical forward voltage is 5,2 V. This gives a power of 78 W. The peak radiometric flux is listed as 9,4 W, which gives an efficiency of 12 %.
In this case the LM is currently running a duty cycle of 80% at 4 V and 6,2 A which generates 19,8 W. The goal is to have a power output of 30 W at an 80 % duty cycle.
Since 80% is in the range between 50 – 100 % waveform it is assumed that 88 – 91,7 % becomes heat.
However, some of the light generated are lost in the optics chain, resulting in more heat in the PU.
Therefore, it will be assumed that all of the power input will be converted into heat that has to pass through the heat sink.
4.4 Temperature data
The staple diagram (table 8) visualizes the calculated thermal resistance where each color represents the resistance up to the named probe. The horizontal scale represents the different tables from which the values are taken. The vertical scale is thermal resistance.
Implementation and Result
Table 8: The thermal resistance between the points of measurement in the different test
sessions from table 2 - 9 from the test report. The thermocouple Channel 8 loosened
during the test 5, hence the odd values on Channel 8 and 1.
-1 0 1 2 3 4 5 2 3 4 5* 6 7 8 9 Thermal Resistance (K/W)
Different tables/test sessions
Ambient Ch6 Ch5 Ch4 Ch3 Ch2 Ch1 Ch8 Ch7
Implementation and Result
Table / Test Fan Ambient temp, (°C) Power dissipation, (W)
2 No 21 19,8 3 Yes 21 19,8 4 No 55 17,3 5 Yes 55 19,2 6 No 55 17,3 7 Yes 55 17,3 8 No -20 33,7 9 Yes -20 33,7
Table 9
The thermal resistance from channel 7 to 8 cannot be improved since the thermocouples are both located on the LM.
Multiple conclusions could be drawn from this diagram.
• The resistance in channel 1 is noticeable greater than in 2, 3, 4 and 5, indicating that this interface needs improvement.
• The low values in channel 6 is due to the fact that channel 5 and 6 are placed on top, respectively under the heat sink, which gives them a low difference in temperature. • If the tests with, respectively without fan are compared, it is clear that a fan is needed
to reduce the thermal resistance to the ambient air.
4.5 Simulation Setup
The simulation was performed in Ansys steady state thermal.
The simulation only included parts directly involved in the transporting of heat. The heat flow into the system was set as a heat flow (W) and a convection (𝑊𝑊 𝑒𝑒� 2𝐾𝐾) controlled the heat flow out of the system. All boundaries other than the ones on the heat sink in direct contact with ambient air, was considered perfectly insulated.
To account for the oxide layers and the air gap due to surface roughness, bodies with corresponding thickness was added between the parts. Two bodies were added in every interface, one to represent the air gap, and one to represent the oxide layer on the two parts. The reference model was built on values from a test report covering the temperatures on the different involved parts. The air gap thickness was set to 8μm to achieve the same thermal resistance in the system, when calibrating the reference model, even though the average calculated thickness was 6,4μm.
Mesh studies were carried out on the models that were used in the simulations. This was done by running the same simulation multiple times with different mesh qualities. This was done to
Implementation and Result
ensure that the mesh was not too coarse and that the result was not dependent on the mesh size and thereby gave incorrect answers.
Since the geometry was complex with very thin bodies, a mapped mesh could not be performed because of the long computing time. A standard mesh was therefor used, with refinements along the interfaces.
For more information about the model setup, see discussion.
4.6 Result research question one
To answer research question one, a reversed engineering analysis and simulations were made.
4.6.1
Junction temperature dependent on thickness of oxide layer
In order to see how the oxide layer affect the heat flow, simulations of the product was made. The results from these simulations are shown in table 10. The junction temperature was higher than 110°C for all power inputs with oxide and a surface roughness. When the oxide thickness was decreased to 20µm for all parts, the junction temperature lowered 12°C. The temperature lowers additionally when the oxide is completely removed, with a total of 24°C.
Oxide adjustment
plate 1, µm Oxide adjustment plate 2, µm
Oxide adjustment plate 3, µm
Oxide Heat
Sink, µm Junction temperature, °C Total thermal resistance K/W 60 60 20 20 152 3,2 20 20 20 20 140 2,8 0 0 0 0 128 2,4
60 (no air) 60 (no air) 20 (no air) 20 (no air) 104 1,6
no oxide layer, no air 93 1,3
Table 10: Current construction, 55°C ambient with fan, 30W
The total thermal resistance is 3,23 K/W. The thermal resistance drops with 0.8 K/W if the oxide is removed. If the air is removed but the oxide is left, the thermal resistance drops with 1,6 K/W. If both is removed the thermal resistance in the material left is 1,3 K/W.
4.7 Result research question two
The chosen new applicable ways of cooling the LED was a new design with a lower amount of interfaces with or without the use of either a vapor chamber and/or heat pipes.
4.7.1
Amount of interfaces possible
In order to see how many interfaces that where possible to use while maintaining an acceptable junction temperature, simulations were performed in Ansys.
The first simulation was for the LM to be placed directly on the heat sink, as shown in table Table 11. For a representation of the simplified body used in the simulation, see appendix A.
Implementation and Result
Table 11: LM directly on heat sink, 50µm oxide layer, 55°C ambient with fan
The next step was to see if more interfaces were possible to use, which led to the next set of simulations. These where made for one adjustment plate between the LM and heat sink. Table 12 shows the junction temperatures for these simulations. For a representation of the simplified body used in the simulation, see appendix A.
Table 12
4.7.2
Thermal pastes
In interviews with experts in different areas with many years of experience with the product, it became clear that thermal pastes or pads were not a suitable supplement to increase heat flow. The friction between the parts could get too high, and problems with accuracy could occur if the applied compounds were not evenly distributed on the surfaces. These compounds also demand a highly controlled production process, which can be hard to achieve [17] [31].
4.7.3
New concept ideas
After the number of possible interfaces had been studied, new concepts were generated.
4.7.3.1
Concept 1
Concept one, allows for all adjustments with just two interfaces. Two adjustment screws at the top adjust height and one at the side adjusts sideways. The reason for two screws on top was to stabilize the plate. The LM rotates directly on the plate and is fastened by two screws. The axis of rotation would be one of the screws, whereas the other one would demand a solution fastening of higher complexity.
Power input, W Junction temperature, °C
30 97
Adjustment plate oxide layer,
µm Heat sink oxide layer, µm Junction temperature, °C
50 50 120 20 20 114 50 0 116 25 0 113 0 0 102 Solid, no interfaces 90
Implementation and Result
Concept 1
4.7.3.2
Concept 2
The adjustments were built into the heat sink in concept 2.
The heat sink is made in three parts. The first part is a U shaped profile which makes up the structural frame. The second part is a flat plate, in which a large circular hole makes up the last wall in the heat sink. The third part is a circular plate with spreader fins on the back which fits in the second part. The circular third part is able to rotate about its own axis, the second part makes movement up and down possible, and the first part is adjusted sideways on the inner frame of the PU, which it is then fixed to.
Concept 2
4.7.3.3
Concept 3
Concept three uses two screws for all adjustments. First the height with the bottom set screw, which will then be lightly fixed. When the set screw on the side is twisted, the fixation will lead to a rotation. When the rotation is correct, this will also be fixed. When the rotation is fixed, further adjustment on the screw on the side will lead to a sideways adjustment.
Implementation and Result
4.7.3.4
Concept 4
Height and sideways adjustment is performed by three adjustment screws, as in concept 1. The major difference from concept 1 is the way of rotation. This concept has a circular plate held down between the heat sink and the outer frame. Further explanation is done in 4.7.5.
Concept 4
4.7.3.5
Concept 5
The concept shown below uses heat pipes to lead away the excess heat. Heat pipes could be a way to transport away the heat if the simplified adjustment mechanics cannot fulfill the requirements.
Concept 5
Concept 3
Implementation and Result
4.7.3.6
Concept 6
This solution has two moving parts. It consists of one round plate to account for rotation, which the LM is placed on, and one outer frame to account for translation in height and sideways. The round plate is mounted in and on top of the frame, and secured with screws. Further explanation is done in 4.7.5.
Concept 6
4.7.3.7
Concept 7
This concept consists of three moving parts, the LM (pink), one round frame, (dark green), and one outer frame (bright green). The idea was that the LM is placed directly on the heat sink, held in place by the frames.
Concept 7
4.7.3.8
Concept 8
This concept was derived from concept 6. The main idea was to have two surrounding frames to be able to lock the adjustments in height and sideways separately.
Implementation and Result
Concept 8
4.7.4
Feasibility evaluations
The feasibility evaluation is based on gut feeling regarding number of interfaces, ease of assembly, electric insulation, manufacturability and accuracy.
Concept
number It is conditional It is worth considering It is not feasible
1 X 2 X 3 X 4 X 5 X 6 X 7 X 8 X
Table 13
4.7.5
Mechanical breakdown of concept 4 and 6
Concept 4 consists of three major parts. The LM was screwed to the circular plate, which fits between the heat sink and the rectangular frame. The circular plate is secured in the frame with two screws, which also fixates the rotational freedom in the circular plate. The frame is adjusted in the plane with three adjustment screws. Everything is then secured with four screws and washers going through the frame into the heat sink.
Concept 6 works in the same way, except that the circular plate accounting for rotation is assembled from the top.
The heat sink is not represented in the figures below; they are only a representation of how the LM is mounted to the heat sink.
Implementation and Result
Figure 6: Concept 4
Figure 7: Concept 6
These CAD-models were 3D-printed, for an easier and better evaluation in Pugh’s method. The 3D-printed models are shown in figure 8 and 9.
Figure 8: Concept 4 Figure 9: Concept 6
Implementation and Result
4.7.6
Pugh’s matrix
Criteria Concept 4 Concept 6
Number of interfaces 3 3
Ease of assembly 5 1
Low amount of components 3 3
Electric insulation 3 3
Accuracy in adjustability 3 3
Risk of failure 3 3
Consequence of failure 3 3
Thermal conductivity 4 2
Total sum of points 27 21
Table 14
Pugh’s method was performed in order to analyze concept 4 and 6. The different criteria are discussed below:
• Number of interfaces: They both have the same number of interfaces.
• Ease of assembly: The assembly order is different between the different concepts, and there are some critical differences. In concept 4 the circular plate is held down by the overlapping frame. The frame is then held down by four screws to secure everything tightly in place. Whereas in concept 6 the circular plate is fastened by two screws from above into the frame, which is fastened by 4 screws to the heat sink. If the screws holding the frame to the heat sink are tightened too hard, it might result in permanent deformation in the circular plate. This is because that the frame which is suspended in the circular plate does not rest on the heat sink. This could cause difficulties during assembly.
• In an interview it was established that both concepts where possible to assemble [32]. • Number of components: The number of components is interesting from an economical
perspective and it is always sought to keep this low. Including the screws, washers and the machined parts, both have an equal number in the above mentioned part categories, with a total sum of 18.
• Electric insulation: They were both able to insulate 106 Ω with sufficient surface treatment.
• Accuracy in adjustability: None of the concepts seems to have better accuracy than the other.
• Risk of failure: The risk of failure is small in both concepts if constructed and assembled properly.
• Consequence of failure: LM loosens and needs to be readjusted.
• Thermal conductivity: Concept 4 is assumed to be better since it has a greater contact surface area and thinner cross-section material.
Implementation and Result
4.7.7
Usage of vapor cooling and heat pipes
Since the possibility of heat sinks or vapor chambers have been discussed, simulations with different power inputs have been made. According to the report, [9], which has been discussed in theoretical framework, a vapor chamber can improve cooling performance by 20%. It is assumed that this can be interpreted as 20% of power input being removed, so simulations with 24W were therefor preformed.
Report [10], which has also been discussed earlier, claims that a pair of heat pipes can carry 36% of the total heating power, therefore was simulations with 30% less power input (since the report had much higher power input then the current diode, a safety marginal was used).
4.7.7.1
LM directly on heat sink
The first part to be simulated this way was a simplified version with LM in direct contact with the heat sink, results shown in table 15. For a graphical representation, see appendix A.
Table 15, LM directly on heat sink, 50µm oxide layer, 55°C ambient with fan
4.7.7.2
One adjustment plate
A simplified version with one adjustment plate and two different oxide layers thickness were then simulated. The results are shown in Table 16 and Table 17. For a graphical representation, see appendix A.
Table 16 One adjustment plate. Both adjustment plate and heat sink oxidized, 20 µm,
(20µm-40µm) 55°C ambient with fan
Power input, W Junction temperature, °C
30 97
24 93
20 89
Power input, W Junction temperature, °C
30 114
24 106
Implementation and Result
Table 17 One adjustment plate, 55°C ambient with fan. Both adjustment plate and heat
sink oxidized, 50 µm (50 µm-100µm)
4.8 Result research question three
Concept 4 and 6 were the concepts that were most likely to be feasible according to the feasibility evaluations. In order to analyse the heat flow in these concepts, simulations were made.
4.8.1
Junction temperatures depending on oxide layer thickness for
concept 4 and 6
The junction temperatures of concept 4 and 6 depending on oxide thickness and surface roughness are presented below.
Oxide layer adjustment plate,
µm Oxide layer Heat sink, µm Junction temperature, °C
50 50 118 60 20 118 20 20 113 50 25 118 50 0 115 25 0 113
Table 18 Concept 4, 55°C ambient with fan, 30W
Power input, W Junction temperature, °C
30 120
24 111
Implementation and Result
Oxide layer adjustment plate,
µm Oxide layer heat sink, µm Junction temperature, °C
50 50 120 60 20 120 25 50 117 20 20 114 50 0 117 25 0 115
Table 19 Concept 6, 55°C ambient with fan, 30 W
4.8.2
Vapor and heat pipes, concept 4 and 6
The same test as earlier with a lower power input were made for concept 4 and 6. Table 20 and Table 22 for both heat sink and adjustment plate oxidized with 50µm and Table 21 and Table 23 for 20µm.
Power input, W Junction temperature, °C
30 118
24 109
20 104
Table 20: Concept 4, 55°C ambient with fan. Both adjustment plate and heat sink
oxidized, 50 µm.
Power input, W Junction temperature, °C
30W 113
24W 102
20W 94
Table 21: Concept 4, 55°C ambient with fan. Both adjustment plate and heat sink
oxidized, 20 µm.
Implementation and Result
Power input, W Junction temperature, °C
30 120
24 111
20 105
Table 22: Concept 6, 55°C ambient with fan. Both adjustment plate and heat sink
oxidized, 50 µm.
Power input, W Junction temperature, °C
30 117
24 106
20 103
Table 23: Concept 6, 55°C ambient with fan. Adjustment plate oxidized with 25µm and
heat sink with 50µm.
4.8.3
Change material of adjustment plate in concept 4
Concept 4 was also tested with the adjustment plate in copper (this is not a realistic scenario since the same surface treatment cannot be used).
Power input, W Junction temperature, °C
30W 112
Table 24 Concept 4 copper plate, 55°C ambient with fan. Both adjustment plate and
heat sink oxidized with 20 µm.
4.8.4
Surface roughness concept 4
Simulations made with different surface roughness, and therefor different thick “air layers”. Theoretical air layer thickness, µm Junction temperature, °C
8 113
6 109
6,4 110
3,2 101
Table 25: 55°C ambient with fan. Both adjustment plate and heat sink oxidized, 20 µm,
30W
Implementation and Result
Theoretical air layer thickness, µm Junction temperature, °C
8 118
6 114
6,4 114
3,2 106
Table 26: 55°C ambient with fan. Both adjustment plate and heat sink oxidized with 50
µm, 30W
Conclusions
5
Conclusions
The result led to these conclusions and recommendations regarding answers to the research questions:
• Where are the highest values of thermal resistance located in the current solution?
o How much do the existing surface treatments affect the thermal flow of the existing solution?
• Which applicable solutions for improved heat transfer are available?
• Which of these meet the given requirements best?
5.1 Research question 1
Research question one was answered by calculations and simulations to find the highest values of thermal resistance and the impact of the oxide layer. The current product was analyzed, according to Table 10. With this analyze the thermal resistances in the product and the impact the oxide layer had could be found.
5.1.1
Factors affecting junction temperature
To see which factors that play the main role in the high junction temperature, different situations were simulated. The outputs of these different experiments are presented in table 27.
Change Lowered % Lowered °C
Removing oxide layer 16 24
Removing 53% of oxide (all
parts oxidized with 20µm) 8 12
Removing theoretical air gap 32 48
Removing both theoretical
air gap and oxide 39 59
Table 27
This project has led to the conclusion that the surface roughness is a more important factor than the thickness of the oxide layer. In the current product, the junction temperature drops 32% (48°C) when removing the theoretical air gap. When only removing the oxide layers, the temperature drops 16% (24°C). So the surface roughness is important to keep as low as possible, in order to lower the junction temperature. But 16 %( 24°C) is also a considerable amount, which if possible also could be reduced to lower the junction temperatures.
Removing both the oxide and the air between the plates reduced the temperature by 39%.
5.1.2
Total resistance
The total thermal resistance is 3,23 K/W. The thermal resistance drops with 0.8 K/W if the oxide is removed. If the air is removed but the oxide is left, the thermal resistance drops with 1,6 K/W. If both is removed the thermal resistance in the material left is 1,3 K/W. With these numbers it is clear to see that the most thermal resistance is due to surface roughness.