Västerås, Sweden
Thesis for the Degree of Master of Science in Engineering - Dependable
Systems 30.0 credits
EVALUATING THE IMPACT OF
UNCERTAINTY ON THE INTEGRITY
OF DEEP NEURAL NETWORKS
Jakob Harborn
jakobharborn@hotmail.com
Examiner: Masoud Daneshtalab
Mälardalen University, Västerås, Sweden
Supervisor: Håkan Forsberg
Acknowledgement
I want to thank Håkan Forsberg for giving me the opportunity and idea of working with this subject. Thank you, Håkan, for your guidance, insights and, support as my supervisor throughout this thesis. I would also like to thank Johan Hjorth for the helpful discussions, feedback, and valuable information regarding Neural Networks.
Abstract
Deep Neural Networks (DNNs) have proven excellent performance and are very successful in image classification and object detection. Safety critical industries such as the automotive and aerospace industry aim to develop autonomous vehicles with the help of DNNs. In order to certify the usage of DNNs in safety critical systems, it is essential to prove the correctness of data within the system. In this thesis, the research is focused on investigating the sources of uncertainty, what effects various sources of uncertainty has on NNs, and how it is possible to reduce uncertainty within an NN. Probabilistic methods are used to implement an NN with uncertainty estimation to analyze and evaluate how the integrity of the NN is affected. By analyzing and discussing the effects of uncertainty in an NN it is possible to understand the importance of including a method of estimating uncertainty. Preventing, reducing, or removing the presence of uncertainty in such a network improves the correctness of data within the system. With the implementation of the NN, results show that estimating uncertainty makes it possible to identify and classify the presence of uncertainty in the system and reduce the uncertainty to achieve an increased level of integrity, which improves the correctness of the predictions.
Keywords – Uncertainty, Deep Neural Network, Bayesian Neural Network, Dependability, Integrity, Probability
Contents
1. Introduction 1
2. Background 2
2.1 Deep Neural Networks . . . 2
2.2 Bayesian Neural Networks . . . 2
2.3 Dependability . . . 3
2.4 Overfitting . . . 3
2.5 Uncertainty . . . 3
3. Related Work 4 3.1 Stochastic Gradient Descent . . . 4
3.2 Stochastic Variational Inference . . . 4
3.3 Deep Ensembles . . . 4
3.4 Deterministic Uncertainty Quantification . . . 4
3.5 Monte Carlo Drop Out . . . 5
3.6 Simultaneous Quantile Regression and Orthonormal Certificates . . . 5
3.7 Dependability Metrics . . . 5 4. Problem Formulation 7 4.1 Hypothesis . . . 7 4.2 Research Questions . . . 7 4.3 Limitations . . . 7 4.4 Research Goals . . . 7 5. Method 8 5.1 Choice of Method . . . 8 6. Results 9 6.1 Bayesian Neural Network . . . 9
6.1.1 Training . . . 9 6.1.2 Predictions . . . 9 6.2 Test Results . . . 9 6.2.1 Training . . . 9 6.2.2 Predictions . . . 10 6.2.3 Final Output . . . 11 6.2.4 Out of Distribution . . . 12 7. Discussion 13 7.1 Restrictions . . . 13 7.1.1 Coronavirus . . . 13 7.1.2 Hardware . . . 13 7.2 Method . . . 13 7.3 Training . . . 14
7.4 Bayesian Neural Network . . . 14
7.5 Industrial Applications . . . 15 7.6 Research Results . . . 15 8. Conclusions 17 8.1 Research Question 1 . . . 17 8.2 Research Question 2 . . . 17 8.3 Research Question 3 . . . 17 8.4 Future Work . . . 17
Appendix B Prediction plot of an incorrect prediction 21 Appendix C Correct digit prediction with undecided output 22 Appendix D Incorrect digit prediction with undecided output 22 Appendix E Random data with undecided output 23 Appendix F Out of distribution data with undecided output 23
List of Figures
1 Relations of the dependability metrics. . . 6
2 Visualization of the method. . . 8
3 Optimization cycle with 10 iterations. . . 10
4 Optimization cycle with 8 iterations. . . 10
5 Predictions without skipping any input data. . . 11
6 Predictions with 30 % threshold. . . 11
7 Predictions with 60 % threshold. . . 11
8 Illustrative example of how a prediction is made. . . 11
9 Correct prediction of digit 3 with very high probability. . . 21
10 Incorrect prediction of digit 7 with high probability on the digit 9. . . 21
11 Skipped correct prediction of digit 8 due to too low probability. . . 22
12 Skipped incorrect prediction of digit 8 due to too low probability with the correct digit 0 having even lower probability. . . 22
13 Skipped prediction on randomly generated data because of too low probability. . . 23
Acronyms
ADALINE Adaptive Linear Neuron. 2 Adam Adaptive Moment Estimation. 9, 14 AE Autoencoder. 2
ANN Artificial Neural Network. 2
BNN Bayesian Neural Network. ii, iii, 2, 4, 8–17
CNN Convolutional Neural Network. 2 CPU Central Processing Unit. 9, 13, 14
DBN Deep Belief Network. 2
DNN Deep Neural Network. ii, 1, 2, 7–9, 13, 17
ELBO Evidence Lower Bound. 9, 10, 14
GPU Graphical Processing Unit. 2, 9, 13, 14
LSTM Long Short Term Memory. 2
NN Neural Network. i, ii, 1–3, 5–7, 9, 12–15, 17
RBM Restricted Boltzmann Machine. 2 ResNet Microsoft Residual Neural Network. 2
RICC Robustness, Interpretability, Completeness, and Correctness. 6 RMSProp Root Mean Square Propagation. 9
SGD Stochastic Gradient Descent. 4, 9 SQR Simultaneous Quantile Regression. 5 SVI Stochastic Variational Inference. 4, 5, 9
1.
Introduction
Deep Neural Networks (DNN) are today used to a great extent within machine learning to aid the development of autonomous solutions because of their ability to give accurate predictions in image classification [1], [2], object detection [3], [4], and speech recognition [5], [6]. Neural networks produce deterministic outputs and do not quantify predictive uncertainty, which leads to overconfidence. Overconfidence is a challenge for NNs when classifying incorrectly, NNs often prove a high level of confidence, which may result in severe failures. This may be reduced by quantifying predictive uncertainty.
Most DNNs are considered deterministic functions in the sense that a classification of an output is a result based on all the information gathered from the input; the result will not change if no changes are made to the input. Deterministic DNNs do not account for parameters such as uncertainty or probabilistic methods. However, by adapting DNNs to work with uncertainty and probabilistic methods, it is possible to make decisions and data analysis based on confidence bounds [7]. Information is vital for all cases where decisions are made, the data involved in the decision making must be reliable. Therefore, it is necessary to know how certain an output of a system is to be able to know the risks involved in the decision making processes.
Estimating the uncertainty of the output may have a positive effect on the system, reducing the amount of incorrect outputs. By including uncertainty when classifying outputs from neural networks, the issue of overconfidence might be reduced. Overconfidence in neural networks is not an issue when classifications are correct but when classifications are incorrect. Overconfident results in incorrect classifications are dangerous because the system is convinced that a prediction is correct with a high certainty even though it is incorrect. A system with high confidence and incorrect classifications is not reliable. Incorrect classifications with lower confidence are more reasonable predictions as it is possible to make decisions and plan accordingly based on the uncertainty of the output.
Despite the high accuracy of predictions in Deep Neural Networks, integrity is a factor that is very important in making Neural Networks (NN) sufficiently safe to be used in safety critical systems. Developing NNs to work in safety critical systems such as autonomous vehicles [8], healthcare [9], and aviation [10] requires the networks to be dependable. The goal of this thesis is to explore if uncertainty and probabilistic methods can help achieve higher levels of integrity.
This master thesis focuses on investigating the impact uncertainty have on the integrity of Neural Networks. To make Deep Neural Networks sufficiently safe to be used in safety critical systems, it requires the network to be aware of the correctness of the predictions made, but also the uncertainty of the predictions. By having this relationship, it might be possible to form a decision based on the risk involved in different situations. To then be able to decide based on the correctness of the DNNs output and the uncertainty, more considerations can be made upon the risk involved in each decision. Thus, more dependable outputs could be achieved. To solve this problem, an NN that uses uncertainty will be implemented. This network will be analysed and evaluated in the aspects of integrity.
2.
Background
Artificial Neural Networks (ANN) are mathematical models based on the biological nervous system of humans and animals. Neurons are linked together to form a network where each neuron is a processing unit capable of learning and adapting. Neural Networks are versatile and can be trained to do a variety of things. In this thesis Artificial Neural Networks will be referred to as Neural Networks.
2.1
Deep Neural Networks
Deep Neural Networks (DNN) are networks with multiple layers such as input layer, hidden layer, and output layer. Each layer consist of a network of neurons connected together to other neurons and layers. The idea of neurons is based on the Threshold Logic Unit (TLU) introduced in 1943, where an input is compared to a threshold and activated if the input exceeds the threshold [11]. In 1957 Rosenblatt introduced the first perceptron, a system that applies probabilistic principles instead of deterministic behaviour [12]. Widrow developed the Adaptive Linear Neuron (ADA-LINE) in 1963, a system which automatically adjusts variable weights [13]. Both of these methods lay ground to further development, but the first generation of neural networks are limited in the learning process. The second generation of neural networks consist of more advanced networks such as Convolutional Neural Networks (CNN), and Long Short Term Memory (LSTM) for Recurrent Neural Networks (RNNs) [14]. The learning process of these methods are mostly based on the back-propagation of the error signal. With the progression in technology for Graphical Processing Unit (GPU) and increased storage for big data DNNs have considerable potential with increased hardware performance. Different architectures of Deep Neural Networks were proposed by Liu et al. [15] with four categories, Restricted Boltzmann Machine (RBM), Deep Belief Network (DBN), Autoencoder (AE) network and deep Convolutional Neural Network (CNN). Furthermore, addi-tional categories such as Deep Probabilistic Neural Networks [16], Deep Fuzzy Neural Networks [17], and Generative Adversarial Networks [18] use uncertainties and probabilistic approaches. Image classification, object detection, and speech recognition are application areas that DNNs have had great success. Multiple well known architectures for DNNs exists, such as AlexNet by Krizhevsky et al. [19] for image classification, Microsoft Residual Neural Network (ResNet) designed by He et al. [20] for image recognition, and VGG-Net designed by Simonyan and Zisserman [21] for large scale image recognition. These networks have proven to be very successful in the areas of application, providing impressive accuracy, which indicates the usefulness of DNNs.
2.2
Bayesian Neural Networks
In the 1990s, Bayesian Neural Networks (BNN) were suggested by MacKay [22], Hinton and Neal [23]. These networks offer a probabilistic interpretation of the traditional NNs. The weights of the deep networks had been changed by inferring distributions for each weight in the system with the help of Bayes’ theorem.
Pr(A|B) = Pr(B|A) Pr(A)
Pr(B) (1)
The approach is described by inferring the prior distributions Pr(A) to each weight times the likelihood of the observations Pr(B|A) divided by the normalizing constant Pr(B) to achieve the resulting posterior probability Pr(A|B). This approach succeeded in offering robustness to over-fitting, uncertainty estimates, and the ability to learn from smaller data sets.
By placing prior distributions on the weights of an Neural Network, the Bayesian method in-duces a larger distribution for the parametric set of functions. Notations for the weight matrices Wi and bias vectors bi for layer i, a standard matrix is commonly placed with Gaussian prior dis-tributions for the weight matrices, p(Wi) = N(0, 1), for simplicity a point estimate is assumed for the bias vectors [7]. Bayesian models make use of likelihoods such as Gaussian [24] or Softmax [25].
2.3
Dependability
Neural Networks are of great interest for multiple industries that require high levels of dependability in systems used for their work. Dependability is a broad term that considers attributes, means, and threats. In dependability, the attributes of a system can be defined as availability, reliability, safety, confidentiality, integrity, and maintainability and more depending on the system. The means are ways of achieving the attributes, which include fault prevention, fault tolerance, fault removal, and fault forecasting. Threats are events that endanger the dependability of a system, such as faults, errors, and failures [26].
Integrity is an essential attribute of an NN which describes the correctness of data in a system. For an NN this means keeping the predictions made by the NN as correct to the ground truth of the input data, thus, maximizing the correctness of a prediction.
2.4
Overfitting
Neural Networks are trained using a dataset. This dataset is often divided into a training set, validation set, and test set. Overfitting is a phenomenon caused in training when a model can predict or classify very well on data included in the training set, but when faced with data outside of the training set, the accuracy is not as good. This is caused by the model being too closely fitted to the training set. Rather than learning to predict or classify data from outside of the training set, the model memorizes data based on the training set and gives a prediction. Noise and unique training data can contribute to overfitting in a model as this can be generalized as specific features in the training set. Enabling the model to generalize training data better reduces the chance of overfitting occurring [27].
Reducing or eliminating the chances of overfitting can be done with several methods. Dropout is a method where neurons are given a probability not to be used based on the drop out rate, which is random for each iteration. Regularization methods such as Least Absolute Deviations and Least Square Errors reduce the weights of neurons for less important features in a model. Early stopping is a method that limits the subsequent training epochs to avoid overfitting by cross-referencing the accuracy of the training set and the validation set and stopping the training before overfitting occurs [27].
2.5
Uncertainty
Numerous sources of uncertainty exist. In engineering, uncertainties are commonly divided into two categories, aleatory and epistemic uncertainty.
Aleatory is a word derived from the Latin word alea, which means rolling of dice. In the context of Neural Networks aleatory uncertainty is presumed to be intrinsic randomness of a phenomenon, which can be described as noise in the observations [28]. It is a form of input-dependent uncertainty that arises in measurement errors and hidden variables [29].
Epistemic is a word derived from Greek which means knowledge. Thus, epistemic uncertainty can be presumed as uncertainty in knowledge or data in the context of Neural Networks [28]. Therefore, an increased amount of epistemic uncertainty is a result of a lack of sufficient training data, which gives an inversely proportional dependence; less training equals more uncertainty. Collecting and training on more data, in turn, reduces the epistemic uncertainty [29].
Out-of-distribution data is another example of uncertainty which is encountered when a Neural Network is given an input of data that the network is not trained for [30]–[32]. Neural networks trained to classify breeds of dogs can experience this when faced with a picture of a cat. In this scenario, it is most likely that the NNs will answer with the most confident guess. However, as the NN is not trained for this input, the result would be uncertain. Out-of-distribution data is an issue for autonomous cars when faced with unique situations with no prerequisite training. This could affect the network to make a risk filled decision [33]. Avoiding the risk could be possible by returning a prediction with information on how far away the data point is from the data set.
3.
Related Work
Many different state of the art methods of estimating uncertainty exist. By reviewing each method and weighing the advantages and disadvantages of each method, a method suiting the needs and limitations of this thesis will be developed.
3.1
Stochastic Gradient Descent
Stochastic Gradient Descent (SGD) is an iterative, step-wise method that starts from a random point in a function and gradually steps down its slope until the lowest point is found for that function. This method is an adaptation of the gradient descent method that does not use a stochastic or random behaviour. Total gradient descent or classical gradient descent considers each data point and requires a huge amount of computations. Making the method stochastic reduces the amount of computations required because only a few examples are required to, on average, perform the same as a full sweep of total gradient descent [34].
3.2
Stochastic Variational Inference
Stochastic Variational Inference (SVI) by Hoffman et al. [35] is based on the traditional variational inference by Jordan et al. [36] which uses transformation of complex inference problems into high dimensional optimization problems. Optimization of the traditional variational inference is done by an algorithm for coordinate descent and iterating this for each data point in the dataset. A full sweep of the dataset is required for each iteration, which makes it inefficient for larger datasets [35]. Stochastic Variational Inference is a more efficient algorithm derived from stochastic optimization [37] which is a technique that identifies gradient estimates for the objective. Stochastic optimization used in combination with traditional variational inference reduces the amount of data points required for each iteration and is how SVI achieves effectiveness in larger datasets.
3.3
Deep Ensembles
Deep Ensembles is the currently most popular and successful method of estimating uncertainty. This is a non-Bayesian method that does not use distributions, however, following a probabilistic approach, this method utilizes Stochastic Variational Inference (SVI). Deep Ensembles produces good results for predictive uncertainty quantification as seen in Lakshminarayanan et al. [38]. Their method captures two types of uncertainty, model uncertainty, also referred to as epistemic uncertainty in this thesis, and out of distribution uncertainty. Model uncertainty is captured via the Deep Ensembles method by averaging predictions for multiple models consistent with the training data. Out of distribution uncertainty is captured via adversarial training, which produces a local smoothness to achieve robustness for model misspecification and out of distribution examples. Ovadia et al. [39] shows the difference in performance for Deep Ensembles and Bayesian Neural Networks using SVI. Deep Ensembles consistently outperforms Bayesian Neural Networks but requires increased computational effort.
3.4
Deterministic Uncertainty Quantification
Deterministic Uncertainty Quantification is a method that trains a deterministic deep model that is very efficient at finding and rejecting out of distribution data. The approach proposed by van Amersfoort et al. [40] is based on the idea of Radial Basis Function Networks. Softmax models are replaced with training that is scaled with a novel loss function together with a centroid updating scheme, which achieves a matching accuracy. Gradient penalty is implemented to enforce detectability of alterations in the input, which reliably enables the detection of out of distribution data. Their method scales well with larger datasets and can compete with and improve upon Deep Ensembles for out of distribution detection when compared on difficult dataset pairs such as SVHN vs. CIFAR-10, and MNIST vs. FashionMNIST, using a single model.
3.5
Monte Carlo Drop Out
Normal drop out is a method of regularization to avoid overfitting that applies in training time. During test time drop, out is not applied, and all connections are present, yet the weights are adjusted according to the keep ratio. The keep ratio can be described as, 1 - dropout ratio. During test time, this model produces predictions that are deterministic since, at one test point, the model will always make the same prediction if no other source of randomness exists.
Monte Carlo drop out differs from normal drop out since the drop out is done both during training and test time. During test time, the prediction is based on what connections are randomly kept. This now produces a probabilistic prediction. Given the same test point, the prediction will now be random for each time since a probabilistic behaviour is introduced. Monte Carlo drop out is often used for estimating SVI as showed by Gal [7].
3.6
Simultaneous Quantile Regression and Orthonormal Certificates
Simultaneous Quantile Regression (SQR) is a method of estimating aleatory uncertainty proposed by Tagasovska and Lopez-Paz [41]. Their method targets a variable and estimates the entire conditional distribution, which means that an entire sub-population is estimated for the target variable [42]. By not relying on predictions or ensembling models for estimation SQR makes the estimation on all the non-linear quantiles of the distribution jointly. This approach reduces storage requirements, training, and evaluation time. SQR models multiple types of aleatory uncertainties such as asymmetric, heteroskedastic, multimodal, non-Gaussian, and skewed noise in data, unlike prior work in uncertainty estimation for deep learning [38], [43], [44]. It is possible to implement SQR for already trained or untrained NN by adding it as an output layer.
Orthonormal Certificates, a proposal from Tagasovska and Lopez-Paz [41] is a way of estimating epistemic uncertainty. This approach is applicable to classification and regression problems. By looking for the least variant components in training features, the most accurate samples are found and placed near zero for the training distribution and an increased variance placed further away from the training distribution, signalling epistemic uncertainty. High levels of variance from the training distribution can be identified as out of distribution samples with this method.
3.7
Dependability Metrics
Measuring the dependability of a neural network and the probability of how successful an NN is at making predictions is a hard task. Attempts to measure dependability is often made by measuring the performance of an NN. O’Brien et al. [45] propose that how a network fails might just be as important as the performance of a network. Their proposal is to address the failures in categories of, task failures which do not violate safety constraints, and, harmful failures which violates safety constraints. Their work focuses on evaluating NNs that have already been trained where the operating environment differs from the training conditions to develop a metric of dependability.
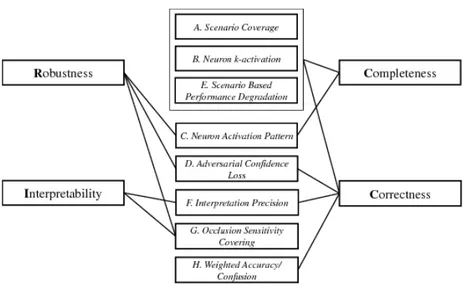
Figure 1: Relations between RICC criteria and the proposed metrics by Cheng et al.
In the four attributes seen in Figure 1, Cheng et al. [46] propose a set of dependability metrics, Ro-bustness, Interpretability, Completeness, and Correctness (RICC). Robustness against adversarial perturbation and distortion of an NN. Interpretability of an NN to understand the knowledge and its importance and what exactly the NN have learned. Completeness in order to see that an NN have learned all of the possible scenarios from the data in the training process. Correctness to evaluate that the NN is working as intended without the presence of errors in its performance. These attributes define eight metrics that can be used to determine the dependability of an NN.
Figure 1 describes the relation between the attributes and metrics for a better understanding of how a metric is derived from an attribute and which attribute include what metrics.
4.
Problem Formulation
Deep Neural Networks have proven to be an useful tool for many tasks in image classification, object detection, and speech recognition. Due to the ever improving performance and capabilities of DNNs, it is easy to forget some of the fundamental flaws in these systems. Neural networks are thought of as black boxes as there is limited insight into how these systems make their decisions. Larger networks increase the level of complexity, which makes it harder to understand how decisions are made and what information these decisions are based on. Uncertainties affect the DNNs at great length and has to be considered when asking the important questions of how a DNN works. Events such as out of distribution uncertainty are great examples of where the black box behaviour of a DNN is clearly displayed. When a DNN is faced with a sample outside of its training, it is impossible to predict the action the DNN takes if there is no design for reducing or preventing risks for such scenarios. Improving the integrity of DNNs is key when trying to understand how data is used and if the data within a DNN is correct, reducing the black box behavior.
4.1
Hypothesis
The intention and goal of this thesis is to prove the hypothesis as follows.
Implementing uncertainty as a parameter within a DNN increases the level of integrity of the system.
4.2
Research Questions
Research questions have been formulated to help prove or disprove the hypothesis. RQ1: How does uncertainty estimations affect the integrity of an NN?
RQ2: How can uncertainty help develop safety critical DNNs? RQ3: What limitations do uncertainty estimations have?
4.3
Limitations
Limitations in performing the master thesis.
• Coronavirus (Covid-19) limits the ability of working on Mälardalens University’s grounds. • Limitations in hardware as the majority of work is done from home on a private computer.
4.4
Research Goals
The goal of the master thesis is to implement a probabilistic NN with uncertainty estimation to test and explore how the integrity of the system improves. Implementing uncertainty as a parameter in an NN is a way of improving the correctness of data in the system while also enabling the system to make decisions based on levels of uncertainty involved for predictions.
By contributing with a dependability viewpoint on NNs, this master thesis directs attention to some of the fundamental flaws in NNs and possible solutions and ideas of how these flaws can be reduced or at best removed from future systems.
5.
Method
The method that will be used to answer the proposed research questions, seen in section 4.2, will be divided into stages and start from literature studies to find an appropriate method for uncertainty estimation and methods to evaluate the outcomes.
Stage 1: The literature studies will be performed to give knowledge in state of the art research, in-cluding how methods for uncertainty estimations work. How and which evaluations can be performed to see the integrity of the estimations. The goal of the literature studies is to pro-vide a basis for answering the research questions and propose method(s) for implementation. Stage 2: Implementing the method(s) chosen based on the literature studies to begin development and experimental testing. Stage 2 will provide further evidence to the research questions by producing output for analysis and evaluation.
Stage 3: The goal of this stage is to provide evidence for the research questions. Evaluations, analysis, and verification of the outputs from stage 2 will prove RQ1, RQ2, and RQ3.
Figure 2: Visualization of the method.
5.1
Choice of Method
Bayesian Neural Networks have different approaches and ways of implementation, training a BNN from scratch, or applying a method for uncertainty estimations on top of an already trained network. The goal of this thesis is to answer the research questions shown above. The focus is on the evaluation and analysis of uncertainty in Deep Neural Networks. For this purpose, a trade off is made for the implementation and development of the method. The chosen method requires ease of implementation while producing good and reasonable results that can be evaluated to draw relevant conclusions on uncertainty in DNNs.
6.
Results
The NN that has been implemented and used is a Bayesian Neural Network. The implementations have been done with Python as the coding language. Anaconda is used as an installer for packages and dependencies needed to run the BNN. The coding is done in Jupyter notebook. PyTorch is an open source framework for deep learning built for Python which supports Tensor computation such as Numpy and strong support for GPU training. Including Tensor operations from Torch and Autograd with an extensive neural network library and a large amount of flexibility. Optimization methods such as Adaptive Moment Estimation (Adam), Root Mean Square Propagation (RM-SProp), Stochastic Gradient Descent (SGD), and more as well as methods for loss optimization. Pyro is a library for probabilistic programming and variational inference and is used to turn the NN into a BNN, which takes advantage of a probabilistic approach and Bayes’ theorem.
The MNIST dataset is used for training the BNN, this dataset consists of hand drawn digits ranging from 0 to 9. This dataset is produced by the National Institute of Standards and Technol-ogy [47] and is commonly used for image processing systems. MNIST consists of 60000 training images and 10000 test images. The images are flattened with the size of 28x28 pixels with black and white colour.
6.1
Bayesian Neural Network
Testing and evaluation have been performed on a BNN based on the network created by Chopra [48] with changes to the functionality and training of the BNN. The BNN is a feed forward NN with one hidden layer of 1024 units and 10 output values equal to the number of classes in the MNIST dataset.
6.1.1 Training
Optimization of the BNN is done using the Stochastic Variational Inference methods Adaptive Moment Estimation (Adam) and Evidence Lower Bound (ELBO) for loss optimization of the training process. The BNN is trained using the Central Processing Unit (CPU) and not the GPU with 8 iterations, which yields a saturated loss ratio. After this point, the time increment from training does not yield an improvement large enough for the time required of another training iteration as the loss is converging. The training input data are batches of input and output pairs of the images and labels, which are unique for each iteration. By utilizing Adam and ELBO for optimization, the entire dataset is not needed as an input for training because smaller data batches are used for every gradient step the optimizer does. Variational inference immensely speeds up the training speed of the network because of the thousands of steps the optimizer does and the fact that there is no need to feed the entire dataset at each gradient step to find the best parameters.
6.1.2 Predictions
When making predictions after the training is complete, 100 samples are used for each instance of weights and parameters. Essentially this method samples a new neural network 100 times before making the prediction, which creates the option of uncertainty estimation for the outputs. The outputs are logsoftmaxed and converted into probabilities by exponentiation so that each input digit has 100 probability values. A median of the 100 probability values is used to pass a threshold probability. If this threshold is passed, the digit from the median acts as an output of the BNN.
6.2
Test Results
Testing the BNN is an important step to see the usefulness and importance of the features and attributes of a BNN in comparison to a standard DNN.
steps are taken with the ELBO method. The loss is calculated according to loss ratio Lr, total gradient steps Gs, and amount of data in dataset Dd.
Lr = Gs/Dd (2)
Optimization of the BNN is done by reducing the loss ratio to a point where convergence is achieved. Iterations of multiple gradient steps are used to achieve convergence.
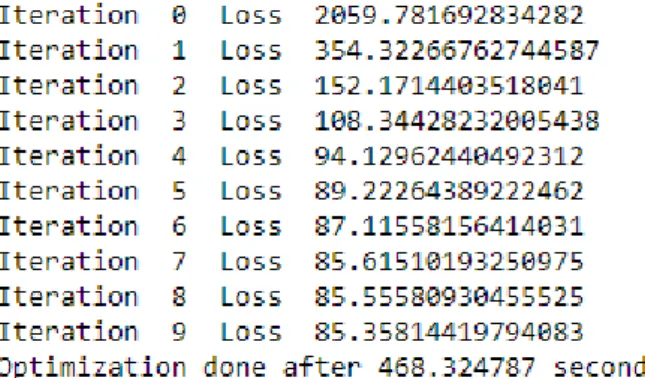
Figure 3: Optimization cycle with 10 iterations.
Figure 4: Optimization cycle with 8 iterations.
After the optimization is completed, the resulting iterations needed for convergence in the BNN is 8 iterations, which is visible as iteration 7 in Figure 3. After the 8th iteration the change in loss ratio is arguably small enough to be considered not worth the increase of time spent on training. By reducing the iterations to 8, it is visible in Figure 4 that the time spent on training is reduced by almost 6 %, and the change in loss ratio is at best less than 1 %. Due to the gradient steps being made, it is also possible for the steps to increase the loss ratio as smaller batches of data are used and not the entire dataset at once.
6.2.2 Predictions
The predictions are made with variations of the probability threshold. The process of making predictions takes between 4-5 minutes, and the entire test set of the MNIST dataset, which is 10000 images, is tested on. By allowing a threshold to decide whether or not the BNN makes a prediction based on the probability of an output, the prediction can be deemed too uncertain for the BNN to make a valid prediction, and in this case, the image is skipped. Each prediction made is a result of the probability of an output. Accuracy Acc, is calculated from the total correct predictions Pcorr divided by the total predictions made Ptot.
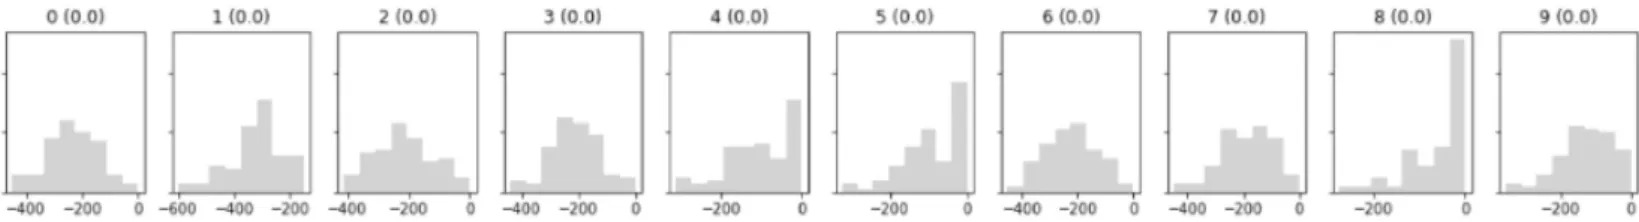
Figure 5: Predictions without skipping any input data.
When the BNN makes predictions without the option of skipping, the overall accuracy is lower and more predictions are incorrect, which can be seen in Figure 5. Although all inputs have been given a predicted output, the functionality of having a probability threshold is lost.
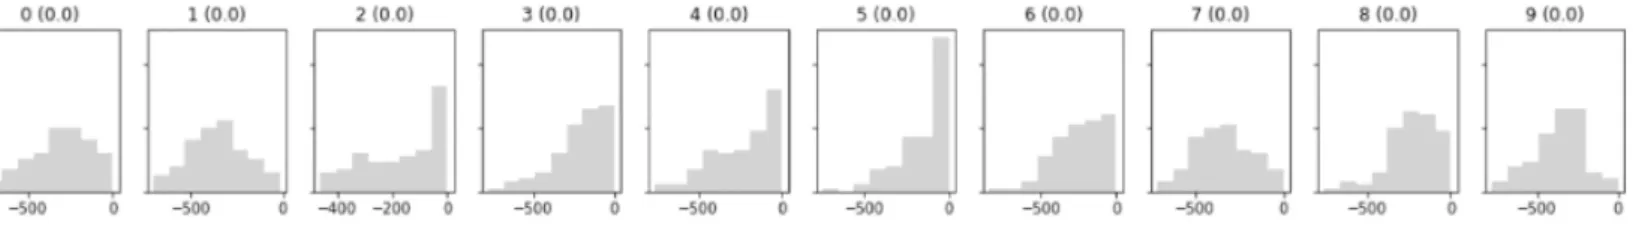
Figure 6: Predictions with 30 % threshold.
Figure 7: Predictions with 60 % threshold.
Allowing the BNN to skip images improves the accuracy of the images that predictions are made on, although the number of images that are skipped increases as the threshold increases, resulting in an overall loss in the number of predictions made. It is still possible for the BNN to make incorrect predictions if it is hard to differentiate between two digits, but instead of having to make a prediction on every output no matter the level of uncertainty, the BNN can refuse to make predictions based on the probability threshold.
6.2.3 Final Output
Examples of the final outputs are displayed with a graph for each digit and the probability asso-ciated with each digit for a prediction. These graphs can be seen in the Appendices A-F.
Figure 8 is an example of a final output where the X-axis describes the median-log probability before exponentiation. The Y-axis describes the probability of the prediction after exponentiation in a 0 - 1 probability scale. The more focused the histogram is on the rightmost staples, as close to 0 on the X-axis as possible, the more certain the BNN is of the prediction being correct. A mixture of staples in a histogram displays more uncertainty for a prediction. The probability threshold is set to 60 % for the figures in the Appendices A-F.
Making correct predictions to simple and clear samples proves a high level of probability which can be seen in Appendix A. Even though there are low levels of uncertainty for other digits the probability of the output being 3 is dominant.
It is visible that for the real digit 7 the network makes an incorrect prediction in Appendix B. Due to the resemblance to the digit 9 the BNN deems that the digit is 9 instead of 7. However, it is also visible from the histogram of digit 7 that there is a resemblance but the uncertainty is higher in the histogram for the digit 7 than 9.
When the BNN does not make predictions, it is interesting to see what is happening. In Appendix C and D examples of this are displayed.
It is visible in Appendix C that the digit 8 is the real digit in the image and that the digit 8 has the highest probability of around 50 %. As the probability threshold is set to 60 %, the prediction is not made since the threshold is not fulfilled. This exception can be made in the circumstances that the level of epistemic uncertainty is too high, which can be reduced by more training.
Appendix D shows the opposite. An incorrect prediction is skipped. The real digit 0 is what the image shows, and the BNN shows that the digit 8 has the highest probability for this image. The uncertainty for this image is high due to the fact that the digits 4, 6, and 9 also has a probability of around 20-30 %.
6.2.4 Out of Distribution
Scenarios with out of distribution inputs are very likely for an NN to encounter. The risks involved in these scenarios can be reduced by setting a higher probability threshold, which effectively reduces the risk of uncertain predictions being made. Epistemic uncertainty describes the uncertainty in knowledge which is reduced by the probability threshold as the network is not forced to make predictions when high levels of epistemic uncertainty exists for an input. Testing the BNN on randomly generated data in an image can give important information on what the effects of uncer-tainty have in an image. Unceruncer-tainty in predictions hinders the network from giving overconfident results. Testing 100 images with randomly generated data as in Appendix E resulted in high levels of uncertainty in each image and no prediction being made for any of the images. It was found that the digits 2 and 5 repeatedly proved higher probability than other digits, which could be due to lack of training or the network being too small.
Testing the images on the not-MNIST dataset, which is a dataset of alphabets and custom fonts for alphabets, it is possible to see a representation of how good the BNN is at rejecting predictions on a dataset aimed to trick the BNN, see Appendix F. Out of the 362 images tested on from the not-MNIST dataset, the BNN consistently skips the predictions on an average of 80 % of the images.
7.
Discussion
This section will discuss the results, research questions, and the significance of implementing un-certainty estimations in DNNs. The method and restrictions are reviewed to see what changes would be beneficial and what trade offs are done to complete the thesis.
7.1
Restrictions
The two major restricting factors that have been present for the entire thesis is the Coronavirus (Covid-19) and the hardware that implementation and testing of the BNN have been performed on.
7.1.1 Coronavirus
Due to the current situation created by the Coronavirus, a limited amount of on site development and testing have been performed. Recommendations from the Swedish authority, Folkhälsomyn-digheten [49] have altered during the time that the thesis has been performed, and a strong rec-ommendation of working from home has stayed true for the entire duration. The decision was to perform as much as possible of the thesis from home, with only some exceptions during the start of the thesis.
7.1.2 Hardware
Making the decision of working from home meant that the hardware available for implementation was limited to a personal computer with the CPU Intel i7-4790k, GPU ASUS Strix GTX 970, and Windows 7 installed. This led to some issues when installing the software needed for implemen-tation and testing due to the Windows 7 operating system. After correct drivers for the software used were found, the CUDA support for the GPU did not work, and a decision to go with CPU training and support was made since performance with the CPU was satisfactory.
7.2
Method
This thesis applies and combines a method of literature studies and practical implementation and testing of a BNN. This method clarifies how uncertainty estimations work theoretically by reviewing state of the art research on uncertainty estimation and multiple methods of achieving uncertainty as an attribute for neural networks. Many methods exist for this purpose with varying advantages and drawbacks. Getting an overview of the methods available is important to understand what metrics are important and see the performance of each method. Implementing a BNN was done by making trade offs. Due to the restrictions in hardware, a method that is computational heavy or a large dataset is not feasible. Many of the methods that are in the related work section 3. require prior knowledge of how uncertainty is used in an NN and are very advanced. In order to complete this thesis in the scheduled time frame, the workload must be feasible, and all stages of the time plan must be held. Therefore the BNN by Chopra [48] was chosen as it is a standard BNN which displays many of the important behaviours, attributes, and functions associated with a BNN. The MNIST dataset is large in terms of the amount of images but not the size and quality of the images, which suits the limitations. The focus of the thesis is to explore the impact uncertainty has on an NN which is achieved with the help of existing tools and networks. Creating and developing an NN that uses uncertainty would be a whole other project which requires a lot of knowledge and experience of how these networks work in detail. This is why existing tools have been utilized to enable analysis of the method of uncertainty estimations.
The combination of literature studies and practical implementation had some flaws in the transitioning phase caused by the lack of knowledge in the tools and software used for the imple-mentation. The literature studies focused heavily on the background information of the subject to form a foundation of knowledge to learn the basics. Related work was a more advanced part
this point, it was clear that the literature studies were primarily focused on the theoretical infor-mation regarding the methods but only a small amount of inforinfor-mation regarding what tools and software were needed for the practical implementation. Transitioning from the theoretical phase to the practical phase had some flaws, which could be avoided by having a narrower focus on the methods available and including parts of how to perform the practical implementation in an earlier stage.
Having the option of better hardware and the possibility of GPU training would create more choices in the selection of method and size of the network. Due to software issues, an approach with the CPU was used as the performance was still satisfactory.
7.3
Training
Training the BNN was done with the methods Adaptive Moment Estimation (Adam) and Evidence Lower Bound (ELBO) on the CPU through using batches of data. This sped up the training process but, no more extensive review of what methods would be best suited to optimize the training process to reduce the time cost and loss ratio were conducted. The reason is that the training was conducted with an older setup of hardware and with the help of an CPU instead of a GPU. This could be explored to reach better results and improve the performance of the overall network.
7.4
Bayesian Neural Network
Instead of using only weights in an NN to control the predictions and outputs from a system BNNs infer probability in the system. Inferring probability in NNs grants advantages to the system’s dependability and makes it more transparent how the weights are set based on the level of probability associated with an image. The association of black boxes and NNs is reduced because the process of how weights are set is made more transparent by having prior distributions, posterior distributions, and probability inferred to the system. This process enables the system to predict the probability of an output instead of the accuracy of an output. Predicting the probability of an output rather than the accuracy grants a better understanding of what causes the prediction not to reach 100 % correctness, which is where uncertainties play a role. Reaching as high a probability as possible is the goal when making predictions, and uncertainty is an obstacle that reduces the correctness of predictions. Two different types of uncertainty, Aleatory, and Epistemic uncertainty, are important for two different reasons. Aleatory uncertainty is a form of input-dependent uncertainty that is hard to control for real scenarios as many factors can contribute to increased aleatory uncertainty. In the MNIST dataset, sources of aleatory uncertainty have a wide variety since all images are hand drawn digits. When step wise analysing the order a sample is added to the dataset, the start is a person writing with a pencil and paper, which contains a large amount of factors that can contribute to aleatory uncertainty. Some factors could be pencil sharpness, pencil to paper pressure, and carelessness in writing, to name a few. Aleatory uncertainty can be reduced by optimizing the data sampling process, being aware and cautious of the threats contributing to this problem. Epistemic uncertainty is easier to reduce as it is a form of uncertainty in knowledge. Knowledge in NNs is directly connected to how well trained a network is and how good the network is at making predictions. Categorizing uncertainty helps realize what different factors and threats exist and how they can be reduced or eliminated. Reducing the uncertainty that is present in a system is a way of achieving better predictions. Uncertainty is of major importance in describing what the counterpart to correctness is in a prediction in order to get better results. Accuracy and inaccuracy are very black and white. Accuracy is where data is analyzed and confirmed to comply with what the network has learned, a statement of correctness. Inaccuracy is too narrow of a term and definition to what causes the system not to be accurate, a statement of faultiness. Probability and uncertainty are in comparison two terms that describe the level of certainty that an input matches the training of an NN has learned to identify and the presence of faults present in the decision making process.
7.5
Industrial Applications
Neural Networks have great potential for future installments to improve automation in many different industries and applications. Image classification and obstacle detection are two areas that are extremely useful for the automotive and aerospace industries, where an ultimate goal is to develop autonomous vehicles. Recognizing different situations, road signs, and areas are things commonly done by a driver in traffic that an NN needs be able to perform with high confidence in order to remove the driver from the controls. Much visual information is present when driving and, visual perception is the most important source of information when driving. A system with the goal of replacing a driver must be able to handle large amounts of visual data and make confident decisions based on the input data. Aircraft have different environments in which they operate, and the critical phases are takeoff and landing. These phases require high awareness of the conditions that affect the runway and possible objects present.
Both industries follow guidelines and standards for development, but the requirements are tougher in the aerospace industry as there are multiple critical systems needed to retain safe flight, aircraft operates in harsh environments and due to the high passenger capacity for larger commercial aircraft. For smaller aircraft, the requirements are lighter and more comparable with the requirements set on buses. Validation and verification are essential to prove that the systems in focus works as intended and comply with the system specification. Rigorous testing is performed to cover all specific scenarios and proving that the system is, in fact, compliant with the specification. Software is hard to verify, and proving that a system is sufficiently safe is a difficult task. Neural Networks can be very large with a massive amount of neurons and hidden layers. Verifying such a large and complex NN is almost impossible. Bayesian Neural Networks have the advantage of being more transparent as it is defined how the weights are set with the help of probability and distributions. This is a clear advantage in explaining how the system follows the specification and what uncertainties might cause unspecified behaviour. Defining what causes faults to occur is an important step in verifying a system to understand what faults need to be tolerated, reduced, or prevented for the system to be sufficiently safe. Adapting the performance driven development of achieving as good results and accuracy for NNs into a safety-critical industry requires there to be traceability and verification of the NNs.
Probability thresholds are useful to ensure that a prediction made by the BNN exceeds a desired amount of probability. In image classification, it is essential for a prediction to have a very high probability for the system to make a correct decision based on what information is displayed. This threshold only ensures that a prediction has a probability that exceeds the desired level, but it does not ensure that the prediction is correct. The correctness of predictions depends on the training of a BNN. The threshold acts as a final layer before an output is propagated. This threshold is useful for out of distribution and randomly generated data scenarios, which can be seen in Appendix E. The BNN rejects 80 % of input data from the not-MNIST dataset with the threshold set to 60 %. Rejecting such a large amount of predictions on a dataset aimed to confuse the BNN is an excellent result due to the limited training and simple design of the BNN. The desired level of the threshold is different for obstacle detection. Obstacle detection is a whole other task as the goal is to identify when an obstacle is blocking or obstructing the field of view. At this point, it might be more important to identify if there is a possibility that an obstacle is in the way which may require a lower threshold of probability or no threshold at all. Due to the importance of identifying an obstacle, if there is one in the way, the NN might have to make predictions with lower probability or a certain level of probability for a specific classification.
7.6
Research Results
Integrity in NNs defines the Correctness of data within a system. When comparing integrity to the dependability attribute Correctness by Cheng et al. [46] it is possible to see a parable to the research conducted in this thesis. Cheng et al. [46] describes Adversarial Confidence Loss as a metric of measuring the Correctness within a NN. Adversarial Confidence Loss is a metric assumed to include many different sources of adversarial perturbation techniques, such as rotation, distortion,
succeeded the 60 % threshold. As the digits 2 and 5 were commonly producing higher levels of probability, there is a possibility that training for these digits was lacking or that the combination of both lines and curves which the digits 2 and 5 have, are harder to differentiate, proving the presence of uncertainty. The out of distribution tests also proved high confidence in disregarding false inputs, with 80 % of the predictions being rejected when the threshold was set to 60 %.
When the BNN is forced to predict on all inputs, the accuracy of the predictions is 90,84 % resulting in 916 incorrect predictions out of the 10000 test images. When adding a probability threshold of 30 %, a total of 1130 images are skipped, but the accuracy increases to 95 % resulting in 439 incorrect predictions. By adding the probability threshold, the amount of incorrect predictions is cut in half, but a large amount of inputs receive no prediction due to the 30 % probability threshold. Although 1130 inputs were skipped, 439 of these were inputs that had a probability lower than 30 %, which led to incorrect predictions. Approximately 39 % of the skipped inputs were incorrect inputs, which overall proved to increase the accuracy when predictions were made. Comparison of the probability thresholds 30 % and 60 % shows that the 60 % threshold achieves a slightly higher accuracy of 0,21 %. However, by skipping 53 more inputs, the slight improve-ment in accuracy is not as interesting as the amount of incorrect images skipped. Calculating the difference in accuracy based on the amount of predictions made shows that 22 of the 53 skipped inputs would otherwise be incorrectly classified. This threshold is an exciting feature that enables the ability to skip predictions when the uncertainty within an input is too high. In this case, the 60 % threshold removes approximately 500 incorrect classifications out of the 916 incorrect classi-fications made without a threshold. Uncertainty is an important aspect when making predictions, and a large amount of uncertain predictions that resulted in incorrect outputs was prevented using the probability threshold.
8.
Conclusions
This research was performed to evaluate the impact uncertainty has on the integrity of a Deep Neural Network. Analyzing the sources of uncertainty and the effects of estimating uncertainty in an NN was done through evaluating a Bayesian Neural Network. Implementing the BNN that uses uncertainty led to the possibility of testing how uncertainty affects predictions and how faulty inputs are propagated through the system. By discussing the results from the implementation and functions of the BNN multiple aspects of how to improve the integrity and ease the development of NNs in safety critical systems were found. By answering the research questions, the hypothesis will be proved, and research will be concluded.
8.1
Research Question 1
How does uncertainty estimations affect the integrity of a NN?
Integrity describes the correctness of data and is an attribute of an NN which changes based on the level of uncertainty in the system. Uncertainty has a direct impact on the integrity in an NN, more uncertainty leads to a lower level of integrity in the system. Aleatory and Epistemic uncertainty define different kinds of uncertainty and what causes the presence of these in a system. By estimating uncertainty we acknowledge the presence of uncertainty. By doing so, it is possible to see what sources of uncertainty exist inside of the NN and in the input images, which allows collection of information of these uncertainties. Estimating uncertainty makes it possible to reduce or remove the sources of uncertainty, which improves the integrity of an NN.
8.2
Research Question 2
How can uncertainty help develop safety critical DNNs?
Working with safety critical systems includes working with faults of the system. Faults have different classifications depending on the source of the fault such as, development, external, natural, software, malicious faults, and more. These faults have been identified by looking at different ways a system can be faulty. For NNs, this is what uncertainty enables the system to do. Identify different sources of uncertainty in the inputs, training, predictions, and outputs. By investigating the sources of uncertainty, it is possible to identify and classify the potential threats to the NN and provide proof for solutions that reduce or remove the threats.
8.3
Research Question 3
What limitations do uncertainty estimations have?
Uncertainty in itself is a definition of factors that affect the correctness of the predictions of an NN and contains a large number of specified and unspecified sources. Because uncertainty is, in fact, uncertain, the reasons why different kinds of uncertainty are present for different scenarios is not entirely known. Estimating the possible sources of uncertainty will not always include all sources of uncertainty as some might not be possible to sample using a certain method. Aleatory and Epistemic uncertainty are two classifications of uncertainty that we know are possible to reduce. However, more sources might exist that are undefined with varying impact. The lack of information regarding the effects of uncertainty in NNs is a limitation.
8.4
Future Work
This thesis enlightens how important uncertainty is for NNs and attempts to discuss how uncer-tainty can contribute to increased integrity for NNs. Implementing NNs in safety critical systems require the system to go through multiple developments processes and extensive testing to be regarded as sufficiently safe. This leads to multiple more questions of how an NN can reach a sufficiently safe level. Are there processes and metrics available to evaluate dependability for a unique NN? What sources of uncertainty exist, and how they affect Neural Networks? What is the
References
[1] A. Krizhevsky, I. Sutskever, and G. E. Hinton, “Imagenet classification with deep convo-lutional neural networks”, in Proceedings of the 25th International Conference on Neural Information Processing Systems - Volume 1, ser. NIPS’12, Lake Tahoe, Nevada: Curran As-sociates Inc., 2012, pp. 1097–1105.
[2] O. Russakovsky, J. Deng, H. Su, J. Krause, S. Satheesh, S. Ma, Z. Huang, A. Karpathy, A. Khosla, M. Bernstein, A. C. Berg, and L. Fei-Fei, “ImageNet Large Scale Visual Recognition Challenge”, International Journal of Computer Vision (IJCV), vol. 115, no. 3, pp. 211–252, 2015. doi: 10.1007/s11263-015-0816-y.
[3] C. Szegedy, A. Toshev, and D. Erhan, “Deep neural networks for object detection”, in Ad-vances in Neural Information Processing Systems 26, C. J. C. Burges, L. Bottou, M. Welling, Z. Ghahramani, and K. Q. Weinberger, Eds., Curran Associates, Inc., 2013, pp. 2553–2561. [Online]. Available: http://papers.nips.cc/paper/5207-deep-neural-networks-for-object-detection.pdf.
[4] D. Erhan, C. Szegedy, A. Toshev, and D. Anguelov, “Scalable object detection using deep neural networks”, in Proceedings of the IEEE Conference on Computer Vision and Pattern Recognition (CVPR), Jun. 2014.
[5] A. Graves, A. Mohamed, and G. Hinton, “Speech recognition with deep recurrent neural net-works”, in 2013 IEEE International Conference on Acoustics, Speech and Signal Processing, 2013, pp. 6645–6649.
[6] G. Hinton, L. Deng, D. Yu, G. E. Dahl, A. Mohamed, N. Jaitly, A. Senior, V. Vanhoucke, P. Nguyen, T. N. Sainath, and B. Kingsbury, “Deep neural networks for acoustic modeling in speech recognition: The shared views of four research groups”, IEEE Signal Processing Magazine, vol. 29, no. 6, pp. 82–97, 2012.
[7] Y. Gal, “Uncertainty in deep learning”, PhD thesis, University of Cambridge, 2016.
[8] P. Koopman and M. Wagner, “Challenges in autonomous vehicle testing and validation”, SAE International Journal of Transportation Safety, vol. 4, no. 1, pp. 15–24, 2016, issn: 23275626, 23275634. [Online]. Available: http://www.jstor.org/stable/26167741 (visited on 09/15/2020).
[9] E. Begoli, T. Bhattacharya, and D. Kusnezov, “The need for uncertainty quantification in machine-assisted medical decision making”, Nature, Jan. 2019. doi: 10.1038/s42256-018-0004-1.
[10] S. Zhou, Y. Zhou, Z. Xu, W. Chang, and Y. Cheng, “The landing safety prediction model by integrating pattern recognition and markov chain with flight data”, eng, Neural computing and applications, vol. 31, no. S1, pp. 147–159, 2018, issn: 1433-3058.
[11] M. WS and P. W, “A logical calculus of the ideas immanent in nervous activity”, Bulletin of Mathematical Biophysics, pp. 115–133, 1943.
[12] Rosenblatt, The perceptron, a perceiving and recognizing automaton, Project Para. Cornell Aeronautical Laboratory, 1957.
[13] B. Widrow, “Generalization and information storage in network of adaline ’neurons’”, 1962. [14] S. Hochreiter and J. Schmidhuber, “Long short-term memory”, Neural Computation, vol. 9, no. 8, pp. 1735–1780, 1997. [Online]. Available: https://doi.org/10.1162/neco.1997.9. 8.1735 (visited on 10/08/2020).
[15] W. Liu, Z. Wang, X.Liu, N. Zeng, Y. Liuc, and F. Alsaadid, “A survey of deep neural network architectures and their applications”, Neurocomputing, 234:11–26, 2017.
[16] J. Gast and S. Roth, “Lightweight probabilistic deep networks”, 2018 IEEE/CVF Conference on Computer Vision and Pattern Recognition, pp. 3369–3378, 2018.
[18] I. J. Goodfellow, J. Pouget-Abadie, M. Mirza, B. Xu, D. Warde-Farley, S. Ozair, A. Courville, and Y. Bengio, “Generative adversarial nets”, in Proceedings of the 27th International Confer-ence on Neural Information Processing Systems - Volume 2, ser. NIPS’14, Montreal, Canada: MIT Press, 2014, pp. 2672–2680.
[19] A. Krizhevsky, I. Sutskever, and G. E. Hinton, “Imagenet classification with deep con-volutional neural networks”, in Advances in Neural Information Processing Systems 25, F. Pereira, C. J. C. Burges, L. Bottou, and K. Q. Weinberger, Eds., Curran Associates, Inc., 2012, pp. 1097–1105. [Online]. Available: http : / / papers . nips . cc / paper / 4824 -imagenet- classification- with- deep- convolutional- neural- networks.pdf (visited on 10/02/2020).
[20] K. He, X. Zhang, S. Ren, and J. Sun, “Deep residual learning for image recognition”, in 2016 IEEE Conference on Computer Vision and Pattern Recognition (CVPR), 2016, pp. 770–778. [21] K. Simonyan and A. Zisserman, “Very deep convolutional networks for large-scale image
recognition”, CoRR, vol. abs/1409.1556, 2015.
[22] D. J. C. MacKay, Information Theory, Inference, and Learning Algorithms. Copyright Cam-bridge University Press, 2003.
[23] G. E. Hinton, S. Osindero, and Y. W. Teh, “A fast learning algorithm for deep belief nets”, Neural Computation, vol. 18, pp. 1527–1554, 2006.
[24] E. W. Weisstein. (). Normal distribution., [Online]. Available: https://mathworld.wolfram. com/NormalDistribution.html (visited on 01/07/2021).
[25] L. MIRANDA. (Aug. 2017). Understanding softmax and the negative log-likelihood, [Online]. Available: https://ljvmiranda921.github.io/notebook/2017/08/13/softmax- and-the-negative-log-likelihood/ (visited on 01/07/2021).
[26] A. Avizienis, J.-C. Laprie, B. Randell, et al., Fundamental concepts of dependability. [27] P. Skalski, “Preventing deep neural network from overfitting”, Towards data science, 2018.
[Online]. Available: https : / / towardsdatascience . com / preventing deep neural -network-from-overfitting-953458db800a (visited on 09/27/2020).
[28] A. Der Kiureghian and O. Ditlevsen, “Aleatory or epistemic? does it matter?”, Structural Safety, vol. 31, pp. 105–112, Mar. 2009. doi: 10.1016/j.strusafe.2008.06.020.
[29] M. Combalia, F. Hueto, S. Puig, J. Malvehy, and V. Vilaplana, “Uncertainty estimation in deep neural networks for dermoscopic image classification”, in Proceedings of the IEEE/CVF Conference on Computer Vision and Pattern Recognition (CVPR) Workshops, Jun. 2020. [30] D. Hendrycks and K. Gimpel, “A baseline for detecting misclassified and out-of-distribution
examples in neural networks”, ArXiv, vol. abs/1610.02136, 2017.
[31] S. Liang, Y. Li, and R. Srikant, “Enhancing the reliability of out-of-distribution image de-tection in neural networks”, arXiv: Learning, 2018.
[32] T. Devries and G. W. Taylor, “Learning confidence for out-of-distribution detection in neural networks”, ArXiv, vol. abs/1802.04865, 2018.
[33] C. Sitawarin, A. Bhagoji, A. Mosenia, M. Chiang, and P. Mittal, “Darts: Deceiving au-tonomous cars with toxic signs”, ArXiv, vol. abs/1802.06430, 2018.
[34] L. Bottou, “Stochastic gradient learning in neural networks”,
[35] M. D. Hoffman, D. M. Blei, C. Wang, and J. Paisley, “Stochastic variational inference”, Journal of Machine Learning Research, vol. 14, no. 4, pp. 1303–1347, 2013. [Online]. Available: http://jmlr.org/papers/v14/hoffman13a.html (visited on 01/04/2021).
[36] M. Jordan, Z. Ghahramani, T. Jaakkola, and L. Saul, “An introduction to variational methods for graphical models”, Machine Learning, vol. 37, pp. 183–233, Jan. 1999. doi: 10.1023/A: 1007665907178.
[38] B. Lakshminarayanan, A. Pritzel, and C. Blundell, “Simple and scalable predictive uncer-tainty estimation using deep ensembles”, in Advances in Neural Information Processing Sys-tems 30, I. Guyon, U. V. Luxburg, S. Bengio, H. Wallach, R. Fergus, S. Vishwanathan, and R. Garnett, Eds., Curran Associates, Inc., 2017, pp. 6402–6413. [Online]. Available: http: / / papers . nips . cc / paper / 7219 simple and scalable predictive uncertainty -estimation-using-deep-ensembles.pdf (visited on 09/24/2020).
[39] Y. Ovadia, E. Fertig, J. Ren, Z. Nado, D. Sculley, S. Nowozin, J. V. Dillon, B. Lakshmi-narayanan, and J. Snoek, “Can you trust your model’s uncertainty? evaluating predictive uncertainty under dataset shift”, in NeurIPS, 2019.
[40] J. van Amersfoort, L. Smith, Y. W. Teh, and Y. Gal, “Uncertainty estimation using a single deep deterministic neural network”, 2020.
[41] N. Tagasovska and D. Lopez-Paz, “Frequentist uncertainty estimates for deep learning”, ArXiv, vol. abs/1811.00908, 2018.
[42] S. Glen. (). Conditional distribution: Definition and examples, [Online]. Available: https: //www.statisticshowto.com/conditional-distribution/ (visited on 10/13/2020). [43] T. Pearce, M. Zaki, A. Brintrup, and A. Neely, High-quality prediction intervals for deep
learning: A distribution-free, ensembled approach, 2018. arXiv: 1802.07167 [stat.ML]. [44] Y. Gal and Z. Ghahramani, Dropout as a bayesian approximation: Representing model
un-certainty in deep learning, 2016. arXiv: 1506.02142 [stat.ML].
[45] M. O’Brien, W. Goble, G. Hager, and J. Bukowski, Dependable neural networks for safety critical tasks, 2019. arXiv: 1912.09902 [cs.LG].
[46] C. Cheng, G. Nührenberg, C. Huang, H. Ruess, and H. Yasuoka, “Towards dependability metrics for neural networks”, CoRR, vol. abs/1806.02338, 2018. arXiv: 1806.02338. [Online]. Available: http://arxiv.org/abs/1806.02338 (visited on 12/22/2020).
[47] (). National institute of standards and technology, [Online]. Available: https://www.nist. gov/ (visited on 11/20/2020).
[48] P. Chopra, “Making your neural network say “i don’t know” — bayesian nns using pyro and pytorch”, Towards data science, 2018. [Online]. Available: https://towardsdatascience. com/making-your-neural-network-say-i-dont-know-bayesian-nns-using-pyro-and-pytorch-b1c24e6ab8cd (visited on 12/22/2020).
[49] Folkhälsomyndigheten. (). Covid-19, [Online]. Available: https://www.folkhalsomyndigheten. se/smittskydd-beredskap/utbrott/aktuella-utbrott/covid-19/ (visited on 11/26/2020).
A
Prediction plot of a correct prediction
Figure 9: Correct prediction of digit 3 with very high probability.
Figure 9 shows the prediction plot of input 3, which is correctly predicted with high probability as the yellow colored staple in the histogram of classification 3 is very high with almost no uncertainty. Uncertainty exists for the other classifications, and the probability is low.
B
Prediction plot of an incorrect prediction
Figure 10: Incorrect prediction of digit 7 with high probability on the digit 9.
Incorrect prediction of the real input 7, the probability for classification 9 is higher than the probability for classification 7 due to higher uncertainty for classification 7, which results in an incorrect output.
C
Correct digit prediction with undecided output
Figure 11: Skipped correct prediction of digit 8 due to too low probability.
High uncertainty exists for all classifications in Figure 11 due to the probability threshold set to 60 %, which results in a skipped prediction. If the probability threshold were lower, classification 8, which has the highest probability of the classifications, would be predicted and would result in a correct prediction.
D
Incorrect digit prediction with undecided output
Figure 12: Skipped incorrect prediction of digit 8 due to too low probability with the correct digit 0 having even lower probability.
No prediction is made due to the probability being too low for all classifications in Figure 12. If the probability threshold were lower, classification 8 would be predicted, resulting in an incorrect prediction because the correct classification 0 has lower probability and more uncertainty.
E
Random data with undecided output
Figure 13: Skipped prediction on randomly generated data because of too low probability.
Randomly generated data as an input results in no prediction being made due to the low probability and high uncertainty for all classifications.
F
Out of distribution data with undecided output
Figure 14: Skipped prediction on out of distribution data because of too low probability.
An out of distribution test from the not-MNIST dataset results in low probability and high uncer-tainty and no predictions being made.