TOWARDS A COGNITIVE ASSESSMENT OF SENIOR DRIVERS'
FITNESS TO DRIVE
Michael Hull
Pan Pacific Research Pty Ltd
780 Station Street, Box Hill North, Victoria 3129, Australia E-mail: mhull@panpacificresearch.net
ABSTRACT
The increasing mean age of populations of developed and developing countries, combined with the increasing numbers of drivers entering the older age groups does not allow future elevated crash numbers to be ignored. In many regions, older drivers are required to undertake tests of vision and to provide medical certification of their continued capacity to drive. The literature suggests that such tests are expensive and have little capacity to identify those at higher risk and therefore unjustifiably discriminate against older drivers.
Both to contain expense in ageing societies and to minimise disruption to those still capable of driving safely, a reliable screening tool is required. Such a tool should be capable of administration by sub-professional personnel; it should be quick to complete and require a minimum of instructions and supervision. Thus far, the most promising such test is the Useful Field of View Test, widely reported on by Ball, Owsley and others. But lay people and judicial tribunals may fail to perceive the relevance of such a test to the driving task.
An alternative approach may derive from an adaptation of the Hazard Perception Test, variations of which are currently used in several Australian States to assess novice drivers. This approach uses computer-generated video scenes of traffic situations and requires of subjects a simple binary response. This paper summarises an evaluation such a test on older drivers, with a control group and an experimental group referred for occupational therapist assessment because of official doubts about their ability to drive safely. Analysis demonstrates that the test discriminates between older drivers in these groups. Further development may well provide an acceptable and efficient tool for identifying older drivers whose driving should be curtailed.
1 INTRODUCTION
1.1 The Ageing Driver Issue
In developed economies the ability to travel by car is highly prized as an indicator of economic and social independence (Cobb & Coughlin, 1998; Rosen bloom, 1995; OECD, 2001).
Moreover, in developed and developing societies, both the proportion of those with access to a motor vehicle and the absolute number of motor vehicles continue to grow (Cobb & Coughlin, 1998). The largest growth is occurring in those countries that are starting from a relatively low car-ownership base that are experiencing a significant rises in the proportion of the population having discretionary income. This is shown in Figure 1.
These changes in availability of discretionary income and passenger vehicle ownership are occurring along with the ageing of populations. It is not anticipated that this ageing process will
Figure 1: Countries with the largest Increase of Cars in Circulation (2008 – 2010)
Figure 2: Median Age of Population of Selected Countries 1950 – 2100
It follows from an increasing proportion of elderly in our populations that a greater proportion of those of working age will be required to service the needs of the elderly. Clearly this will have economic consequences. These economic consequences will increasingly fall on various levels of government as adult children of the elderly have smaller families, and transmigrate to centres of greater economic opportunity.
There are indirect costs to unnecessary reduction in the independent mobility of older people, including becoming more homebound and suffering from isolation and depression and consequently being admitted to long-term care facilities (Classen et al, 2007).
Adapted from: United Nations Department of Economic & Social
It is therefore in the economic interest of governments and society to encourage the elderly to live independently without outside assistance for as long as possible
Not only is there an economic rationale for reconsidering driver licensing arrangements for older citizens, but there is also a political reality associated with their increasing proportion in the total population. Their better levels of education, their improving economic significance and their increasing proportion in populations all combine to bring about a situation where older people will bring significant political and social pressure to bear in order to maintain their mobility into old age (VicRoads, 2000). Older people in the 21st century will expect rational programs to be in place that meet their needs and the needs of the broader community.
It is, of course, necessary that any test of the ability to drive safely be capable of predicting undesirable consequences of continued driving by those who fail it. But, whilst this criterion is necessary, it is not sufficient. Such a test must be defensible to lay people both politically and in the Courts, since it is these institutions that mediate disputes between driver licence administrations and individual drivers. The content of the test should demonstrably relate to the driving task.
1.2 Older Drivers as Heterogeneous Group
As individuals become older, they are more likely to experience degradation of vision, memory, muscular strength and so on. However, these normal ageing effects do not correlate well with chronological age. Also in the process of ageing, individuals are more likely to develop diseases, some of which affect the capacity to drive safely. Moreover, medications used to treat medical conditions may also have side-effects that may affect safe driving. But substantial research has failed to indicate strong correlations between crash risk and medical conditions generally (Charlton et al, 2004; Marattoli et al, 1997).
Health professional assessments appear not to provide a reliable means of detecting unsafe older drivers. Alone, amongst the Australian States and Territories, Victoria does not prescribe assessments of drivers based on their age, relying instead on community reporting of unsafe drivers (regardless of age). Older driver crash rates in Victoria have been compared with other States and Territories and, on each occasion, older crash rates in Victoria have not exceeded, and frequently been less than, older driver crash rates in other States and Territories (Torpey, 1986; Langford et al, 2004)
2 VISUAL TESTING OF OLDER DRIVERS
Most frequently the licensing authorities deal with cases where the effect of a diagnosed condition on driving is not easy to determine or cases where driving appears impaired and no reliable medical cause can be established. Early cases of Alzheimer’s disease fall into this category. Dina LoGiudice (1997) of the National Ageing Research Institute in Melbourne, Australia reports that the average time between appearance of first symptoms and a confirmed diagnosis of Alzheimer’s is 5 years.
Currently, there is little hard evidence to demonstrate a reliable relationship between safe driving and the broad range of medical diagnoses. It is hardly surprising that the medical model is under increasing attack in the courts by those who seek to drive and have been excluded from doing so by driver licensing authorities.
Older people are more likely to suffer from a range of deficits than are younger adults. Physiological defects have long been suspected of contributing to crashes amongst older drivers.
Of those physiological deficits, the most likely to be directly connected with unsafe driving are those related to vision.
Of visual defects, High Contrast Static Visual Acuity (HCSVA) is known to directly affect the capacity to see clearly. HCSVA is tested by means of determining the smallest object that a subject can reliably see. A typical test instrument is the well-known Snellen chart, on which letters of different sizes are presented in black on an illuminated white background. The test effectively determines the smallest angle that can be resolved by a subject positioned a set distance from the chart.
A somewhat less common test is the test for Low Contrast Static Visual Acuity (LCSVA). A similar chart is used, but the background against which letters are displayed is grey, rather than white. The importance of this test arises from the fact that the front of the eye becomes less transparent with advancing age and, as a consequence, a higher intensity of light is required to perceive objects clearly. In the driving task, poor performance on the LCSVA test would be indicative of a likely difficulty in seeing objects clearly at night.
A more complex test of vision is the test of Dynamic Visual Acuity (DVA). In this test, letters of similar size to those used in the HCSVA test are presented to the subject, whilst moving across a screen at a set speed. The test is less frequently used because of the equipment (preferably a computer) used to present it. The DVA test clearly tests more than the capacity to observe and identify a letter, since it requires that the letter be “tracked” for a sufficient time to be able to identify it. Thus DVA tests HCSVA and, in addition, occulo-motor function and, the central capacity to coordinate both functions.
A still more complex test is one reported in the optometric literature over the past few decades is the Useful Field of View Test (UFOV) (Ball & Owsley, 1991). The UFOV test requires subjects to respond to a stimulus shown in the centre of a screen (upon which the subject is supposed to concentrate). At indeterminate intervals, a secondary stimulus is displayed at random points on the periphery of the screen. Clearly, with two independent events to be monitored and responded to by the subject, UFOV tests the ability to perform two tasks more or less simultaneously. Thus, more so than the DVA test, UFOV imposes a substantial cognitive load on the subject in the monitoring of two events and reporting what is displayed on screen.
Perception may be defined as the neural processing of visual input (Hull, 1991). The distinction can be made clearer with an example. If a driver is concentrating attention on a pedestrian who may or may not step out in front of his moving car, then he or she has less time available for detecting other emergent hazards and general awareness of these secondary targets may be reduced (Hills, 1980). There is a substantial literature on the effects on behaviour of cognitive processes like selective attention and divided attention tasks and a summary of these, as they affect the driving task can be found in Hull (1988).
There also exists laboratory evidence that perceptual factors are strongly implicated in task performance (Goodenough, 1976, Kahneman & Ben-Ishai, 1973; Parasuraman & Nestor, 1993; Zeitlin, 1995). Sabey and Straughton (1975) in an “on-the-spot” study of 2,036 British crashes with later interviews of drivers concluded that 44% of at-fault car drivers were judged to have made perceptual errors.
Until relatively recently, though, it has not been possible to produce experimental situations in which the tasks to be performed by subjects sufficiently replicated the real demands of driving environment. Thus, for example, Zeitlin’s (1995) work involved drivers, whilst actually driving, in tasks such as random number generation and delayed digit recall.
An example of the use of computer power in assessing perceptual ability have been the work of Owsley et al (1991) which has relied on computer generated images to simultaneously present separate images on a computer screen as part of the Useful Field of View Test. A further example is Victoria’s Hazard Perception Test, which again relies on computer power in presenting video images of traffic situations on screen and capturing the subject’s response for comparison with ideal responses (Hull, 1991)
Owsley et al (1991) report in their study that the measures of visual attention and mental status accounted for 20% of the variance, thus providing a much stronger model than earlier visual impairment (non-cognitive) models.
Hull and Christie (1993) report a statistically significant capacity of the Hazard Perception Test to discriminate between subjects on the basis of retrospective crash involvement, regardless of age.
On the basis of this evidence, it is hypothesised that tests of cognitive capacity should provide better predictors of driving safety than tests of visual acuity.
Parasuraman and Nestor (1993) suggest that there is good evidence that a skill test that predicts crash involvement in older drivers should incorporate attentional measures, in particular tests of attentional shifting based on dichotic listening and related tests. They indicate that additional work is needed to refine attention tests for ease of use in the clinical setting and conclude that such measures may allow for better predictive capability when combined with measures of other skills involved in driving.
Sivak (1995) reports major findings on age-related changes in anatomy, vision, perception and attention, and on the relation between these changes and driving performance and accidents. He stresses the need for research on the vision, perception and attention of older drivers, particularly the understanding of stimulus-response combinations that lead to formations of automatic associations in the elderly, and the role of attentional demand on motor coordination and the usefulness of non-information channels for improving driving performance.
Goode et al (1998) examined the utility of a set of commonly used neuropsychological and cognitive tests in comparison to a newer measure of visual attention (Useful Field of View) in predicting state-recorded, at-fault crashes over the previous 5 yrs in a group of older adult drivers. 239 participants (mean age 70.36 yrs) completed tests of mental status, visual attention, memory, and UFOV(R). Results showed that among all cognitive tests administered, UFOV(R) was most strongly related to crash involvement, with high levels of sensitivity (86.3%) and specificity (84.3%) at the standard cut-off score of 40% reduction.
Hull, Howard, Leung & Cairney (1998) have argued that, of the physical conditions which might affect driving by older people, the one which is best documented is visual defect. They produce evidence, based on a sample of 100 older drivers, that the correlation between traffic infringements and score on a series of visual tests grows stronger as successive visual tests require of the subject increasing amounts of cognitive processing.
Ball and Owsley (1991) have examined data on the performance of 300 subjects on a variety of visual tests. Their conclusion suggested that older drivers with diagnosed physical disorders appear to adjust their driving so as to avoid more challenging driving environments, such as inclement weather and night-time driving. They also scored their subjects on the Mattis Organic Mental Status Syndrome Examination (MOMSSE), a test designed specifically to assess the cognitive status of the elderly. Those scoring poorly on the MOMSSE test demonstrated lower levels of avoidance of challenging tasks. This led the researchers to suggest that such drivers fail to restrict their driving because they fail to recognise that they have impairments.
These studies suggest that it may be that fitness to drive amongst impaired elderly drivers is not so much determined by the existence of a diagnosable “medical” condition as it is by cognitive impairment which may be associated with some medical condition. In some subjects, the cognitive impairment may be entirely independent of a medical condition or perhaps temporarily or permanently related to a medical condition that has been diagnosed, is sub-clinical or is undiagnosed or has been misdiagnosed. Such an hypothesis would explain the inability of medical diagnosis models of fitness to drive to predict future road safety performance.
Regardless of intellectual reservations that may remain regarding the aetiology (or aetiologies) of a less effective capacity to perceive and process information relating to potential hazards, the evidence strongly suggests that a perceptual approach has potential to discriminate between crash involved and others.
3 A HAZARD PERCEPTION APPROACH
3.1 Background
The hazard perception approach need make no assumptions about intervening factors, such as pathology. The concern of the driver licensing authorities is with the ability to deal safely with situations occurring on the road. One need only to ensure that the appropriate “inputs” are presented to a subject and that desirable “outputs” are elicited in a timely manner.
Firstly, the approach offers the possibility of a short-term solution to the real-world problem of escalating proportions of older drivers of unknown abilities using our roads. Secondly, it offers the possibility of identifying those behaviours of older drivers that are most likely to result in undesirable outcomes and are, therefore, most in need of in-depth evaluation.
A template for such an approach exists, with underlying rationale summarised in Hull (1988). As part of the subsequent development of a Hazard Perception Test for novice drivers, a trial was conducted on over 3,000 individuals, representing all ages, ethnicities, education standards and both sexes in Geelong, a provincial city in Victoria, Australia (Hull & Christie, 1993). Subjects were asked to provide information on their crash involvement over the preceding five-year period. The results of the trial are shown in Figure 3. The graph indicates a consistent variation in Hazard Perception Test score based on both age and crash involvement history. The predictive capacity of the test, in respect of novice drivers, was later independently confirmed, with reservations, in a study of 99,000 novice drivers by Congdon (1999), which led to a further revision of the test.
Figure3: Hazard Perception Test Score by Age Group and Crash Involvement
The results of the study in respect of older people are perhaps a little surprising, given that the test items were designed with the common crash aetiologies of novice drivers as their reference.
At the time of the development of the Hazard Perception Test, the extent of the contribution of brain development to the appreciation of Hazards was largely unknown. A useful account of these more recent understandings can be found in Vlakveld (2011). .
As indicated in Figure 3, there is a decline with age in the scores obtained on the Hazard Perception Test. What remains unclear is the mechanism for this change. On the one hand it may be caused by an age-related decrease in the ability to perceive and react rapidly to visual stimuli presented non-foveally, as suggested by the work of Hartley (1991), even in those apparently without pathology. On the other hand, it is possible that the declining score can be explained in terms of an over-reliance on sensory data that is automatically processed and inadequate conscious attention given to relatively rare emergent events requiring conscious processing. This possibility appears not to have been rigorously addressed in the literature and the research may be reporting an effect rather than its cause.
The Hazard Perception Test was essentially designed for use to assess novice drivers. For the proposed application of the test to older drivers, test items were selected from the broader item pool that were related to the crash aetiologies of older drivers using the “definitions classifying accidents” that are applied to all crashes entered into the Mass Crash Database maintained in the State of Victoria.
3.2 Applying the Test
Instructions and an example question were displayed on screen and were also presented audibly. The instruction component was repeated, as required by the subject.
The subject, when ready, commenced the test him or herself.
Test items were selected randomly from 10 different groups of scenarios. The number of items selected from each group was limited programmatically. Each question was preceded by an audible and textual “scene setter” and was accompanied by a still photograph representing traffic positions at the beginning of the moving image component. In each case the subject was asked to press a button when he or she perceived a cause to change direction or speed.
Each item concluded by advising the subject that the program had registered his or her action. The next test item immediately followed.
-0.5 -0.4 -0.3 -0.2 -0.1 0 0.1 0.2 18-20 21-25 26-30 31-60 61+ Age Group H PT Sc o re
The computer program administering the test recorded subject details, the identification and order in which items were presented and the subject’s response to each. The program also maintained a record of the number of times each item was presented and the responses of subjects, so as to adjust the facility of each question in an ongoing manner, thus providing a continually adjusted weighting for item scores.
3.3 The Study and Results
Subjects representing two groups were evaluated using the test:
Control group: Drivers of 55 years and over whose driving capability had not been questioned. Experimental group: Drivers of 55 years and over, matched for age and gender, who have been referred for Occupational Therapy Driving Assessment either by driver licensing authority or by their treating physician.
3.4 Rationale for Group Selection
The definition of the experimental group is critical. In Victoria, Occupational Therapists with postgraduate qualifications in driving assessment are identified in legislation as those with responsibility for testing and assessing those whose driving is possibly impaired. Occupational Therapists are typically involved where there is reason to believe a problem with driving exists despite the lack of a medical diagnosis. They are also involved where a patient disputes a recommendation not to drive based on medical considerations alone.
These two groups were chosen because they are representative of the distinction that is required to be drawn in standard policies and procedures for licence withdrawal or restriction. A demonstration that the test has the capacity to discriminate between these groups would indicate the usefulness of the test in the administration of driver licence policy by reducing costs of professional services and streamlining an initial assessment phase of the administrative process with significant cost and time savings.
3.5 Source, Numbers and Characteristics of Subjects
Control group subjects were sourced though groups in Victoria, Australia operated by the Hawthorn Community Education Project Incorporated (HCEP). Subjects came from University of the Third Age courses run by HCEP and from Wiser Driver seminars operated by HCEP at Hawthorn and in Werribee. Subjects were volunteers.
Experimental Group subjects were persons attending for assessment of driving by an occupational therapist in a facility operated by Southern Health Network in south-eastern Melbourne. Subjects were tested after they had completed driver evaluation procedures scheduled for that day by the occupational therapist. Assessments were carried out in a room set aside for that purpose at Kingston Aged Care and Rehabilitation Centre in Cheltenham and Dandenong Community Hospital’s Rehabilitation Unit in the East of Melbourne, Australia.
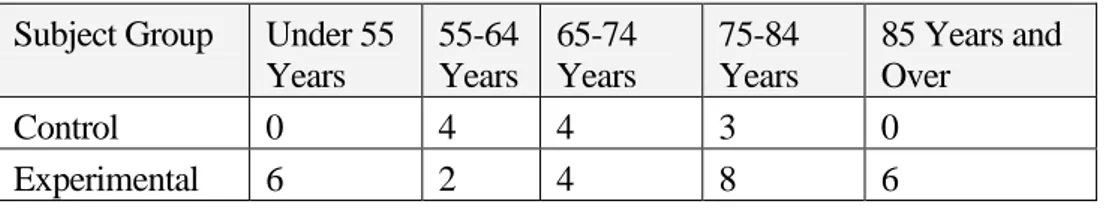
Characteristics of members of control and experimental groups are summarised in the following tables.
Table 1:Age Characteristics of Members of Subject Groups Subject Group Under 55
Years 55-64 Years 65-74 Years 75-84 Years 85 Years and Over Control 0 4 4 3 0 Experimental 6 2 4 8 6
Table 2: Gender Characteristics of Subjects
Subject Group Female Male
Control 6 5
Experimental 6 26
3.6 Ethical Considerations
Prior to being tested, each subject was given a written description of the research project and a consent form. The information contained in both documents was explained orally. Signed consent forms were obtained from subjects prior to testing. Subjects were given copies of both documents to take away with them. A copy of each document is attached as Appendix 1.
No untoward events were observed during testing, nor were any undesirable side effects reported subsequently. Subjects were given the opportunity to familiarise themselves with the requirements of the test through a practice question repeated as often as they required.
3.7 Analysis of Data
Since a number of the test items are similar an algorithm was developed to ensure that similar items were not presented to the one subject. Given the relatively small item pool, the effect of this restriction was to exclude some items from being presented in any of the tests conducted in this phase of the research.
Table3: Frequency of Presentation of Test Items
Item No 1 2 3 4 5 6 7 8 9 10 11 12 13 14 15 16 17 18 Control 5 8 6 11 3 8 11 1 9 2 Experimental 2 17 30 32 9 14 18 11 32 3 1 4 20 Item no 19 20 21 22 23 24 25 26 27 28 29 30 31 32 33 34 35 36 37 Control 9 2 3 6 8 8 3 3 8 11 3 2 Experimental 24 9 1 4 16 2 18 8 1 11 10 14 21 11 32
All available results were entered into an analysis against self-reported crash involvement. Results are summarised in Table 4, below.
Table 4: Score on all Test Items by Self-reported Crash Involvement Cras h Total Score 3 4 5 6 7 8 9 10 11 No 0 2 2 6 0 5 4 2 2 Yes 2 1 2 0 0 0 0 0 0
These data were subjected to an analysis of variance that provided the following results: Table 5: Analysis of Variance Total Score on Test and Crash Involvement
Source of Variation Sum of Squares DF Mean Square F Significance
Main Effect of Total Score 2.440 7 0.349 4.184 0.005
Explained 2.440 7 .349 4.184 0.005
Residual 1.667 20 0.083
Total 4.107 27 0.152
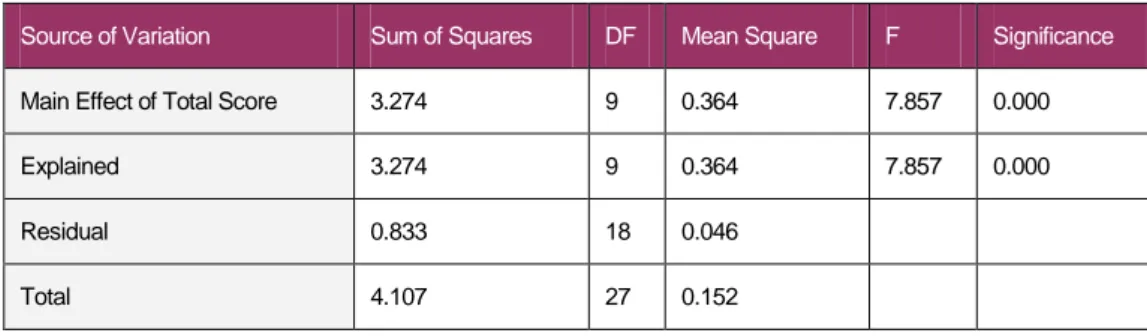
Further analysis suggested that the most discriminating test items appeared to be items 4, 11, 12, 14, 17, 18, 19, 24, 26, 27, 29, 30, 31, 32, 33 and 35. A total score, representing performance on these items only was then calculated and tabulated against self-reported crash involvement with the following results.
Table 6: Score on More Discriminating Test Items by Self-reported Crash Involvement
These selected data were again subjected to an Analysis of Variance with the results shown in Table 7.
Table 7: Analysis of Variance Score on Selected Test items and Crash Involvement Source of Variation Sum of Squares DF Mean Square F Significance Main Effect of Total Score 3.274 9 0.364 7.857 0.000
Explained 3.274 9 0.364 7.857 0.000
Residual 0.833 18 0.046
Total 4.107 27 0.152
Crash Total Score on Discriminating Items 1 2 3 4 5 6 7 8 9 10 No 0 0 5 3 5 2 1 3 2 2 Yes 1 1 1 0 0 0 0 0 0 0
4 DISCUSSION
The analysis provides support for the reported difficulties older drivers appear to experience in right turn against traffic situations, with emerging traffic and pedestrians, and in anticipating less commonly encountered hazards. This is consistent with observations reported elsewhere (Morris, 1998, for example). The types of traffic situations evaluated are shown in Table 8. The reader should bear in mind that, in Australia, vehicles drive on the left side. Consequently a right turn is a turn against oncoming traffic, equivalent to a left turn in Europe and China.
Table 8: Summary of Content of More Discriminating Test Items
Item No. Brief description Critical Element 4 Traffic entering roundabout ahead from right Fails to observe 11 Right bend with poor sight line Fails to anticipate
12 Tram slowing ahead Fails to detect speed change 14 Truck merging onto freeway Fails to anticipate
17 Motorcycle straight thru. Subject doing right turn Fails to anticipate 18 Obscured motorcycle straight thru. S doing right turn Fails to anticipate 19 Motorcycle ahead on approach to roundabout Fails to anticipate 24 Truck ahead approaching “form one lane” sign on bridge Fails to anticipate 26 Car turning right ahead Fails to anticipate 27 Car turning left ahead Fails to anticipate 29 Car ahead turning right Fails to anticipate 30 Emerging pedestrians at signalised crossing Fails to observe 31 Emerging pedestrians at signalised crossing Fails to observe 32 Motorcycle straight though yellow light. S turning right Fails to anticipate 33 Tram slowing ahead and double parked cars Fails to anticipate
35 Left at residential street onto collector road Judging speed and distance
The findings indicate that the means for crash-involved subjects are significantly lower than the means for subjects who have not been crash involved. However the number of cases is insufficient to perform a rigorous reliability analysis. Such an analysis is desirable prior to consideration of future possible implementation.
Moreover, in an ethnically diverse community, in which post-war immigrants are now entering retirement, it would be desirable to ensure that those whose first language is not English are not unreasonably disadvantaged by the test. The ethnic mix of the current sample is inadequate for this purpose.
On the basis of this study, it would appear reasonable to further develop tests of perceptual ability that tap precisely those perceptual skills required by older people for the driving task. Further research should actively consider the use of video footage, which is expected to have greater face validity. One argument favouring a test with high face validity is found in the work of MacGregor et al (2001) who evaluated 60 crash-involved and 60 control drivers matched for age and gender. Both groups undertook the Folstein Mini-Mental State Examination (MMSE), a commonly used instrument to evaluate cognitive functioning, as well as a traffic sign recognition test designed for the study. They found that the traffic sign recognition test significantly distinguished between case and control groups whilst the MMSE did not. Furthermore the traffic sign recognition test predicted crash involvement in a multivariate analysis controlling for education, MMSE score, ethnicity, and mileage driven per year. They concluded that a traffic sign
recognition test successfully identified older drivers who had recently been involved in a crash lacks sensitivity and specificity.
4.1 Implications of the Study
The study reported here, in general terms supports the research of Horswill et al (2010). The current study, although having fewer subjects, had a more robust measure of crash potential – whilst Horswill used self-reported crash data; the current study used, for its experimental group, subjects who had been medically identified as being at risk and subject to ongoing medical evaluation at the time of their participation.
Together, the current study and the Horswill (2010) study suggest that there exists a strong potential for developing a crash-predictive test for drivers whose safe driving capacity may be impaired.
The development of such a test has the potential to limit challenges to the decision to suspend, cancel or vary the driving licence of impaired individuals because of its self-evident face-validity.
Of equal importance however, is the potential for such a test to identify potentially unsafe drivers who may have undiagnosed health conditions or a plurality of minor (and possibly undiagnosed) health conditions which, only in aggregate, render driving potentially unsafe.
The results indicate provide a reasonable basis for a research and development program to devise a hazard perception test specifically designed for older drivers. Such a test would greatly assist in the safe management of ageing driving populations.
REFERENCES
Anstey, K, Wood, J, Horswill, M & Hatherly, C (2009), Recent developments in developing screening tools for older drivers, Paper presented to the Australasian Road Safety
Research, Policing and Education Conference, Sydney, NSW, Australia.
Ball, K & Owsley, C (1991), “Identifying Correlates of Accident Involvement for the Older Driver”, Human Factors 33:5, 583
Charlton, J, Koppel, S, O’Hare, M, Andrea, D, Smith, G, Khodr, B, Langford, J, Odell, M & Fildes, B (2004), Influence of Chronic Illness on Crash Involvement of Motor Vehicle Drivers, Report No 213, Accident Research Centre, Monash University, Clayton, Victoria. Classen, S, Lopez, E, Winter, S Awadzi,K, Ferree, N & Garvan, C (2007), “Population-based
health promotion perspective for older driver safety: Conceptual framework to intervention plan,” Clin Interv Aging, December; 2(4): 677–693
Cobb, R W & Coughlin, J F. (1998), “Are Elderly Drivers a Road Hazard? Problem Definition and Political Impact”, J Ageing Studies 12:4, pp 41-427
Congdon P (1999), VicRoads Hazard perception test, Can it Predict Accidents? Australian Council for Educational Research, VicRoads Report CR99-1, Kew, Victoria, Australia Dadush, U & Shimelse, A, (2012) In Search of the Global Middle Class: A New Index,
Carnegie Paper, Carnegie Endowment for International Peace, Washington DC, USA
Goodenough, D. (1976), “A Review of Individual Differences in Field Dependence as a Factor in Auto Safety”, Human Factors 18:1, 53-62
Goode, K, Ball, K, Sloane, M, Roenker, D, Roth, D, Myers, R, (1998), “Useful field of view and other neurocognitive indicators of crash risk in older adults”, Journal of Clinical Psychology in Medical Settings, 5(4), 425.
Hartley, A &.McKenzie, C.(1991), “Attentional and perceptual contributions to the identification of extrafoveal stimuli: Adult age comparisons”, Journals of Gerontology, 46:5, 202
Hills, B. (1980), “Vision, Visibility and Perception in Driving”, Perception, 9, pp 183 216.
Horswill, Mark, Anstey, Kaarin J., Hatherly, Christopher, & Wood, Joanne M. (2010), “The crash involvement of older drivers is associated with their hazard perception latencies”,
Journal of the International Neuropsychological Society, 16(5), pp. 1‐6.
Hull, MA (1988), Hazard Perception – A Literature Review, VicRoads Report GR 88/12, VicRoads, Kew, Victoria, Australia.
Hull, MA (1991) Mandatory Hazard Perception Testing as a Means of Reducing Crashes amongst Novice Drivers, Paper Presented to the Strategic Highway Research Program & Traffic Safety on Two Continents Conference, Gottenberg, Sweden
Hull, MA & Christie, RJ, (1993), Hazard Perception: the Geelong Trial & Future Development, VicRoads Report GR 93/13, VicRoads, Kew, Victoria, Australia.
Hull, MA (1998) Hazard Perception Testing for Cognitive Impairment, Paper presented to 24th International Congress of Applied Psychology, San Francisco, USA
Hull, MA, Howard, S, Leung, Y & Cairney, P (1998), “Technological Assistance for Older Driver Testing”, Proceedings of the Road Safety Research, Policing & Education Conference, Wellington New Zealand
Kahneman, D. & Ben-Ishai, R (1973), “The Relationship of a Test of Attention to Road Accidents”, Journal of Applied Psychology, 38:1, 113-115
Kharas, H (2010), The Emerging Middle Class in Developing Countries, OECD Development Centre Working Paper No. 285, OECD, Paris.
Langford, J, Fitzharris,M, Koppel, S & Newstead, S (2004), “Effectiveness of mandatory licence testing for older drivers in reducing crash risk among older Australian drivers”, Traffic Injury Prevention, 5, 26-36.
Lo Giudice, D (1997), Assessment of Services for Elderly People with Dementia, PhD Thesis, Department of Medicine, University of Melbourne, Australia
Marattoli, R, de Leon, C, Glass, T, Williams, C, & Cooney, L. (1997). “abd ME Tinetti, IB: Driving ceasation and increased depressive symptoms: Prospective evidence from the New Haven EPESE. established populations for epidemiologic studies of the elderly”, Journal of the American Geriatric Society, 45, 202-6.
OECD (2001), Ageing and Transport: Mobility Needs and Safety Issues, OECD, Paris
Owsley, C, Ball, K, Sloane, M, Roenker, D. & Bruni, J. (1991). “Visual/cognitive correlates of vehicle accidents in older drivers”, Psychology and Aging, 6(3), 403-415.
Parasuraman, R & Nestor, P. (1993), “Attention & Driving: Assessment in Elderly Individuals with Dementia”, Clinics in Geriatric Medicine, 9:2, 377-387
Rosenbloom, S (1995), Travel by the Elderly: Nationwide Personal Transportation Survey: Demographic Special Reports, US Department of Transportation, Washington
Sabey, B. & Straughton, G. (1975), “Interacting Roles of Road Environment, Vehicle and Road User in Accidents”, 5th International Conference of the International Association for Accident and Traffic Medicine, London.
Sivak, Michael (1995) “Vision, perception and attention of older drivers”, UMTRI Review, Vol 26
Torpey, S (1986), Licence Retesting of Older Drivers, Road Traffic Authority Report 2/86, VicRoads, Kew, Victoria, Australia
United Nations Dept of Economic & Social Affairs (2010), World Population Prospects, accessed 29 September 2012, http://esa.un.org/wpp/JS-Charts/aging-median-age_0.htm
VicRoads (2000), “Older Drivers: Local Government Road Safety Information”, Saferoads, VicRoads, Kew, Victoria, Australia
Vlakveld, W (2011), Hazard anticipation of young novice drivers: Assessing and enhancing the capabilities of young novice drivers to anticipate latent hazards in road and traffic situations, Dissertation for Doctorate in Medical Sciences, State University of Groningen, SWOV-dissertation series, Leidschendam, Netherlands
World Health Organisation (2010) Road Safety in Ten Countries: China, accessed 29 September 2010,
http://www.who.int/violence_injury_prevention/road_traffic/countrywork/chn/en/index.ht ml
Zeitlin, R (1995), “Estimates of Driver Mental Workload: A Long-term Field Trial of Two Subsidiary Tasks”, Human Factors 37:3, 611-621