December 2010
A Comparison of Unit Price and Fixed Price Contracts for
Infrastructure Construction Projects
Svante Mandella and Jan-Eric Nilssonb
Abstract: Today’s dominant mechanism for infrastructure project tendering is the Unit Price Contract (UPC). While the winning bidder retains risk related to the unit price bids submitted, the Principal carries all risk related to misspecification of the activities required for having a project build. This paper reviews the microeconomic foundations for this contracting
procedure and identifies situations where an alternative mechanism, Design – Build (DB) contracts, may be preferable. DB leaves the bulk of project risk with the agent and therefore requires bidders to hedge against unpleasant surprises in the implementation by increasing the demand for compensation for undertaking the job. It is argued that DB should not be used if the number of bidders is expected to be large; this is a means for reducing the duplication of design costs. Moreover, DB projects should be complex with respect to the number of sub-tasks required for construction and it should be feasible to substitute one input for another. This is a way for society to benefit from the agent’s superior information about alternative implementation techniques and relative input prices. The projects should moreover not include too many unobservable quality features and the risks for geotechnical problems should be manageable.
Key words; Procurement, Unit Price Contracts, Design build, Infrastructure JEL codes; H57, R42, R48, L98
a
vti, Swedish National Road and Transport Research Institute, and CTS Stockholm, svante.mandell@vti.se
b
1. Introduction
Construction of Sweden’s infrastructure projects is tendered on a competitive basis using a Unit Price Contract (UPC), by engineers often referred to as Design-Bid-Build. One basic feature of UPC is that the principal – a government agency – has prepared drawings and a detailed description of which tasks that are to be performed and in which quantities to execute the project. Bids thus comprise a vector of prices, one for each task and the winner is the bidder who has submitted the lowest bid in terms of the vector product of prices and quantities. Subsequent payments are made against realised quantities.
An alternative type of contract is referred to as Design-Build (DB). In this case, the bidding contest is initiated by the principal describing the project in overall terms – a road between Here and There with certain width and alignment features. Bids are then submitted for preparing the detailed design and to build the project as one comprehensive package. The payment under a DB contract is of a fixed price nature.
The purpose of the present paper is to discuss the benefits and drawbacks of UPC by way of a comparison with DB contracts. This is done against a background of the construction industry being a laggard in terms of productivity performance, at least in Sweden1. One possible reason may be that the UPC provides a very poor environment for trying out new ways to have infrastructure built.
The discussion will be based around a simple – naïve – model, using some restrictive
assumptions under which the benefits of DB become apparent. We will then relax some of the assumptions to show under what circumstances the UPC becomes a preferable choice. To enrich our discussion we use a unique data set, containing some 1400 road infrastructure
1
According to official data Sweden’s labor productivity grew with an average 2.6 percent per year between 1980 and 2007 for overall production. During the same period, growth in that part of the industry which comprises production subject to international competition was 4.7, while it was 0.8 percent per year in the construction sub-sector.
investments tendered in Sweden in the 2000-2009 period. This enables us to relate the contracting situation in the real world to our theoretical discussion. As a result of the review, situations where DB should be expected to have particular strengths are identified.
The paper is organized as follows. In the next section we establish a simple theoretical framework for making the comparison. Section 3 contains the naïve version of a comparison of the two approaches, while section 4 introduces complicating aspects which makes the choice between the respective contract types more intricate. Some empirical observations and how they relate to the conjectures derived in Section 3 and 4 are discussed in Section 5. Section 6 concludes.
2. A simple framework for the comparison
While a project’s purpose is to provide a set of services, e.g., the possibility to travel safely between Here and There at reasonable costs, we take interest in its design features, denoted X. This is a multi-dimensional physical characteristic of a project with respect to length, width, horizontal and vertical alignment etc., which taken together deliver the road services. A particular design is in turn implemented by using input factors (Z) in the construction process. Which input factors are used will depend on the available technology and the factors’ relative prices.
In the following, it is assumed that the road administration – henceforth referred to as the principal – has decided that a new piece of infrastructure fulfilling design features XD should
be constructed. Whether this will result in a positive present value of services over
construction is not crucial for the subsequent discussion, which rather focuses on the way in which this infrastructure investment should be tendered and contracted. In particular, which are the qualities of the two implementation techniques UPC and DB in this?
As illustrated by Figure 1, the process from deciding on an infrastructure investment to completing the construction contains several steps. After the decision to build has been made, the first is to decide what procurement approach to use. The next step involves the Design and Procurement phase. This phase contains the crucial distinction between DB and UPC. A DB contract includes both design and construction while a UPC comprises only construction as the design phase is concluded before the procurement. This step results in either a unit price
agreement (in the case of UPC) or total cost agreement (in the case of DB). In both cases there is of course also a possibility that no agreement is reached.
Given that an agreement is reached, the next step is the construction phase. If everything goes as planned, this results in a project fulfilling the requirements summarised in XD. Due to
unforeseen circumstances, it may be the case that additional measures are needed for XD to
materialize. The last step of the model involves the principal paying the agent in accordance with the agreement.
Whether the design in the UPC option is made in-house by the Principal, which was earlier the standard case in Sweden, or is tendered in a separate process, as is typically the case now, has little impact on the following discussion. Thus, to simplify, we assume that the Principal designs the project in the UPC case. The quote for bids for the construction phase of a UPC project is based on this elaborate design which includes a detailed enumeration of all activities to be implemented and also a specification of the quantity of each activity. The construction tender results in the Principal receiving a vector of bids. The agent submitting the lowest bid,
B, - i.e. the vector product of prices and quantities – wins the contest.
In contrast, the quote for a DB tender describes the design features of the project but leaves the responsibility for how the work is to be done, i.e. which inputs to use, with the agent. Thus, every bidding agent must produce at least some preliminary designs to be able to establish what bid to post. The bid and the subsequent payment are of a fixed price nature subject to successful delivery of XD.
For several reasons, some ex ante design features of the project may turn out to be
inappropriate. One example could be that the Principal may realise that an interchange which was not initially included in the design specification must be built. A complementary contract may therefore have to be negotiated and signed, i.e. an agreement which specifies an
additional piece of work and the payment for doing so. While such complementary contracts may affect actual costs substantially, they have minor impact on the comparison of UPC and DB and are therefore disregarded here; cf. Bajari et al (2007) for a further discussion. These complementary contracts should not be confused with the potential additional measures needed as discussed above. The presence of complementary contracts means that the desired output changes during the construction process, i.e., it becomes clear that some other design than XD is needed.
3. A naïve comparison
To focus our discussion, we assume that, irrespective of the choice of procurement strategy, there are only two tasks, denoted z1 and z2, involved when constructing the road. Each task
may require the use of several primary inputs. For instance, if z1 is the provision of gravel, it
may require access to rock and a stone crusher or to natural gravel, to a truck and to drivers and other staff.
As described above, the principal quantifies the input required in each task prior to the procurement stage under the UPC strategy. Denote these quantities ˆz1 and ˆz2, where the hat indicates that quantities are set by the principal. For the time being, it is assumed that implementing activities {ˆz1,ˆz2} with certainty yields the desired output XD, i.e.,
X(ˆz1,ˆz2)=XD.
This does not rule out the existence of other combinations of z1 and z2 than {ˆz1,ˆz2} that
would also result in XD. Using gravel of better quality may, for instance, make the subsequent
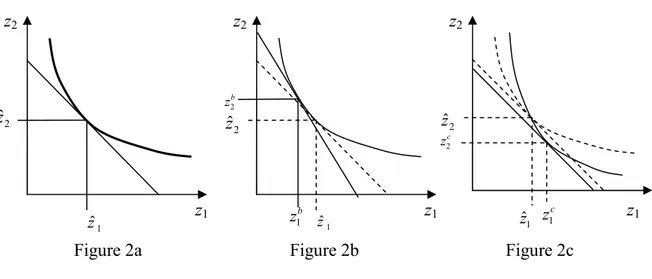
to think about production theory, the bold (convex) line in Figure 2a may be viewed as an isoquant tying together all combinations of z1 and z2 that yield a product with the XD
characteristics. The straight line is an isocost which ties together all combinations of z1 and z2
that result in the same total cost. The slope of the isocost is thus given by the relative prices of
z1 and z2.
Figure 2, Illustration of cost minimization and differences in price and technology dimension.
The principal’s specification of ˆz1 and ˆz2 in a UPC is based on a guess regarding the relative prices of z1 and z2 as well as regarding the rate of substitution between them, i.e., to what
extent the two may be substituted while retaining the desired output level. Although the principal would like to have the cost minimising specification illustrated in Figure 2a delivered, the outcome may differ for at least two reasons.
(1) The price dimension. In Figure 2b, the dotted isocost is the principal’s perception, while the solid isocost reflects the actual relative prices. It seems likely that the two differ. After all, if the principal knows the unit prices with certainty, there is little need for procurement. As Figure 2b is drawn, the tasks specified in the
contract,
{
zˆ z1,ˆ2}
, will be unnecessary costly since{
zb zb}
21, yields the same outcome
(as it lies on the XD’s ‘isoquant’) at a lower cost given the actual relative prices. It is
important to note that it is the relative prices of specific tasks that are of relevance, rather than the textbook r/w-ratio. Thus, it is difficult or impossible for a third party, e.g., the principal, to observe these prices.
z1 z2 1 ˆz 2 ˆz z1 z2 1 ˆz 2 ˆz c z2 c z1 z1 z2 1 ˆz 2 ˆz b z2 b z1
(2) The technology dimension. In Figure 2c the principal’s estimate of relative prices is correct, thus the solid and dotted isocost have the same slope. However, the principal’s perception about the technology (the dotted isoquant), i.e., which
combinations of tasks yield the outcome XD, differs from the actual one. Figure 2c is
drawn such that the actual isoquant is steeper for any given allocation, i.e., decreasing task z1 marginally requires a larger increase in task z2 in order to retain XD in the actual
case than what the principal guessed. Under the assumption that
{
zˆ z1,ˆ2}
results in XDall other combinations of tasks along the solid isoquant by definition also yield XD.
Thus, we get a similar outcome as in the price dimension case; the unit price contract specifying
{
zˆ z1,ˆ2}
is unnecessarily costly as there is another combination,{
zc zc}
2
1, in
Figure 2c, that achieves the same outcome at a lower cost.
Intuitively, the risk that the principal’s guess is not cost minimising is likely increasing in the complexity of the project. The notion put forward in Figure 2 suggests that a project may be considered more complex the less curved the isoquant is at
{
zˆ z1,ˆ2}
.2 In the extreme case with Leontief (L-shaped) isoquants, there is no substitutability between the different tasks. The cost minimizing combination of tasks is consequently the same irrespective of the relative prices since there is no alternative way to produce the service. To tie complexity to the curvature of the isoquant in this way thus yields that a given change in relative prices results in smaller change in the mix of input factors for less complex projects.The setting with two tasks may be extended to a row vector Z of arbitrary size without changing the qualitative outcome of the discussion. The principal must still make a guess about relative prices and which values of the Z vector is most appropriate to use in the quote. Consequently, also in an extended version the principal may fail to reach a cost-effective outcome since the actual relative prices and/or technology may differ from the principal’s estimate.
A project’s multidimensionality suggests an additional layer of complexity. The size of a project may be measured in two dimensions. Implementing
{
zˆ z1,ˆ2}
where the single valuesare large clearly means that the project as such is large, for instance with respect to the length
2
of the road to be built. While this does not necessarily add to complexity, the number of input components does. It will be more difficult for the principal to see through the particulars of a project which comprises many activities. It is therefore reasonable to expect that it is more difficult to specify the cost minimizing Zˆ vector the larger the number of activities is.
The DB approach to contracting handles several of the challenges in implementing XD in a
different way than if UPC is used. There are two reasons for this, both of which are associated with asymmetric information. First, as the agent most likely has superior information
regarding relative prices and the technology at his disposal, he is better equipped than the principal to find a cost-minimizing approach resulting in XD than the principal is. That is, the
problems illustrated in Figure 2b and 2c are dealt with in a different way.
Second, under UPC the agent is restricted to the tasks specified in the contract, i.e.,
{
zˆ z1,ˆ2}
. Since the mapping from{
z1, z2}
to X is handled by the agent under DB there is more room for flexibility. In particular, there may be a entirely different input mix,{
z3, z4}
which delivers XDat lower cost than
{
z1, z2}
; this would then be the “innovative solution” which the laggard industry would benefit from. The agent will be sitting “close” to the construction site and is better fit to handle unforeseen circumstances by altering z1 and z2, or by using some altogetherdifferent set of inputs in order to have XD built. Also, the more complex a project is, the more
difficult it may be to identify alternative techniques for having a project built on beforehand. While the only chance to adopt innovations under UPC is that the principal identifies these novel approaches prior to the specification of the quote, DB leaves this option open for the agent.3
To sum up our naïve comparison, the outcomes from the two contracting approaches may be identical since the agent may always mimic
{
zˆ z1,ˆ2}
if given this opportunity under DB. Since the agent will chose which combination of tasks to conduct and since the agent is better informed about both relative prices and technology, the total costs will most likely be lower under DB than under UPC.3
This is thus a typical hidden characteristics problem where the agent but not the principal knows what type the agent is. A standard solution to such problems is to provide a menu of contracts from which the agent may choose, see, e.g., Laffont and Tirole (1993). However, we observe no such solutions in our data.
This reasoning fits badly with the empirical observation that many contracts are of unit price type. This suggests that there is something not covered by the naïve framework, that not only counters, but outweighs the effects discussed above. In the following section we will give a series of suggestions on what this may be.
4. Extensions of the simple framework
The present section examines three assumptions implicit in the naïve modelling of section 3 to see if these may explain the discrepancy with the observed situation; choosing the (levels of the) task vector Z is costless (section 4.1); the outcome, X, is fully observable (4.2); and there is no uncertainty in the mapping from Z to X (4.3).
4.1 Establishing the task vector Z is (not) costless
Including the costs for preparing the detailed project specification provides a straight-forward explanation for why UPC may be preferred to DB. Our previous argument was that the winning agent under DB has superior information regarding relative prices and technology, and therefore has an advantage when designing the project. DB therefore delivers the
construction of XD at the same or a lower cost, CConstj , j=DB, UPC. However, all n agents will
have costs i Design
C , i=1,…,n, for preparing their respective bids in a DB contest. These costs
are largely project specific and thus sunk. In contrast, the UPC has the principal design the project at cost CDesignP before the agents submit their bids. Assuming that design costs do not differ between bidders, the total design costs are obviously higher in DB than in UPC;
P Design i Design i i Design nC C C = >
∑
.4 However, while the UPC requires an elaborate design in order to facilitate the procurement, the agents in the DB may defer specific design issues until they know whether or not they have won the procurement. This suggests that the design carried out before the procurement is more costly for the principal in the UPC than for an individual agent in the DB.4
There may also be a difference in evaluation costs following from that the DB contracts are more difficult to evaluate. As a share of the total costs, this is probably small.
One immediate conjecture is therefore that DB becomes more costly, and UPC relatively better, when the expected number of bidding agents is large. At some number of bidders, n´, total costs for the two will be equal, i.e. UPC
Design UPC Const DB Design DB Const n C C C C + ′* = + . Moreover, if there
are no or very limited alternative designs, the benefit with having several agents preparing drawings is negligible or small. This would indicate that UPC ceteris paribus is better for projects with few inputs and for projects with little technical substitutability – if it is feasible to identify this latter feature ex ante.
Prospective bidders for DB projects must consider whether or not to sink costs in preparing a bid and how to invest in the design. There are several aspects which affect the number and quality of submissions.
• When the number of potential bidders is large, the probability for an agent to win the contract is smaller, ceteris paribus. This will reduce the incentive to submit a bid.
• On the other hand, as competition increases, it may be necessary to invest more in preparing drawings in order to identify a cheap design which enhances the chance to win. This would work to improve the quality of each submission.5
• It is also reasonable to expect that the cost for designing a project is growing in complexity. This refers to projects with substantial possibilities to substitute between inputs, or where innovative implementation strategies are feasible, or where the number of activities required completing the tasks is large are probably more costly to design than less complex projects. This would then put a brake on the willingness to invest in a design required for submitting a bid, cf. Estache and Iimi (2009) and Gal et.al. (2007).
From the perspective of the Principal, he may opt for UPC if he believes that the DB approach, and the associated sunk costs, could result in few bidders, cf. Bajari et.al (2008). This may be a rational strategy if a low number of bidders may lead to a high winning bid.
5
The ambiguity illustrated by these two points has been subject to research both in the field of experimental economics, e.g., Darai et.al. (2010), and industrial organization, e.g., Vives (2008).
4.2 Observability of inputs and output
In our naïve model Z and X are implicitly assumed to be perfectly observable. This
assumption is, however, not very realistic. One way to model this is to let X be a composite of two dimensions, one which consists of observable characteristics, denoted XO, and the other being characteristics that are not observable once the product is constructed, denoted XNO. While it is straightforward to establish whether the road has been built according to the criteria subsumed in X, it is more difficult to verify quality once a road has been covered with a black top. Insufficient quality is manifested in time to reinvestment and projects are
typically designed in order to last for at least t* years until the first renewal. Since there are several years from that a new road has been opened for traffic to the first instance of pavement reinvestment, the agent will have been paid for construction and guarantees are void if the renewal must be done prior to what is expected.
If the agent may put efforts into different tasks, some of which influences XO and other that influence XNO and the contract is based on XO only, the agent should not be expected to spend effort on XNO. The ‘equal compensation principle’, formalized by Holmstrom and Milgrom (1991), establishes that the agent will divide his efforts such as the marginal cost of effort for each task equals the marginal revenue.
DB works by observing X without regard for the input vector, since the principal is not
involved in the choice of construction method. Since effort spent on non-observable quality is not reimbursed, the agent can not be expected to allocate effort to quality-enhancement under a DB contract. In contrast, UPC handles quality in two ways. First, Z is specified in a way which the Principal believes is appropriate for minimising the asset’s life cycle costs. Secondly, Z is recorded by the agent before invoicing the principal, and the principal (randomly) monitors the reports. This provides less scope for deviating from appropriate quality under UPC.
There are at least two situations where this problem is less pronounced; when XNO is small compared to XO and/or where XNO is highly correlated with XO. In most situations it would also seem possible to increase the amount of observable information, i.e., increasing XO while reducing XNO, by investing in monitoring. How this can be done will differ from case to case and, hence, so will the costs associated with it. Clearly, in some cases it will not be justifiable to invest in (further) monitoring even if such investment are feasible simply because the costs will outweigh the potential benefits.
From this we conjecture that the merits of the UPC approach relative to those of DB increase when 1) a substantial share of X is not observable and 2) when the cost of monitoring the tasks Z is lower than the costs of monitoring XNO.
4.3 The certain mapping from inputs to output
Except for the possibility that the agent is better informed about the (most) cost effective way to implement a project, we have thus far implicitly assumed that there are no uncertainties in the mapping from {ˆz1,ˆz2} to XD. Given the complexity of many infrastructure projects, this
assumption may be highly unrealistic. Rather, it would seem more realistic that the input requirements in expectation results in a product of quality X. The actual, ex post, amounts of input factors may thus be {~z1,~z2}, which may differ from the expected values {ˆz1,ˆz2}. This would mean that the actual use of inputs in the way prescribed by the contract may at some instances be higher and at other lower than expected.
The two contract types however differ with respect to allocation of the risk for cost overdraws due to unexpected realisations. Under a UPC, the agent stands the risk for having submitted a price vector which will not suffice to cover his costs, given Zˆ . On the other hand, the
principal carries all risk related to the input specification. If z~ >i zˆ , and as long as the i
principal is reasonably certain that the agent is not shirking, the agent is reimbursed for actual work, because otherwise XD would not materialise.
A DB project is based on a fixed price contract where the winning agent has submitted bid B for the right to construct XD. This provides incentives for the agent to exert optimal effort. The
downside is that the agent also carries all risks related to the successful implementation of the project.
The choice between DB and UPC therefore influences the risk allocation between parties. As long as both are risk neutral, this will not affect the ranking of the two approaches. However, if agents are more averse to carry risk than the principal, typically a large governmental authority, the risk dimension can not be neglected. Thus, it is necessary to explore likely consequences from assuming risk averse agents while retaining the assumption of risk neutrality for the principal.
A risk averse agent will demand compensation for the risk exposure by requiring a higher expected payment than in the no-risk case. While risk pertains to the price vector under UPC, it also includes the vector of quantities for the DB contract. As a result, bidders are induced to include a higher risk premium for a DB contract in order to provide insurance against
unpleasant surprises. All other aspects being equal, this provides an argument in favour of UPC over DB. The merits of UPC increase when the agent is more risk averse and when the outcome is more dependent on random events.
Except for random variations around {ˆz1,ˆz2}, construction projects run the risk for
systematic underestimation of the workload due to external sources of risk that are common to all bidders6. A prominent example would be that the geotechnical preconditions are worse than expected.7 While the randomness assumption may be appropriate for projects built on sand, gravel, moraine or Archean rocks, construction risks may be higher if a project is to be built over marshlands or in regions where the quality of the ground is less good. This problem is acute when geotechnical pre-studies fail to identify any upcoming problems, since in this situation more work than predicted will have to be undertaken in order to bring the
assignment to an end. An obvious motive for using UPC is, thus, that fixed price contracts would provide substantial reason for bidders to ask for higher compensation to be prepared for non-random cost realisations. Even if the risk for non-random events only applies to some projects, the problem is that these instances may be difficult to identify in beforehand.8
Finally, two other features of UPC contracts are complementary to the presence of random uncertainty. First, even in situations where z~ <i zˆ , agents may be creative in finding reasons to i
undertake all activities up to the initial expectation. This provides a rationale for expecting that {ˆz1,ˆz2} often is a floor for implementation rather than the expectation. A second possible
6
Hong and Shum (2002) discuss bidding strategies in procurements when there are both common- and private value components.
7
Other examples of completely external sources of risk are weather conditions and traffic growth which is largely determined by GDP growth. These uncertainties are external to the agent but since we focus the construction part of the contract it is neglected for now.
8
There are indeed other approaches than UPC to handle these risks, including cost plus or incentive contracts. A discussion of these alternatives is beyond the scope of the present discussion.
reason for cost overdraws in UPC contracts is that unbalanced bidding may further skew incentives and increase costs, cf. Ewerhart and Fieseler (2003). This would happen if the bidder(s) are aware of that the quote for bids {ˆz1,ˆz2} overestimates one quantity and
underestimates another. If this is so, the bidder has reason to reduce the bid for the former and to boost the bid for the latter input, ceteris paribus increasing expected profit. This provides two arguments for why the final payment Zp~typically is larger than the ex ante expected cost Zp ˆ. Bajari & Tadelis (2001 and 2007) discusses these issues.
4.4 Summary
The conjectures identified in the present section are summarized in Figure 3 with the Design Build approach on the left hand and the Unit Price Contracts approach on the right hand side. The figure is an attempt to capture what will make the UPC a more likely candidate for an optimal approach. The conjectures are grouped under three headings; those that primarily are associated with the characteristics of the project, with design issues and with the agents, respectively. To some extent the different headings are overlapping.
Even though the simple framework we introduced above provides a rather strong case for the DB approach in that it allows for the agent to benefit from his superior information, i.e. arguing for moving to the left in Figure 3, there are a series of circumstances that potentially outweigh this, and thus motivates moving to the right in Figure 3. Figure 3 does not provide a ranking of these circumstances, and such a ranking is most likely project specific.
Figure 3, Summary of conjectures
DB UPC
Cost of monitoring input Design alternatives Dependence on random events Share of outcome being unobservable
Common risk
Design costs
Design’s influence on random event impact
Number of agents Agents’ level of risk aversion Difference between agents’ relative prices
Difference between agents’ technology
Low Few Large Large Large Large Large Large Large Small Small High Many Small Small Small Small Small Small Small Large Large Project specific Design specific Agent specific
5. Empirical observations
In this section, the conjectures put forward above will be compared to some empirical
observations. This is based on a unique data set comprising some 1400 road construction and renewal projects procured by the Swedish road administration 2000 – 2009. It contains information about the procurement approach (UPC, DB or other), type of project, expected project duration, all bids submitted (including the bidders’ names) etc. At the time of writing, the available data does not contain ex post information, e.g., the actual outcome, and it is very limited in its description of the projects as such. For instance, it does not provide information of project size. Even if it is possible to make a distinction between a major highway and a small rural road, it is not feasible to tell whether the respective type of projects is for the construction of 10 or 100 km of road. Limitations such as these imply that the data is not rich enough to allow for formal tests of the conjectures presented in Figure 3. However, it does allow for some relevant observations.
The first observation is that the large majority of the investments were conducted using UPC. Only 86 projects are classified (by the National Road Administration) as being based on DB contracts9. As illustrated in Figure 4, DB has become relatively more common in the later years of the studied period, but is still applied only for a minor share of the projects.
0% 10% 20% 30% 40% 50% 60% 70% 80% 90% 100% 2 0 0 0 2 0 0 1 2 0 0 2 2 0 0 3 2 0 0 4 2 0 0 5 2 0 0 6 2 0 0 7 2 0 0 8 2 0 0 9 UPC DB
Figure 4, Share of UPC and DB over year.
9
For 13 projects the procurement design is unknown and for 15 projects some other design has been used. These are excluded from the subsequent analysis.
We are not able to fully disentangle the conjectures regarding the project as such (top right in Figure 3) from those regarding design characteristics (middle right), nor to draw conclusions regarding the specific conjectures due to limitations of the data set. However, we may use the data to investigate whether the different approaches are used for different kinds of projects, i.e., if the projects’ characteristics are important for determining the choice of procurement approach as suggested by our discussion above. One circumstance that would support this is the difference in contract sums. The average contract sum of UPC contracts is about 20 million SEK while DB contracts on average are for 113 million SEK.10 Even if outliers would be excluded (cf. Figure 5), DB projects are on average substantially larger than UPC. This may serve as an indication on a systematic difference between which kinds of projects are procured through UPC and DB. There is an obvious caveat in that the sum in the DB case also must cover design costs (carried by the principal in the UPC), which implies that we would expect the DB sum to be higher. As the available data does not allow us to distinguish design costs from construction costs, we do not know to what extent this could explain the
differences in contract sums.
0% 10% 20% 30% 40% 50% 60% 70% 0 t o 1 0 1 0 t o 2 0 2 0 t o 3 0 3 0 t o 4 0 4 0 t o 5 0 5 0 t o 6 0 6 0 t o 7 0 7 0 t o 8 0 8 0 t o 9 0 9 0 t o 1 0 0 1 0 0 + DB UPC
Figure 5, Distribution of projects of different contract sums (million SEK) for DB and UPC.
For most of the projects (about 70% for both UPC and DB) the data contains information about the expected number of months over which the project will run. This may serve as an alternative measure of size and complexity. The mean duration time for UPC projects is 8.2 months while it is 18.0 months for DB projects. Even though the mean duration is more than
10
twice as long under DB, the difference is not statistically significant as the standard deviations are large (7.2 and 18.4, respectively). As seen from Figure 6, a large part of the projects both in the UPC (58%) and DB (33%) are short, i.e., 6 months or less. However, only 5% of the UPC projects are longer than 24 months, while the corresponding figure for DB is 25%.
0% 10% 20% 30% 40% 50% 60% 70% 0 t o 6 7 t o 1 2 1 3 t o 1 8 1 9 t o 2 4 2 5 t o 3 0 3 1 t o 3 6 3 7 t o 4 2 4 3 t o 4 8 4 9 t o 5 4 5 5 t o 6 0 6 1 t o 6 6 6 7 t o 7 2 7 2 + DB UPC
Figure 6, Share of projects over project duration (measured in months)
Looking more closely at what kinds of projects are carried out under the two approaches reveals further interesting differences. The DB is mainly used for bridges and roads. The absolute number of bridges and roads built is still much larger under UPC than DB (388 vs. 22 for roads and 155 vs. 13 for bridges). Figure 7 shows the shares of the number of projects contracted through DB and UPC respectively. The figure lends some support to the notion that DB is used for more complex projects as the shares for DB are higher for projects such as highways, roads, tunnels and bridges. Arguably, these projects are more complex than paving and bus stops where the DB exhibits a small share. The largest difference is for pavement renewal, where 432 projects have been conducted under UPC during the period while only 7 under DB.
0% 5% 10% 15% 20% 25% 30% 35% 40% Hig hway Oth er ro ad Tunn el Brid ge Rou ndab out Inte rcha nge Foot /Bik e pa th Bus stop s Pavi ng Oth er DB UPC
Figure 7, Share of project types for different procurement approaches.
The differences in these three measures - contract sum, contract duration and project type – arguably all support the conjectures we have made regarding project differences as they may be interpreted as less complex projects being more likely to be procured through UPC while more complex ones are more likely procured through DB. This is in line with the overarching idea put forward above, i.e., that there is little to gain from using DB when there is little room for innovation in the design phase. We have also stretched that there may be situations with ample room for innovations but where the UPC is still preferable, as seen from Figure 3. The available data does not allow us to draw any conclusions regarding this, but it may be an explanation to the large variation observed.
The theoretical analysis has also conjectured that the expected number of competing bidders should influence the choice of DB versus UPC. However, two opposing effects are
anticipated. On the one hand, if the number of bidders is large, the DB results in a lot of resources being wasted as every bidder must invest in the design phase and for all but the winning bidder these investments are (largely) sunk. On the other hand, a large expected number of bidders increases the possibility of some bidder finding an innovative solution. Thus, we have no hypothesis about the number of bidders in the two approaches as
aggregates. Furthermore, while the number of actual bidders is given by data, no information is available about the expected number which is what should influence the UPC vs. DB choice. For the DB the average number of bidders is 3.3, which is below 4.3 being the corresponding number under UPC – possibly supporting the idea that the number of bidders
should be lower under DB to avoid sunk costs. The variation in the number of bidders is small; the standard deviation is 1.5 both in the DB and in the UPC case.
The empirical observations that we are able to draw from the, admittedly limited, data thus yield a mixed picture. The data provides rather strong indications on that the project
characteristics influence the procurement strategy such that larger and more complex projects seem to exhibit a larger probability for being procured through DB. The more specific
conjunctures, e.g., regarding the degree of common uncertainty or risk aversion of the agents, requires a richer data set to be examined.
6. Concluding discussion
The naïve conclusion from a simple framework in section 3 was that using DB could never be more expensive than contracting on UPC. Section 4 blurred this picture substantially.
UPC is the received way for contracting, in Sweden as well as in many other countries. It is reasonable to believe that this signals a very basic rationality, i.e. that this type of contract in reality has many benefits. But it also has obvious downsides, several of which have been identified here. It is also notable that the construction industry is a laggard in productivity terms, compared to other sectors of the economy. Reasons for this may be plentiful, but one of them could be the limited scope for innovation, inherent in UPC.
Although UPC in many situations may be a cost efficient way for procuring infrastructure investments, our discussion has identified a number of features which indicate that DB in many situations may be preferred. Projects which, ceteris paribus, should be expected to function better under DB have the following qualities:
• The expected number of bidders should not be too large in order to avoid duplication of design costs. It is straightforward to implement this by way of a standard two-step procurement strategy where only a few bidders are shortlisted to prepare the final bid.
• The project should be complex – a substantial number of tasks have to be undertaken in order to complete it and there should be substitutability in input use – since it would otherwise not be possible to reap benefits from the agent’s superior
information about alternative implementation techniques in combination with relative input prices.
• The presence of unobservable quality features should not be too large. One way to reduce the risk for suboptimal quality is to extend the length of the DB contract so that it also comprises a maintenance period. Quality problems would then have to be dealt with by the contractor under these performance contracts.
• The projects should entail small common risks, e.g., for geotechnical problems. If geotechnical trouble spots could be identified in beforehand, these could be singled out from the overall assignment and contracted on cost plus or incentive conditions.11 Moreover, the principal could pay for a geotechnical survey which is made public as part of the quote for bids. Risk with respect to deviations from the forecast could then stay with the principal, much in the same way in which all quantity risk is today sits with the principal under UPC contracts.
11
There are examples from tunnelling projects which have separated risk allocation into two distinctive parts. Tasks, such as transporting the rock from the tunnel, which include little uncertainty are signed under a fixed price structure; tasks the volume of which is related to the quality of the rock is rather contracted for with an incentive structure where the parties split cost overdraws and savings according to a preset sharing rule.
References
Bajari P., and S. Tadelis (2001). Incentives versus Transaction Costs: A Theory of Procurement Contracts, RAND Journal of Economics, Vol. 32, No. 3, pp. 387-407
Bajari, P., R. McMillan and S. Tadelis (2008). Auctions versus Negotiations in Procurement: An Empirical Analysis, Journal of Law, Economics, and Organization, Vol. 7, pp 1-28
Bajari, P., S. Houghton, S. Tadelis (2007). Bidding for Incomplete Contracts: An Empirical Analysis of Adaption Costs. Working Paper, UC Berkeley.
Bengt Holmstrom and Paul Milgrom, (1991). Multitask Principal-Agent Analyses: Incentive Contracts, Asset Ownership, and Job Design, Journal of Law, Economics, & Organization, Vol. 7, pp. 24-52
Estache A., and A. Iimi (2009). Auctions with Endogenous Particiapation and Quality
Thresholds: Evidence from ODA Infrastructure Procurement, ECARES Working paper 2009-006.
Ewerhart C. and K. Fieseler (2003). Procurement Auctions and Unit-Price Contracts, The
RAND Journal of Economics, Vol. 34, No. 3, pp. 569-581
Gal S., M. Landsberger, and A. Nemirovski (2007). Participation in Auctions, Games and
Economic Behavior, Vol. 60, pp. 75-103
Hong H. and M. Shum (2002). Increasing Competition and the Winner’s Curse: Evidence from Procurement, Review of Economic Studies, Vol. 69, pp- 871-898
Laffont, J.-J., and J. Tirole (1993). A Theory of Incentives in Procurement and Regulations, MIT Press, London England.
Vives, X. (2008). Innovation and Competitive Pressure, The Journal of Industrial Economics, Vol. 56, pp. 419-469.