A study of Environmental Disclosure
within the OMXS30
- with reference to the Global Reporting Initiative
MASTER THESIS WITHIN: Business Administration – Accounting
NUMBER OF CREDITS: 30 ECTS
PROGRAMME OF STUDY: Degree of Master of Science in Business and Economics
AUTHOR: Gustafsson, Viktoria
Jonsson, My
Acknowledgement letter
The authors of this thesis would like to thank our tutor, Gunnar Rimmel, for valuable feedback and help during the process of writing this thesis.
Further, the authors would also like to thank fellow students and discussants for helpful inputs and constructive feedback.
Jönköping University May 2017
Master Thesis in Business Administration – Accounting
Title: A study of Environmental Disclosure within the OMXS30 – with reference to the Global Reporting Initiative
Authors: Gustafsson, Viktoria Jonsson, My
Tutor: Rimmel, Gunnar
Date: 2015-05-19
Key terms: Environmental disclosure, GRI, Legitimacy theory, Environmental indicators.
Abstract
Background: Climate change is an urgent issue which needs to be addressed and it is not uncommon for large companies to be involved in environmental scandals. Companies included in the OMXS30 both affect and are affected by the global and local environment. Sweden is on the forefront of sustainability. Yet, in recent years Swedish companies have been involved in such scandals. Therefore, it is important to further increase the transparency of corporate operations. The Global Reporting Initiative provide a voluntary set of guidelines which companies can use to report on sustainability matters in general and environmental issues in particular. Sustainability reporting is a common research topic. However, few studies have been done on measuring environmental indicators used by companies applying the GRI guidelines.
Purpose: The purpose of this thesis is to measure which environmental indicators
from the GRI framework are mostly reported on in 2015, among companies included in the OMXS30. Further, it aims to plot potential differences between the sectors represented in the sample. To detect patterns these two questions will be evaluated over a five-year period, 2011-2015.
Method: To conduct this study a mix between quantitative and qualitative research
methods will be used. The data will be collected using a quantitative approach and analysed using qualitative content analysis. This study will use secondary data, collected from company reports through the GRI sustainability database or the company website.
Conclusion: The results of this study shows environmental indicators in the aspects energy and emissions to be the most reported on. This finding is consistent for the five years included in this study. Further, this study found differences in reporting between the sectors included in the sample. Almost all companies reported on the indicators that was found to be most common in this study, but differences were found in the level of reporting between the sectors.
Abbreviations
CSR – Corporate Social Responsibility EN – Environmental Indicator
ESI – Environmentally Sensitive Industries EU – European Union
GHG – Greenhouse Gas
GRI – Global Reporting Initiative NMA – National Mining Association TBL – Triple Bottom Line
UN – United Nations
Table of Contents
1.
Introduction ... 1
1.1 Background ... 1 1.2 Problem ... 3 1.3 Research question... 4 1.4 Purpose ... 4 1.5 Delimitation ... 4 1.6 Outline ... 52.
Frame of reference ... 6
2.1 Sustainable development ... 6 2.1.1 Political setting ... 7 2.2 Environmental disclosure ... 9 2.3 Legitimacy theory ... 112.4 The Global Reporting Initiative ... 12
2.4.1 G3 ... 14 2.4.2 G4 ... 15
3.
Method ... 16
3.1 Research approach ... 16 3.2 Research strategy ... 16 3.3 Sample ... 17 3.4 Data collection ... 18 3.5 Disclosure index ... 19 3.6 Data analysis ... 21 3.7 Critical reflection ... 234.
Empirical findings ... 24
4.1 Environmental disclosure in 2015 ... 244.1.1 Change over five years ... 26
4.2 Environmental disclosure by sectors in 2015... 28
4.2.1 Change over five years ... 29
5.
Analysis ... 31
5.1 Environmental disclosure and development over time ... 31
5.2 Environmental disclosure by sectors and development over time ... 33
6.
Conclusion ... 37
6.1 Discussion ... 38
6.2 Ethical and social issues ... 39
6.3 Future research ... 40
Figures
Figure 3.1 Number of companies per sector ... 18
Figure 4.1 Score per indicator in 2015 ... 24
Figure 4.2 Top three reported indicators in 2011 ... 26
Figure 4.3 Top three reported indicators in 2012 ... 26
Figure 4.4 Top three reported indicators in 2013 ... 26
Figure 4.5 Top three reported indicators in 2014 ... 27
Figure 4.6 Total score per sector ... 29
Tables
Table 3.1 Conversion table ... 19Table 3.2 G4 Disclosure index ... 21
Table 4.1 Frequency score per aspect in 2015 ... 25
Appendix
Appendix 1 Coding Schedule ... 491. Introduction
_____________________________________________________________________________________
The first chapter will provide the reader with a background and a problem discussion which present why this thesis is relevant. Furthermore, the research questions and the purpose of this thesis will be presented, as well as the delimitations used when designing the study. Lastly, the reader will be presented with an outline over the remaining chapters of this thesis.
______________________________________________________________________
1.1 Background
Globalisation has improved life for a lot people around the world. It has provided us with access to high speed technology and increased competition which has enhanced consumption and fertilized economic development (Kuepper, 2017). Despite these positive aspects, globalisation has also contributed to some concern. The increasing level of manufacturing and consumption have a great impact on the environment (UN, 2015). Commodities are being shipped to consumers all over the world, and research has shown transportation to be responsible for 75 per cent of the world-wide trade emissions (Cristea, Hummels, Puzzello & Avetisyan, 2013). Increase in temperature, changes in rainfall, increase in sea levels, and melting of glaciers and snow are all signs of the ongoing climate change. To alleviate climate change, activities as burning of fossil fuels and deforestation must be reduced (EEA, 2017). Actions against climate change needs to be taken to ensure sustainable development (UN, 2016). Globalisation and economic development has turned companies into powerful multinational corporations, and as the famous saying goes; “with great power comes great responsibility”.
In September 2013, the Swedish mining company Boliden was accused of dumping 20,000 tonnes of smelter sludge in the Arica area, Chile, in the early 1980s. Boliden sold their waste to a Chilean company but the waste was left unprotected and unprocessed. A few years later, people built houses nearby this location and in 2009 the area was evacuated, as it was still contaminated. Since then the residents have suffered from health problems, e.g. miscarriages and cancer, and high levels of arsenic has been found in their blood. The Chileans claim Boliden knew the waste could pose a significant health threat and hence acted negligently. The victims in Arica request 91 million SEK, plus interest, in damages but the case is not yet settled (Kosich, 2013).
In 2015, news concerning Swedish corporations SKF and Volvo’s membership in the National Mining Association (NMA) emerged. Being a lobby organisation, NMA has tried to counteract environmental policies spending over 100 million dollars on discrediting wind- and solar power. This news is disturbing as both corporations collaborate with the World Wildlife Fund. When contacted by Swedish Television, SKF announced that their membership in NMA were to be cancelled that same day (Bergstedt & Winberg Zachrisson, 2015).
Sweden is seen as a pioneer within sustainability reporting and Swedish companies have made great progress within the field (The Swedish institute, 2013). Boliden has produced standalone sustainability reports since 2005 (Boliden, 2016), and Volvo has done the same since 2007 (Volvo Group, 2017). SKF has produced standalone environmental sustainability reports since 1994, and see themselves as part of the first trend-setters in this area (SKF, 2013). Yet, they have not been able to avoid environmental scandals or to cause environmental harm, despite issuing sustainability reports. These examples of environmental scandals display the need for accountability regarding corporate impact on the environment, and call for increased transparency concerning environmental disclosure. Accountability is the recognition of actions for which the organisation is held responsible (Gray, Adams & Owen, 2014). When companies are transparent about their activities and impacts on society, they gain and maintain trust from stakeholders which is crucial to build a sustainable economy (GRI, 2011a).
One way for corporations to show responsibility and to be held accountable is through sustainability reporting, which presents a link between business strategy and its commitment to sustainability. Companies tend to gain long-term benefits from sustainability, but short-term costs might hinder the adoption of sustainability. Communication and an understanding of the underlying problem is necessary to convince more companies to report on sustainability (Joseph, 2011). There is no universal definition of reports on sustainability, yet the most common terms and names of such reports include; sustainability, corporate social responsibility (CSR), accountability, and triple bottom line (TBL) (Davis & Searcy, 2010; Roca & Searcy, 2012). This paper will refer to such reports as sustainability reports. One of the most globally recognised sustainability reporting frameworks is the Global Reporting Initiative (GRI) guidelines
(Skouloudis, Evangelinos & Kourmousis, 2009). They have even been found to be “the most popular voluntary reporting guideline worldwide [...]” (KPMG, 2015, p. 5). Established in the late 1990s, the GRI started with an environmental focus but later also came to include social and economic aspects in the framework (EY, 2016). Encompassing matters as energy consumption, transport, protection and restoration of habitats, and greenhouse gas (GHG) emissions, the guidelines offer a scope of environmental indicators on which organisations can report (GRI, 2015). While the social and economic aspects are crucial to acknowledge when developing a sustainable world, environmental disclosure is essential, especially in the context of climate change and corporate environmental scandals. One theory commonly used to provide explanations for, and insights in to, voluntary environmental disclosure is the legitimacy theory. Due to pressure from stakeholders and society companies with bad environmental performance will use environmental disclosure to offer explanations to attain legitimacy (Dawkins & Fraas, 2011).
1.2 Problem
Sustainability and environmental awareness is a popular research topic. With research starting on social responsibility in the 1950s (Carroll, 1999), the topic is still receiving a lot of attention to this day (e.g. Fifka, 2013; Miralles-Quiros, Miralles-Quiros & Arraiano, 2017). A huge challenge facing corporations is the process of establishing themselves and being able to grow without harming the fundamental natural systems on which all living beings and the planet relies (Collin & Collin, 2010). Sweden is ranked as the second most sustainable country in the world (robecoSAM, 2016), and in 2007 became the first country to require state owned corporations to comply with the GRI guidelines (The Swedish institute, 2013). Despite the high ranking of sustainability, Sweden and Swedish corporations have not been able to avoid environmental scandals, not even in recent years. OMXS30 consists of listed companies which shares have the highest turnover on the Swedish stock exchange (Nasdaq, 2017). Therefore, they are affected by global and local forces but are also affecting global and local environments, which further increases the need for transparency.
There are examples of large companies producing sustainability reports, while still being involved in environmental scandals, e.g. Boliden, Volvo, and SKF, which all have
adopted the GRI guidelines. Many studies have been conducted on sustainability reporting, yet not so many on measuring indicators used by organisations following the GRI guidelines (Roca & Searcy, 2012). Thus, the ambition of this study is to measure the use of environmental indicators among the most traded Swedish corporations, applying the GRI guidelines, and observe which indicators are the most reported. Furthermore, several sectors will be included in the present study, enabling a display of potential differences in reporting between sectors. The study will also evaluate changes in reporting over time, mapping potential increases or decreases in reported indicators.
1.3 Research question
The main research question for the present study is;
➢ Which environmental indicators are mostly reported in 2015 by companies within OMXS30?
This leads to two sub-questions;
➢ What are the differences between the sectors represented in the sample, in 2015? ➢ How has both these questions changed over the last five years, 2011-2015?
1.4 Purpose
The purpose of this thesis is to measure which environmental indicators from the GRI framework are mostly reported on in 2015, by companies listed on the OMXS30. In addition, this thesis aims to plot potential differences between the sectors provided in the sample. To gain further insight in the environmental reporting in Sweden these questions will be evaluated over a five-year period, 2011-2015, to detect potential patterns.
1.5 Delimitation
The present thesis is limited to companies applying the GRI guidelines during at least one year between the years 2011-2015, and are included in the OMXS30 as of 2017-03-16. Companies listed on the OMXS30 which do not apply the GRI guidelines during any of the studied years are excluded. The companies must also be included in the GRI sustainability database.
1.6 Outline
Frame of reference The second chapter of this thesis will provide the reader with a comprehensive background on the sustainable development in general and environmental disclosure in particular. The legitimacy theory will be explained in the context of environmental disclosure. Lastly, the GRI guidelines will be carefully explained.
Method In the third chapter the authors of this thesis will present the research approach, and the chosen research strategy. The data collection process is explained, and the GRI disclosure index used to collect the data is explained. Further the data analysis is defined and the authors state how replicability and validity is ensured.
Empirical findings In the fourth chapter the collected data will be presented using diagrams and tables, summarising information from the appendices. First, the level of frequency of the reported indicators will be displayed as well as changes over a five-year period. Then data from the different sectors is presented.
Analysis The fifth chapter will provide the reader with an analysis of the result presented in chapter four. The analysis is conducted in conjunction with the frame of reference from chapter two.
Conclusion In chapter six the research questions are answered and conclusions given. A discussion on strengths and weaknesses of this study is provided along with social and ethical issues. Lastly, suggestions for future research are given.
2. Frame of reference
_____________________________________________________________________________________
This chapter will give the reader a theoretical background on environmental reporting. It will start with providing a general background on the sustainable development over the last decades, and provide insight into political decisions facilitating sustainable development. It will also present the legitimacy theory and recent research in conjunction to this theory. Furthermore, the reader will be provided with a theoretical background on the research concerning environmental disclosure, and an explanation of the GRI and the guidelines. ______________________________________________________________________
2.1 Sustainable development
In 1987, the World Commission on Environment and Development (WCED) released a report concerning sustainable development, mostly known as The Brundtland report. It supported economic development aiming to increase the quality of people’s life, while simultaneously protecting the environment and make sure natural resources were preserved (UNECE, 2005). Many definitions of sustainable development exist in the academic literature, yet the most acknowledged definition originates from the Brundtland report (Moneva, Archel & Correa, 2006; Steurer, et al., 2005). In the report from WCED (1987, p.1) sustainable development was defined as “[the] development that meets the needs of the present without compromising the ability of future generations to meet their own needs”.
In the mid-1990s, John Elkington developed the TBL framework as a way of measuring the sustainable performance in a company. The TBL encompasses three aspects of performance; social, environmental, and financial (Elkington 1997). It is also commonly referred to as the three P's; People, Planet, and Profit. The TBL is a flexible concept allowing organisations to adapt in a way that is suitable for their specific needs (Slaper & Hall, 2011). Norman and MacDonald (2004) criticise the TBL framework for being misleading and for promising something it cannot deliver. They also claim this is a part of brand management and a tool for attracting customers through corporate image. Further, Slaper and Hall (2011) argue that the framework is hard to measure since it does not have a uniformed standard method for the calculations. Despite the criticism, the TBL is a well-known concept widely used as a foundation for sustainability reporting around the world (GRI, 2006; Lamberton, 2005).
Through sustainability reporting companies offer more transparency and increased accountability (Kolk, 2008). This enables them to display both the positive contribution and the negative impact they cause and thus communicate the risks and opportunities they face. Organisations from all around the world, of various size and sectors, report on sustainability (GRI, 2015). In a report from KPMG (2015) it is shown that 92% of the 250 largest companies in the world report on corporate responsibility. Sustainability reporting is improving both in terms of quality and scope, and driving this is the markets’ demand for more transparency as well as regulatory demands. A global trend appears to be a more comprehensive and narrative reporting (Valsan, 2014, 26 October). Sustainability reporting can be a way for companies to attract a greater audience (Kolk, 2008) and in today’s business society, sustainability reporting is considered a mainstream practice (EY, 2014). According to EY (2014) neglecting to report on this matter might have a negative impact on reputation, the ability to raise capital, and hence on performance. Clients/consumers is the stakeholder group which has the greatest influence on the organization’s sustainability strategy. EY (2014) also state that the core objective for sustainability reporting is to add value and to identify and diminish risks. It is important to note that sustainability reporting is performed on a voluntary basis (GRI, 2011b).
2.1.1 Political setting
Beside corporate efforts towards sustainable development, leaders in countries around the world have settled on several environmental agreements. In 2014, the European council approved a new directive (2014/95/EU) concerning non-financial reporting. It aims to improve disclosure on non-financial information such as social and environmental issues. One reason behind this directive is to facilitate for the European Union (EU) to develop and adopt measurements to enable comparison between the member states. The minimum requirement of the directive applies for public-interest entities, having more than 500 employees. In Sweden, this translates into listed companies and large companies (DS, 2014:45) which fulfils at least one of the following three requirements. For the last two years, companies need to have had more than 250 employees, more than 175 million SEK in total assets, and more than 350 million SEK in net sales. In either the management report, or in a standalone report, these companies need to disclose information needed to gain understanding of operations and the position of the company, including
environmental disclosure (SFS 1995:1554). These regulations were enforced on January 1, 2017 (DS, 2014:45).
In 2015, the United Nations (UN) approved the 2030 agenda for sustainable development. Included in this resolution is 17 global goals which shall aid countries towards sustainable development and improve lives of people around the world. The goals include matters as ending poverty and the reduction of inequality, and all goals are made up of several components, which should be met to complete the goals. Amongst the 17 goals, four goals are dedicated to the environment (UN, 2015). In Sweden, the Swedish Environmental Protection Agency are responsible for the fulfilment of the four environmental goals (Miljömål, 2016). On a national level, this translates into seven goals; reduced climate impact, clean air, only natural acidification, a protective ozone layer, thriving wetlands, a magnificent mountain landscape, and a rich diversity of plant and animal life (Naturvårdsverket, 2016; SEPA, 2016). Due to the political efforts to mitigate climate change, companies listed in Sweden constitutes an interesting sample.
There is a predominant perception on humanities impact on, and contribution to, climate change (UN, 2014). The UN has taken initiatives to mitigate the effects and to tackle climate change. In 2016, 194 states in the UN agreed on the Paris agreement. Despite 194 signatures the agreement is so far only legally binding in 132 states, where Sweden is one of them (UNTC, 2017). The aim of the Paris agreement is to not allow the global temperature to rise above 2 degrees Celsius during this century, but preferably be limited to 1.5 degrees Celsius. To fulfil the goals in the agreement, countries are to develop individual action plans to mitigate climate change, and these plans need to be submitted and implemented (UN, 2016). In Sweden, the government strives to engage in dialogue and transmit awareness to reduce emissions and mitigate climate change, both in the EU and internationally. Nationally, the government seek to reduce emissions by 40 per cent by 2020 (Ministry of the Environment and Energy, 2015). In the beginning of the year 2017 the Swedish Government proposed a climate policy which will make Sweden fossil free by 2045. The policy has yet to be approved by the Riksdag, but it is an important factor for Sweden’s fulfilment of the Paris agreement (Regeringskansliet, 2017). Companies are an important part for fulfilment of the environmental goals.
Environmental disclosure is an important tool for increasing transparency and environmental awareness.
2.2 Environmental disclosure
Environmental reporting can be a means for management to provide stakeholders with fair information about corporate environmental activities and performance, while also contributing to attain environmental legitimacy through impression management (Cormier & Magnan, 2015). Clarkson, Li, Richardson and Vasvari (2011) found a correlation between environmental performance and financial performance in a study among high polluting firms. When the environmental performance increased, the financial performance tended to follow. The same applied when environmental performance decreased. Other researchers have investigated the effect of environmental disclosure in relation to financial incentives. Several financial benefits have been associated with environmental disclosure by corporations. For example, it can reduce the cost of capital by providing the market with additional information which reduces information asymmetries (Clarkson, Fang, Li & Richardson, 2013).
Voluntary environmental disclosure can also lead to future competitive advantage (Clarkson, Fang, Li & Richardson, 2013). The additional information given through environmental disclosures has been shown to improve analysts’ ability to make forecasts (Cormier & Magnan, 2015). Voluntary environmental disclosure by corporations increase stock price by aiding investors to predict future financial performance of the corporation, given the information is viewed as credible (Clarkson, et al., 2013). However, research on financial incentives due to environmental disclosure contain inconsistencies as Qiu, Shaukat and Tharyan (2014) found no correlation between environmental disclosure and firm value.
Factors influencing sustainability reporting are firm size (Fifka, 2013; Gamerschlag, Möller & Verbeeten, 2011; Tagesson, Blank, Broberg & Collin, 2009), managerial attitudes (Fifka, 2013), profitability (Tagesson et al., 2009) and industry (Fifka, 2013; Tagesson et al., 2009). For example, industries like banking and telecommunications overall report less (Kolk, Walhain & Van De Wateringen, 2001) and companies within the raw material industry report on environmental issues to a greater extent than consumer
goods companies, which tend to engage in social disclosure (Tagesson et al., 2009). Thus, it is compelling for the authors of this thesis to measure difference between reporting in various sectors. Highly visible companies (Dawkins & Fraas, 2011; Gamerschlag et al., 2011) with a dispersed ownership structure has been shown to increase voluntary disclosure (Gamerschlag et al., 2011; Tagesson et al., 2009). As these characteristics apply to listed companies, the companies included in this sample can be assumed to increasingly engage in environmental disclosure.
Sweden is a pioneer within sustainability (The Swedish institute, 2013). Research has found country of origin to be an important factor which influences environmental reporting (e.g. Kolk et al., 2001). This suggests that Swedish corporations disclose environmental information to a great extent. Yet, evidence has shown that disclosing sustainability information, including environmental disclosure, has a negative impact on investors’ valuation of Swedish companies’ value (Miralles-Quiros, Miralles-Quiros & Arraiano, 2017). This is in line with the findings of Hassel, Nilsson and Nyquist (2005) who argue there to be a negative relation between market value of equity and environmental performance. Three possible explanations for this relation was given in their study. As investors tend to be short-term oriented they might not appreciate the long-term commitment of environmental efforts, or the investors might see the efforts on environmental performance as costs which generate losses in potential profits. The last explanation stated by Hassel et al. (2005) was that investors might see environmental information as a way to portray the company in a better way.
Patten (2002) tested if environmental disclosure was associated with environmental performance. He found a correlation between high levels of emissions and high levels of environmental disclosure. More recent research has confirmed this correlation between environmental performance and environmental disclosure (Clarkson, Overell & Chapple, 2011). The relationship between poor performers and disclosure seem to indicate legitimacy as motivation for reporting. Indeed, when comparing environmental disclosure of corporations over the last three decades, disclosure still seem meant to create legitimacy for the corporation (Cho, Michelon, Patten, & Roberts, 2015).
2.3 Legitimacy theory
The effects of climate change are becoming more visible and acknowledged. An increasing number of companies are striving towards sustainability and are communicating this through sustainability reports (GRI, 2015). Corporations may have several motivations for social and environmental reporting and legitimising of corporate operations appears to be one (Deegan, 2002). Hence, one common theory used when analysing environmental reporting in companies is the legitimacy theory (e.g. Cho & Patten, 2007; Kuo & Chen, 2013; Dawkins & Fraas, 2011; Clarkson, Li, Richardson & Vasvari, 2008). The definition of legitimacy used in this paper is one suggested by Suchman (1995, p. 574) who argue that “legitimacy is a generalized perception or assumption that the actions of an entity are desirable, proper, or appropriate within some socially constructed system of norms, values, beliefs, and definitions”. Corporations are dependent on the society in which they operate and therefore strives to fulfil obligations and expectations of that society (Sethi, 1975).
Good environmental performance is positively related to environmental disclosure, as disclosure in environmental reports tend to be higher for excelling performers. This points against the prediction of the legitimacy theory, which suggest that companies seek to legitimise environmental performance through environmental disclosure (Clarkson et al., 2008). Dawkins and Fraas (2011) partially confirmed these findings, as they found that companies with either good or bad environmental performance tend to engage in voluntary disclosure to a larger extent than companies with average environmental performance. They argue that bad environmental performers reactively seek to legitimise their performance through disclosure, while top performers disclose proactively as a part of strategy.
Environmental disclosure influences the perception held by stakeholder, affecting the legitimacy of the company (Cormier & Magnan, 2015). Environmental reporting practices has increased in recent years. Yet the quality of information portrayed is argued to not have been improved, indicating that these reporting practices serve a symbolic role instead of showing commitment to improve accountability (Michelon, Pilonato & Ricceri, 2015). Several studies have shown legitimacy to be a factor determining to what extent
companies report on environmental disclosure (e.g. Dawkins and Fraas, 2011).
There are differences in what corporations disclose depending on, e.g., firm size, and whether they operate in environmentally sensitive industries (ESI) or not (Cho, et al., 2015). Mining, energy, and chemicals are all examples of ESI (Derwall, Guenster, Bauer & Koedijk, 2005). Poor performers in ESI tend to report monetary disclosures, as expected expenditure for pollution control, than their counterparts in non-ESI. Poor performers in non-ESI tend to disclose non-monetary information, like statements of compliance with regulations (Cho & Patten, 2007). This is supported by findings that by releasing reports on CSR containing environmental information companies in ESI can attain environmental legitimacy (Kuo & Chen, 2013). Yet the same study (Kuo & Chen, 2013) also shows that companies with already high environmental legitimacy increase the disclosure of environmental information thus increasing their legitimacy even further, contradicting the fact that only poor environmental performers disclose high levels of mainly environmental information. Therefore, this present thesis will utilise the legitimacy theory as a tool to provide explanations for reporting patterns.
2.4 The Global Reporting Initiative
A globally used sustainability reporting framework creates a common language for organisations around the world, enabling them to communicate their economic, social, and environmental impact (GRI, 2016a). The GRI is a global network-based organisation with participants from business, academia, labour, civil society, and other professional institutions (Lynch, Lunch & Casten, 2014). GRI was founded in Boston 1997 (GRI, 2008) and have been a pioneer in the field of sustainability reporting ever since (GRI, 2016a). They are an independent international organisation aiming to develop an understanding of the impact of business on critical issues as climate change, corruptions, and human rights (GRI, 2015). Issuing the first guidelines in 2000 (GRI, 2008), GRI provide a framework on principles, voluntary disclosures, and key performance indicators to guide companies’ sustainability reporting (Lynch, Lunch & Casten, 2014). The guidelines have been found to be “the most popular voluntary reporting guideline worldwide [...]” (KPMG, 2015, p. 5) and is today used by thousands of organisations in over 90 countries (GRI, 2016b). The guidelines offered on sustainability reporting are the most recognised standard globally (Skouloudis, Evangelinos & Kourmousis, 2009),
which facilitates access and comparison of information for stakeholders worldwide (GRI, 2015).
GRI builds on the principles of the TBL, and uses several indicators to measure performance on sustainability on the three aspects (Lamberton, 2005). The framework builds on three categories; environmental, economic, and social. Each of the three categories contain different aspects, which in turn contain different indicators, e.g. GHG emissions, on which performance is evaluated. From these categories companies can develop sustainability reports helping them to communicate strategies on sustainability, while also offering a way to measure the impact of organisational activities. Important aspects to consider when providing an unbiased and fair view of the report are; comparability, accuracy, timeliness, clarity, and reliability of information, and a fair balance between positive and negative aspects. This ensures transparency and the quality of the report which is important for stakeholders to be able to make an accurate and sound assessment of the organization.When preparing a sustainability report, the objective is to find material aspects in order to display organisational impact. Material aspects are significant economic, social, and environmental impacts that influence the decisions and assessments of stakeholders (GRI, 2015).
A study based on selected countries within the EU showed most sustainability reports in the EU to be produced by large listed corporations. However, Sweden is prominent with reports produced also by small and medium companies and 91% of them in accordance with the GRI guidelines (Hąbek & Wolniak, 2016). In a study based on Swedish companies, the implementation of the GRI guidelines was shown to enhance internal communications for certain companies. Further, companies explained the choice of reporting according to the GRI framework as one powered by the belief that this would increase the credibility of the report (Hedberg & Malmborg, 2003). Analysing Spanish companies from four different sectors, Gallego (2006) observed differences between reported environmental indicators amongst the companies and sectors. Environmental indicators on water sources and related ecosystems, and annual withdrawal of ground and surface water were not reported by any of the companies in the sample. Further, Gallego (2006) found frequent reporting on indicators as biodiversity by companies in the water and energy sector, while seldom reported in the finance and insurance sector. Roca and
Searcy (2012) conducted a similar study on Canadian corporations. They found that the level of reporting varied between, and within, sectors. Among the mostly reported indicators found in the study was indicators on energy, emissions, water, and compliance (Roca & Searcy, 2012). As previous research displays differences in reported indicators, this present study will measure the use of environmental indicators among large companies listed in Sweden, and contribute to the body of research on environmental indicators.
One critique of the GRI framework is that instead of changing the mindset of a company, it is only indicators that needs to be reported on as an administrative process (Moneva et al., 2006). Furthermore, Milne and Gray (2013) question the fact that the TBL, which is the foundation of GRI, has any genuine influence on the way businesses behave. Michelon et al. (2015) also found that the quality of information disclosed does not naturally improve when companies are reporting according to the GRI framework. 2.4.1 G3
With the aim to further improve transparency and the work towards increased sustainable development the third version (G3) of the GRI guidelines was released in 2006. Utilising TBL, the base of the guidelines stems from three categories, economic, environmental, and social. The economic category is concerned with the economic impact made by the company at a local-, national-, and global level. The next category, environmental, contains nine aspects; materials, energy, water, biodiversity, products and services, compliance, transport, emissions and effluents and waste, and overall. It is concerned with the impact the organisation has on natural systems throughout the organisational cycle of, e.g., buying materials and producing output (e.g. emissions, effluents, and waste). Between the nine aspects there are 30 indicators which are used to measure and assess organisational performance on the specific issue. The social category of the G3 guidelines is concerned with labour practices and decent work, human rights, society, and product responsibility (GRI, 2006).
When an organisation applies the G3 guidelines, the level of application needs to be declared. In order to satisfy the needs of everyone from beginners to advanced users, the guidelines have a three-level system (GRI, 2006). In 2011, an updated version of the G3
or environmental category, but some changes had been made in the social category, e.g. the inclusion of suppliers’ practices in certain assessments (GRI, 2011a).
2.4.2 G4
In 2015, a new version of the guidelines was launched. The aim of the fourth edition (G4) of the GRI guidelines was to support reporters when preparing sustainability reports that matters and to make sustainability reporting an established practise that provides valuable information about the most critical issue within the organisation. Like the G3 guidelines, it contains three categories building on the three principles of TBL. The new version of the environmental category contains three additional aspects. The aspect emissions, effluents and waste has been split into two aspects as emissions is now a separate aspect. The other added aspects are supplier environmental assessment, and environmental grievance mechanisms. This category now covers 34 indicators (GRI, 2015).
The reports can be labelled referenced or citing GRI. A report is labelled referenced when the organisation uses, and refers to, part of the GRI standards to report on sustainability. A GRI content index may or may not be included in these reports. When a report is labelled citing GRI, it references the guidelines used, but no GRI content index is included in the report (GRI, personal communication, March 24, 2017).
3. Method
_____________________________________________________________________________________
In this chapter, the reader will be informed on the research approach used in this thesis, and its implication for the chosen research strategy. It provides information about the sample selection, as well as the data collection. Furthermore, the reader will be informed of how the data was processed and analysed, and how replicability and validity has been assured. Lastly, the reader will be presented with a critical reflection from the authors. ______________________________________________________________________
3.1 Research approach
Ontology is concerned with the way entities are perceived; if they are entities existing regardless of external factors, or if they exist only through the construction of external perceptions. The first viewpoint is known as objectivism and the second is known as constructivism (Bryman & Bell, 2015). This thesis utilises an objectivistic ontology. The choice of ontological perspective has implications for the research epistemology. Epistemology deals with what is to be viewed as knowledge. As an effect of the objectivistic starting point, the epistemological position in this study will be positivism (Bryman & Bell, 2015). According to Howe (1988), positivism is characterised by scientific knowledge which must be based on pure observations without individual interests or values. It assumes the independent existence of reality which is to be measured through objective methods (Easterby-Smith, Thorpe & Jackson, 2008). To ensure objectivity in this study, data will be collected and analysed in a consistent manner to avoid biased information. The research question has been developed from a foundation of existing research on environmental disclosure and the legitimacy theory. Thus, this study will use a deductive research approach. A deductive research approach starts from existing theory in a field, which is used to develop research questions. These questions are then tested through data collection and empirical analysis (Bryman & Bell, 2015).
3.2 Research strategy
A research strategy provides direction when conducting research. Commonly associated with a deductive research approach is a quantitative research strategy. It focuses on quantification in the process of collecting and analysing data. This is different from the qualitative research strategy, which instead focuses on words (Bryman & Bell, 2015). This thesis will utilise a combination of a qualitative and a quantitative research strategy.
The indicators, i.e. words in text, will be analysed. Then the collected data needs to be quantified to find patterns and to answer the research question, making a mixed research strategy the most appropriate alternative.
To fulfil the research strategy content analysis will be used. “Content analysis is a research technique for the objective, systematic, and quantitative description of the manifest content of communication” (Berelson, 1952, p. 18). This method has been used in several studies concerning voluntary environmental disclosure (e.g., Gamerschlag et al., 2011; Roca & Searcy, 2012). Through content analysis collected data is systematically analysed. It is an objective and transparent approach which reduces biases of the researcher, as the selection of a sample and codification of data is clear. The transparency and objectiveness also ensures the study to be replicable. Content analysis is suitable for this study as it is commonly used for studies measuring changes over time (Bryman & Bell, 2015). The G4 environmental index provided by the GRI will be used as a basis for the content analysis. The use of a wildly recognised reporting framework will generate a replicable and unbiased analysis.
3.3 Sample
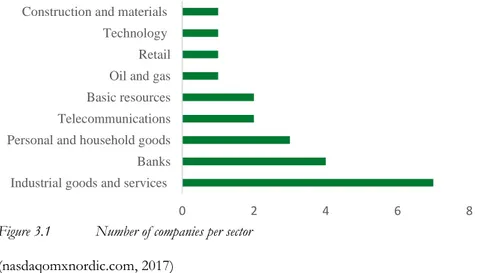
The basis for the sample used in this study will be the companies included in the OMXS30, per 2017-03-16. Further, this is limited to those companies which have a sustainability report available on the GRI sustainability data base per 2017-03-16. To detect patterns and changes over time a five-year period, year 2011 to year 2015, is chosen. Year 2016 is not included as there are not enough sustainability reports published, as only two reports was published by 2017-03-16. The sample used is not limited to a specific industry, which provides a good overview of the reporting practices in Sweden. Nine different sectors, containing 22 companies, are included in the sample (figure 3.1). The companies included in the sample must apply the GRI guidelines, either G3, G3.1, or G4, for at least one of the years included in this study. When a GRI content index is found in a referenced report this will be included in the sample.
Figure 3.1 Number of companies per sector
(nasdaqomxnordic.com, 2017)
3.4 Data collection
Two types of data can be used when conducting research; primary and secondary data. Primary data is data that is collected by the researcher, e.g. through interviews. Secondary data is already existing data, e.g. in a database. Primary data might provide a more suitable basis for the particular study. Yet this approach can prove costly, and it requires a lot of time and effort. Using secondary data, the researcher has no control over the data collected or the quality of that data. In contrast to primary data, secondary data is less costly and collection requires less time and effort (Easterby-Smith, et al., 2008). Moreover, secondary data has higher availability than primary data (Cowton, 1998). This thesis will use secondary data consisting of GRI reports derived from the GRI sustainability database. This type of data was chosen as it was the most suitable to answer the research questions. In some instances, the reports published on the GRI sustainability database referred to another report, mostly a sustainability report, or information on their web page. The information which is to be analysed is gathered from the GRI content index provided by each company. Through this index, the companies display the indicators they have reported on, and the level of compliance; full, partial, or none.
Like Gamerschlag et al. (2011) this study will use a third-party approach. This means that the authors of this thesis are not the provider, nor the intended receiver of the data. Thus, it is important to understand the secondary data that is being used, and to make sure it is suitable to the research objective (Cowton, 1998). The sustainability reports are publicly available for the market and are constructed following a widely recognised framework,
0 2 4 6 8
Industrial goods and services Banks Personal and household goods Telecommunications Basic resources Oil and gas Retail Technology Construction and materials
which can be assumed to increase the credibility of the data. The information derived through the GRI database constitutes the main source of data for this study.
3.5 Disclosure index
As a basis for the content analysis a disclosure index, derived from the GRI G4 guidelines, will be used. The environmental part of the guidelines comprises of 34 indicators, ranging from EN1 to EN34, see table 3.2. The content of the index has not been changed for this thesis, which entails an objective analysis of the data. As the indicators has not been changed for this study, it is possible to replicate it.
G3.1 G4 G3.1 G4
EN1 G4-EN1 EN17 G4-EN17
EN2 G4-EN2 G4-EN18
EN3 G4-EN3 EN18 G4-EN19
EN4 G4-EN3 EN19 G4-EN20
G4-EN4 EN20 G4-EN21
G4-EN5 EN21 G4-EN22
EN5 G4-EN6 EN22 G4-EN23
EN6 G4-EN7 EN23 G4-EN24
EN7 G4-EN6 EN24 G4-EN25
EN8 G4-EN8 EN25 G4-EN26
EN9 G4-EN9 EN26 G4-EN27
EN10 G4-EN10 EN27 G4-EN28 EN11 G4-EN11 EN28 G4-EN29 EN12 G4-EN12 EN29 G4-EN30 EN13 G4-EN13 EN30 G4-EN31
EN14 G4-EN32
EN15 G4-EN14 G4-EN33
EN16 G4-EN15, G4-EN16 G4-EN34
Table 3.1 Conversion table (GRI, 2013)
No change to standard disclosure New standard disclosure
Data points added to standard disclosure Content in standard disclosure has been reduced Content from standard disclosure has moved to guidance
To analyse the data through content analysis, a coding schedule need to be produced. A coding schedule represents a template into which collected data is recorded (Bryman & Bell, 2015). Three levels of reporting will be used for coding; fully reported (1), partially reported (0.5), and not reported (0). Between the years relevant to this study, year 2011 to year 2015, it was possible for companies to adopt either the G3, G3.1, or G4 versions of the guidelines. Thus, a conversion table is needed, as the different versions of the guidelines entails differences in which indicators are reported. No changes were made to the environmental category between G3 and G3.1 (GRI, 2011a), therefore the conversion table will only display differences between G3.1 and G4, see table 3.1. Hence, for the years a company applies G3 or G3.1, it will score zero on the additional indicators added in the G4 version. The conversion table displays changes made through colours. It also displays how indicators reported under G3.1 are translated to the G4 disclosure index. The conversion table was constructed by the GRI; hence it is assumed to be reliable and enhances replicability of this study. The use of the conversion table is crucial for this thesis, as the companies studied applies different version of the guidelines. Without this table, a fair result could not be possible.
G4 Disclosure Index Materials
EN1 Materials used by weight or volume
EN2 Percentage of materials used that are recycled input materials
Energy
EN3 Energy consumption within the organisation
EN4 Energy consumption outside of the organisation
EN5 Energy intensity
EN6 Reduction of energy consumption
EN7 Reduction in energy requirements of products and services
Water
EN8 Total water withdrawal by source
EN9 Water sources significantly affected by withdrawal of water
EN10 Percentage of total volume of water recycled and reused
Biodiversity
EN11 Operational sites owned, leased, managed in, or adjacent to, protected areas and areas of high biodiversity value outside protected areas
EN12 Description of significant impact of activities, products, and services on biodiversity in protected areas of high biodiversity value outside protected areas
EN13 Habitats protected or restored
EN14 Total number of IUCN Red List species and national conservation list species with habitats affected by operations, by level of extinction risk
Emissions
EN15 Direct greenhouse gas (GHG) emissions (Scope 1)
EN16 Energy indirect greenhouse gas (GHG) emissions (Scope 2)
EN17 Other indirect greenhouse gas (GHG) emissions (Scope 3)
EN18 Greenhouse gas (GHG) emissions intensity
EN19 Reduction of greenhouse gas (GHG) emissions
EN20 Emission of ozone-depleting substances (ODS)
EN21 NOx, SOx, and other significant air emissions
Effluents and waste
EN22 Total water discharge by quality and destination
EN23 Total weight of waste by type and disposal method
EN24 Total number and volume of significant spills
EN25 Weight of transported, imported, exported, or treated waste deemed hazardous under the terms of the Basel Convention 2 annex I, II, III, and V, VI, VII, VIII and percentage
of transported waste shipped internationally
EN26 Identity, size, protected status, and biodiversity value of water bodies and related habitats significantly affected by the organisations discharge of water and runoff
Products and services
EN 27 Extent of impact mitigation of environmental impacts of products and services
EN28 Percentage of products sold and their packaging materials that are reclaimed by category
Compliance
EN29 Monetary value of significant fines and total number of non-monetary sanctions for non-compliance with environmental laws and regulations
Transport
EN30 Significant environmental impacts of transporting products and other goods and materials for the organisations operations, and transporting members of the workforce
Overall
EN31 Total environmental protection expenditures and investments by type
Supplier environmental assessment
EN32 Percentage of new suppliers that were screened using environmental criteria
EN33 Significant actual and potential negative environmental impacts in the supply chain and actions taken
Environmental grievance mechanisms
EN34 Number of grievances about environmental impact field, addressed, and resolved through formal grievance mechanisms
Table 3.2 G4 Disclosure index
(GRI, 2015)
3.6 Data analysis
As mentioned, this study will analyse data through content analysis. Through content analysis data, or content, is quantified in a systematic and thus replicable manner (Bryman & Bell, 2015). Data was collected from the companies’ sustainability or annual reports available through the GRI sustainability database. In some instances, a report was not registered on the database, even though the company was. In those instances, the report which contains a GRI table is downloaded from the company’s web page for analysis. Companies complying with GRI provide a GRI index in their report. In some cases, this table is published on the company web page. The table gives a clear overview of the reported indicators and if the company has fully, partially, or not reported on an indicator. When a company states that they fully report on an indicator they will receive the score 1 in the coding schedule on the corresponding indicator. In some cases, a sustainability or annual report might not be available for all the five years. These are coded n/a in the coding schedule, see for example Lundin Petroleum 2011-2014 in appendix 1. The authors of thesis have chosen to include these companies in the study as this provides a
greater sample and a better representation of different sectors. To get a fair result the conversion table was used as different versions of the guidelines are included in the study. As G4 includes new indicators, and companies not reporting according to G4 will score zero on these indicators, the overall level of reporting over time for these companies will be affected. When presenting the empirical findings, the name of the indicator will be included the first time the indicator is mentioned. For further clarity, the name of the indicator will be repeated in chapter six.
The data from the five years will be collected in a consistent manner over the course of this study, and it will not be amended. This study only aims to check whether indicators are reported. In some cases, it was necessary to analyse and interpret parts of texts which is believed to have a similar meaning as the content reported by indicators. This was only done for companies complying with the GRI, and for whom a content index could not be found on the website or in the report. This will ensure an objective analysis. Further, the analysis will be conducted using the existing research and theories presented in the frame of reference, as well as the GRI guidelines.
For a study to be reliable it needs to be replicable and valid. There are three aspects of reliability; replicability, stability, and accuracy. A replicable study is characterised by explicit rules which are applied uniformly through the analysis, ensuring that the study can be replicated (Krippendorff, 2013). By using the GRI G4 disclosure index as the basis for the content analysis, and collecting data through a publicly available database this study is replicable. For data to be reliable it should mean the same thing when assessed by different actors (Krippendorff, 2013). The data used in this study is obtained from sustainability reports conducted with reference to the GRI guidelines. This assure the data to have the same meaning independent of the observer. The data also need to be constant despite of the measuring process (Krippendorff, 2013). The data used is collected through reports which contain the same information, i.e. constant, regardless of the use of measurement. As the process of collecting data is the same for all the five years, the study fulfils the stability aspect. Accuracy means the level that the chosen measurement measures the studied variable (Krippendorff, 2013). This study aims to measure the use of environmental indicators reported by companies listed on the OMXS30. To do this, a disclosure index derived from the G4 guidelines will be used. As the measurement, i.e.
the disclosure index, stems from the organisation which issues the indicators which are to be measured, the measurement can be said to be accurate.
Validity assumes reliability, but reliability does not assure validity. Valid results are obtained through the process of sampling and analysing data that satisfy external criteria. A measurement is valid when it measures what it is supposed to measure (Krippendorff, 2013). As the disclosure index measures the use of environmental indicator, and is based on these indicators, it is a valid measurement. It is important to note that the sustainability reports are voluntary and not externally assured (GRI, 2015). This means that the information is not as credible as mandatory financial information published by companies. However, the sustainability reports are conducted with reference to the GRI guidelines, indicating that the information is trustworthy.
3.7 Critical reflection
The data in this thesis originates from secondary sources. Despite the advantages, e.g. availability and cost, there are some concerns that needs to be dealt with. Implicit in the definition of secondary data, it is not prepared solely for the purpose for this thesis. It is therefore important to assess the relevance of the data in relation to the present study. To diminish this misfit of data and research question, the GRI disclosure index was used to measure the data which is obtained from the GRI sustainability database. This ensures that the right variables are measured.
One issue arises due to the translation of G3 and G3.1 reports to G4 reports. To mitigate the risk of misinterpretations a conversion table is used. The analysing process is carefully conducted to obtain valid and replicable results. Further, the guidelines are not mandatory and the produced reports does not have to be externally assured. This might lead companies to only disclose information which they see fit, or does not show the full extent of the environmental impact from their operations. The fact that the studied reports are not externally assured increases the risk of errors in the collected data. However, the information is publicly available which allows different stakeholder groups to scrutinise the content of the reports.
9 6 19 3 13 12 5 12 4 5 4 2 2 1 19 21 13 13 9 4 10 8 12 7 0 0 10 1 10 5 1 11 3 4 G4 - EN1 G4 - EN2 G4 - EN3 G4 - EN4 G4 - EN5 G4 - EN6 G4 - EN7 G4 - EN8 G4 - EN9 G4 - EN10 G4 - EN11 G4 - EN12 G4 - EN13 G4 - EN14 G4 - EN15 G4 - EN16 G4 - EN17 G4 - EN18 G4 - EN19 G4 - EN20 G4 - EN21 G4 - EN22 G4 - EN23 G4 - EN24 G4 - EN25 G4 - EN26 G4 - EN27 G4 - EN28 G4 - EN29 G4 - EN30 G4 - EN31 G4 - EN32 G4 - EN33 G4 - EN34
Score per indicator in 2015
4. Empirical findings
_____________________________________________________________________________________
The purpose of this chapter is to provide the reader with the empirical findings of this study. Firstly, the reader will be provided with data on the mostly reported indicators in 2015, then changes over five years. Secondly, the reader will be presented with data concerning differences in reporting between different sectors. Firstly, in 2015, followed by the change over five years.
______________________________________________________________________
4.1 Environmental disclosure in 2015
From the data collected through the coding schedule, the reporting frequency of indicators can be found. An indicator receives a score of 1 regardless of it has received 1 or 0.5 when the level of reporting was determined. If a company has not reported on an indicator, this generates a frequency score of 0. The study includes 22 companies, making 22 the maximum score for each indicator.
Figure 4.1 shows the score each indicator received in 2015, when data from all companies was compiled. The indicator with the highest score was EN16 “energy indirect GHG emissions”, followed by EN3 “energy consumption within the organisation”, and EN15 “direct GHG emissions”. These three indicators scored 21, 19 and 19 respectively, and are the most popular ones. EN5 “energy intensity”, EN17 “other indirect GHG emissions”, and EN18 “GHG emissions intensity” share place as third mostly reported, scoring 13. They are closely followed by EN6 “reduction of energy consumption”, EN8 “total water withdrawal by source”, and EN23 “total weight of waste by type and disposal method”, which scored 12. EN32 “percentage of new suppliers that were screened using environmental criteria” was the fifth mostly reported indicator, with a score of 11.
Four of the most reported indicators, EN15, EN16, EN17, and EN18, belong to the emissions aspect, which contain seven indicators. Also, the other indicators in this aspect have received a relatively high frequency score, and the aspect is the most commonly reported on in 2015. Further, the energy aspect has three indicators among the top score. As can be seen in table 4.1 it is the second most common aspect on which companies report on. In table 4.1 the average score of the aspects are calculated through compiling the total score of the indicators in an aspect divided by the number of indicators. The third largest aspect is compliance, which receives a total score of 10. Yet, this aspect only contains one indicator EN29 “monetary value of significant fines and total number of non-monetary sanctions for non-compliance with environmental laws and regulations”, which hinders the total score from being affected by relatively low scores of indicators in the aspect. The fourth largest aspect is materials. This aspect requires companies to report on the amount of materials used and to which extent they use recycled materials.
Aspect Materials Energy Water Biodiversity Emissions Effluents and waste Frequency score 7.50 10.40 7 2.25 12.71 5.40 Aspect Products
and services Compliance Transport Overall
Supplier environmental assessment Environmental Grievance Mechanisms Frequency score 5.50 10 5 1 7 4
20 17 18 20 17 18 G4 - EN3 G4 - EN6 G4 - EN15 G4 - EN16 G4 - EN19 G4 - EN23
Top three reported indicators in 2012 18 17 19 G4 - EN3 G4 - EN15 G4 - EN16
Top three reported indicators in 2011
4.1.1 Change over five years
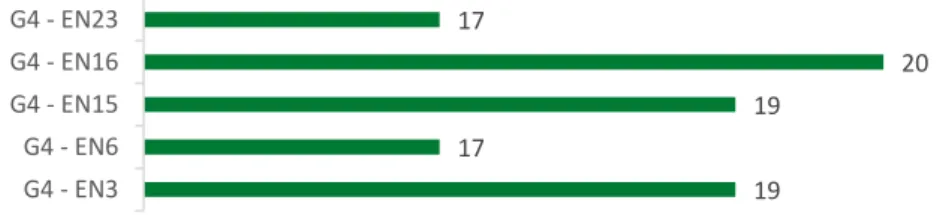
For measuring the change over time, the top three of the mostly reported indicator per year have been chosen for further investigation. For all years included in this study, the most commonly reported indicator is EN16, followed by EN15 and EN3. In 2011 EN3 was the second most reported indicator, and EN15 was third, see figure 4.2.
Figure 4.2 Top three reported indicators in 2011
In 2012 EN3 was reported as many times as EN16, see figure 4.3. EN23 share the second place together with EN15, while EN6 and EN19 “reduction of GHG emissions” are the third mostly reported indicators.
Figure 4.3 Top three reported indicators in 2012
In 2013 EN16 was the most reported indicator, followed by EN15 and EN3. EN23 scored together with EN6 a third place, as shown in figure 4.4.
Figure 4.4 Top three reported indicators in 2013
19 17 19 20 17 G4 - EN3 G4 - EN6 G4 - EN15 G4 - EN16 G4 - EN23
In 2014, EN16 was again the most reported indicator, closely followed by EN15 and EN3. The third mostly reported indicator was EN23, see figure 4.5. This means it is more commonly reported on compared to 2015 where it only was among the fourth mostly reported indicators.
Figure 4.5 Top three reported indicators in 2014
Two of the mostly reported indicators, EN15 and EN16, belong to the aspect emissions. This aspect has been the one which is mostly reported on in 2015, see table 4.1. This finding is also consistent with the reporting pattern for the earlier years included in this study. In connection with the release of the G4 guidelines a new indicator was added to the emissions aspect, namely EN18. With the first company reporting on G4 and EN18 2013, the indicator has increased in popularity. It was reported on one time in 2013, and 13 times in 2015. This is in line with the overall pattern for the emissions aspect.
One of the smallest aspect in relation to number of indicators is transport. This aspect was fairly popular between 2011 and 2013, but decreased in usage over the last two years. Few companies in the sample tend to report on the aspect biodiversity over the five years. In 2015, the aspect scored an average of 2.25 (table 4.1). The aspect was somewhat more reported on in the first years included in this study, but is still one of the aspect with the lowest numbers of reporters compared to the other aspects in the GRI framework. The only category receiving less attention than biodiversity is the aspect overall. This aspect contains one indicator and advises companies to disclose environmental protection expenditures and investments. Only one company reported on the indicator in 2015, which is a decrease from three in 2011.
19 19 21 17 G4 - EN3 G4 - EN15 G4 - EN16 G4 - EN23
4.2 Environmental disclosure by sectors in 2015
The largest sector, industrial goods and services, correspond with the result in the previous section; the mostly reported indicators are EN3, EN15, and EN16. For the banking sector, the top three indicators were EN3, EN16, and EN17. The third largest sector, personal and household goods, report most on indicator EN3, EN15, and EN16. Further EN8 and EN23 are commonly reported on in 2015. The sectors telecommunications and basic resources both only contain two companies each, and the most common indicators in both sectors are EN3, EN15, and EN16. Furthermore, in basic resources the indicators EN1, EN2, EN6, EN8, EN19, EN21 “NOx, SOx, and other
significant air emissions”, and EN23 have all been reported on by both companies in 2015.
In 2015, the sector construction and materials has reported according to the GRI to the greatest extent, see figure 4.6. Total score per sector is calculated as the accumulated score per sector divided by the number of companies in that sector, see appendix 2. For all previous years, the technology sector has contained the most frequent reporters. The largest sectors included in this sample is industrial goods and services, banks, and personal and household goods. In 2015, banking is the sector with the lowest level of reporting. The other two sectors produced about the same score, placing them in the middle of the reporters. The sectors that have the highest score for 2015 are sectors containing maximum two companies.
The year 2015 was the first year the oil and gas sector reported according to the GRI guidelines. In the first year of reporting they were fourth best and received a score of 14. The level of frequency of reporting in the retail sector was consistent with the previous year. The sector is the third worst in terms of reporting, with a score of 12 (appendix 2).
Figure 4.6 Total score per sector
4.2.1 Change over five years
EN3, EN15, EN16 have been consistently reported on over five years in the industrial goods and services sector. Further, for this sector reporting on all indicators in the aspect biodiversity has decreased from three to one. For the banking sector EN3, EN16, and EN17 have been the most consistently reported over time. EN7 “reduction in energy requirement of products and services” has decreased from a score of four out of four in 2012, to zero in 2015. EN27 “extent of impact mitigation of environmental impacts of products and services”, and EN30 “significant environmental impacts of transporting products and other goods and materials for the organisations operations, and transporting members of the workforce” has decreased in reporting, from three in 2011 to zero in 2015.
Consistent with previous results, EN3, EN15, and EN16 are the most commonly reported indicators in the sector personal and household goods. Together with EN8 and EN23, all these indicators were reported on by all companies in the sector over five years. The only
0 5 10 15 20 25
Total score per sector