Service quality and values
as antecedents of
spectators’ intention to
attend a sport event
MASTER PROJECT
THESIS WITHIN: International Marketing NUMBER OF CREDITS: 15 ECTS
PROGRAMME OF STUDY: International Marketing AUTHOR: Cajsa Granlund & Ramona Gruber JÖNKÖPING May 2020
i
Master Thesis in Business Administration
Title: Service quality and values as antecedents of spectators’ intention to attend a sport event: The case of Vasaloppet
Authors: Cajsa Granlund & Ramona Gruber Tutor: AFM Jalal Ahamed, Ph.D.
Date: 2020-05-18
Key terms: behavioral intention, attitude, subjective norm, service quality, hedonic value, utilitarian value, sport event marketing
Abstract
Sport event marketing is an important issue within the research area of business. The purpose of this study was to analyze how service quality, hedonic value and utilitarian value influence the spectators’ attitude and subjective norm towards the behavioral intention of visiting the cross-country skiing event Vasaloppet. The study was based on the theory of reasoned action as well as the constructs of service quality, hedonic value, and utilitarian value, which were added as antecedents. A quantitative research approach with a face-to-face survey at the event and an online questionnaire was pursued.
The findings show that in connection to the Vasaloppet event subjective norm correlates the strongest with behavioral intention compared to attitude. However, hedonic and utilitarian values have a significant correlation to attitude, but not towards subjective norm. Due to the type of event, no connections with service quality were detected. In regards of the international component there is no significant difference present between Swedish and non-Swedish spectators. Organizations can use these findings to further enhance the social aspects of visiting sport events when performing sport event marketing.
ii
Table of Contents
1.
Introduction ... 1
1.1 Background ... 1
1.2 Problem definition and purpose ... 4
1.3 Research Question ... 4
1.4 Key words ... 4
2.
Literature Review ... 5
2.1 Theory of Reasoned Action (TRA) ... 5
2.1.1 Behavioral Intention ... 7
2.1.2 Attitude ... 8
2.1.3 Subjective Norm... 8
2.2 Possible antecedents to TRA ... 9
2.2.1 Service Quality ... 11 2.2.2 Values ... 13 2.3 Conceptualization ... 14 2.3.1 Frame of reference ... 14 2.3.2 Conceptual framework ... 15
3.
Methodology ... 19
3.1 Research design ... 19 3.2 Data collection ... 203.3 Model measurement variables... 20
3.4 Sampling selection ... 22
3.5 Event description ... 23
3.6 Data analysis ... 24
3.7 Validity and Reliability ... 25
3.8 Delimitations ... 26
iii
4.
Analysis & Findings ... 27
4.1 Demographics ... 27
4.2 Outliers ... 28
4.3 Factor Analysis ... 29
4.4 Pearson Correlation ... 32
4.5 Multiple Regression Analysis ... 33
4.6 Swedish versus non-Swedish Spectators ... 35
5.
Discussion ... 38
6.
Conclusion ... 43
6.1 Managerial Implications... 43
6.2 Limitations and further research ... 44
iv
Figures
Figure 1: Theory of Reasoned Action (Fishbein & Ajzen, 1975) ... 5
Figure 2: The adapted TRA model ... 11
Figure 3: Service Quality Dimensions (Prakash & Mohanty, 2013) ... 12
Figure 4: The adapted TRA model ... 16
Figure 5: Scree Plot ... 29
Figure 6: Multiple Regression Analysis – Effects of the extended TRA on Behavioral Intention to attend Vasaloppet ... 34
Tables
Table 1: Frame of Reference ... 15Table 2: Demographic data of respondents ... 28
Table 3: Descriptive Statistics, Factor Loadings, and Item Means ... 30
Table 4: Pearson Correlation Coefficient to test the relationship among TRA and its antecedents ... 32
Table 5: Independent Sample t-test – comparing Swedish and non-Swedish spectators (items level) ... 36
Table 6: Significant results on the independent sample t-test – comparing Swedish and non-Swedish spectators (factors level) ... 37
1
1. Introduction
______________________________________________________________________ This section problematizes the question of why spectators attend sport events and introduces the extended theory of reasoned action and its antecedents: service quality, hedonic value and utilitarian value. The purpose, the research problem and the research question of the study are presented as well.
1.1 Background
The Swedish long-distance cross-country skiing race Vasaloppet is the largest skiing race worldwide. As one of the largest sport events overall, it draws approximately 15 800 participants from 46 countries and thousands of spectators from all over the world every year. But what is it that draws people out of the warm cabins into the snow to watch a cross-country skiing race?
Vasaloppet provides an opportunity to investigate the behavioral intentions of an international and diverse group of spectators. The spectators’ behavioral intention of visiting the event again in another year will be investigated by extending the theory of reasoned action with the antecedents of service quality, hedonic value and utilitarian value. It also allows making a comparison between Swedish and non-Swedish spectators. The outcome will serve as a supporting argument for sport event marketing among different nationalities.
The theory of reasoned action (TRA) (Fishbein & Ajzen, 1975) can be used as an explanatory framework to explain the relationship between attitude, subjective norm and behavioral intention. The theory suggests that attitude and subjective norm affect behavioral intention which in turn leads to the actual behavior (Fishbein & Ajzen, 1975). The predictive TRA model has been successfully applied in a multitude of different fields (Mishra, Akman, & Mishra, 2014). The model has been used to analyze consumer behavior in the context of smoking (Guo et al., 2007; Marin, Marin, Perez‐Stable, Otero‐ Sabogal, & Sabogal, 1990), drinking (D’angelo, Kerr, & Moreno, 2014; Espada, Griffin, Gonzalvez, & Orgiles, 2015), food consumption (Petrovici, Ritson, & Ness, 2004) and health (Morrison et al., 2002; Orr, Thrush, & Plaut, 2013).
2
Consumer behavior within event attendance has been investigated by a multitude of researchers as well (Horng, Su, & So, 2013; Ibrahim et al., 2015). These contributions present the successful applicability of the TRA model towards event attendance. Analysis regarding consumer behavior at sport events has been investigated by Cunningham and Kwon (2003) as well as Kaplanidou and Gibson (2012). These studies present the applicability of the model for sport events in specific.
When using TRA all individual concepts of the model need to be understood. The dependent variable, behavioral intention, is defined as the belief about the likelihood of performing a certain behavior (Madden, Ellen, & Ajzen, 1992). It captures the motivational factors that explain why a certain behavior is carried out, and how much effort people are willing to put into the behavior (Ajzen, 1991). Accordingly, behavioral intention can be used to anticipate or explain actual behavior. Furthermore, it explains the willingness and effort to take action, influenced by the two antecedents attitude and subjective norm (Eddosary, Ko, Sagas, & Kim, 2015; Lu, Lin, & Cheng, 2011).
Research has found attitude to be an important predictor of behavior (Ajzen, 1991). It refers to the degree to which a person has a favorable or unfavorable evaluation or appraisal of the behavior in question. Generally, attitude consists of three basic characteristics which are defined as: the attitude is learned, the attitude is a predisposed action and actions are consistently favorable or unfavorable (Fishbein & Ajzen, 1975). Attitude has been proven to be the most influential antecedent to behavioral intention and towards predicting future behavior (Cunningham & Kwon, 2003; Eddosary et al., 2015; Mishra et al., 2014).
Subjective norm is broadly defined as “the perceived social pressure to perform or not to perform the behavior" in question (Ajzen, 1991, p. 188). It is connected to the belief that a person wants to align with significant others and what they think about the behavior in question (Fishbein & Ajzen, 1975). Significant others are defined as family members, friends, or society at a large. There is no consensus of subjective norms’ impact on behavioral intention. Most studies find subjective norm to be a significant variable but not as predictive as attitude, whilst others find the antecedents to be equally predictive. However, Cunningham and Kwon (2003) argue that subjective norm is extra important
3
when studying sport event attendance as the influence of others is crucial when choosing whether or not to attend.
Overall, subjective norm and attitude seem to have a significant influence on customer’s behavioral intention (Li, 2012). The robustness and accuracy of TRA have been proven several times in previous research (Axelson, Brinberg, & Allen, 1986) and many extensions of this theory have been performed. As attitude and subjective norm have determinants themselves any external variables to this framework can function as antecedents (Eagly & Chaiken, 1993). Given the relevance to behavioral intention and the focus of sport events the constructs of service quality, hedonic value and utilitarian value have been chosen as antecedents to the model.
Service quality is broadly defined as “a cognitive evaluation of the performance of a service provider” (Cronin, 2003, p. 333). It has been studied in the case of sport marketing and is seen to significantly impact the perceived value of the consumers of sporting events (Yoshida, James, & Cronin Jr, 2013). To understand the concept of service quality, the term service encounter must be understood. A service encounter is the direct interaction between the service provider and the customer (Lewis, 1993). Accordingly, service quality is the match between the customers expectation and the service provided during the service encounter. It is assessed from three direct determinants: service interaction, physical outcome and service outcome (Theodorakis, Kaplanidou, & Karabaxoglou, 2015).
Value can be divided into hedonic and utilitarian value. Hedonic value refers to the potential entertaining and emotional aspects of products or goods (Babin, Darden, & Griffin, 1994). It is influenced by pleasure, fun and fantasy (Yazıcı, Koçak, & Altunsöz, 2017). In contrast, utilitarian value is the instrumental, functional and cognitive benefit received from the useful and convenient characteristics, functions and performances from goods or services (Rust, Lemon, & Zeithaml, 2004). Hedonic and utilitarian values can be applied to several aspects of consumer behavior (Ahtola, 1985). Traditionally it has been applied to attitudes (Hirschman & Holbrook, 1982). But as Ahtola (1985) mentions, this is a simplistic view of the hedonic and utilitarian perspectives which can be applied to many other aspects of consumer behavior as well.
4 1.2 Problem definition and purpose
TRA (Fishbein & Ajzen, 1975) can be used as an explanatory framework to describe the relationship between attitude, subjective norm and behavioral intention of visiting sport events again. Studies have proven hedonic and utilitarian perspectives to be useful in relation to consumption values, seen as the antecedents of attitude (Babin et al., 1994). Service quality has been seen to greatly affect overall satisfaction and behavioral intention (Xiao, Ren, Zhang, & Ketlhoafetse, 2019). However, these antecedents have not been tested in relation to TRA in combination with sport events. Thus, this study aims to contribute to the research about behavioral intention and the attendance to sport events by applying an extended version of the TRA.
The study focusses on the Swedish cross-country skiing event Vasaloppet. Due to the internationality of the event, a comparison between Swedish and non-Swedish spectators will be done in order to distinguish differences in behavioral intention stemming from cultural aspects. Accordingly, the outcome of the study will serve as a supporting argument for sport event marketing among different nationalities.
1.3 Research Question
This study aims to investigate the relationship of service quality, hedonic value and utilitarian value on attitude and subjective norm towards the behavioral intentions of sport spectators as well as compare the behavioral intention of Swedish and non-Swedish spectators towards visiting sport events. This is done through the case of the cross-country skiing race Vasaloppet. The research question is defined as:
“How do service quality, hedonic value and utilitarian value influence the spectators’ attitude and subjective norm towards the behavioral intention of visiting the event
Vasaloppet?”
1.4 Key words
Behavioral intention, attitude, subjective norm, service quality, hedonic value, utilitarian value, sport event marketing.
5
2. Literature Review
______________________________________________________________________ The purpose of this chapter is to provide the theoretical background to the theory of reasoned action and its antecedents service quality, hedonic value and utilitarian value. The topic will be conceptualized through a frame of reference and a conceptual framework.
2.1 Theory of Reasoned Action (TRA)
TRA (Fishbein & Ajzen, 1975) seeks to describe the underlying mechanism that explains why people behave the way they do. The theory suggests that attitude and subjective norm lead to behavioral intention which guides the actual behavior.
Figure 1: Theory of Reasoned Action (Fishbein & Ajzen, 1975)
The theory derives from social psychology, persuasion models and attitude theories. It was first suggested by Fishbein and Ajzen in the book “Intention and Behavior: An introduction to theory and research” in 1975. Here it was proposed that the intention to perform a behavior is the main predictor of whether the behavior will be performed or not. Later the theory of planned behavior (TPB) (Ajzen, 1980) was introduced as an extended version of TRA. In addition to subjective norm and attitude, TPB incorporates perceived behavioral control as an antecedent to behavioral intention (Fishbein & Ajzen, 1980). Several meta-analytic reviews have supported both TRA (Sheppard, Hartwick, & Warshaw, 1988) and TPB (Armitage & Conner, 2001; Godin & Kok, 1996) as effective
6
models for predicting behavior across several contexts. Previous research has found attitude and subjective norm to be more salient in predicting behavior than perceived behavioral control when studying sport spectators, due to the substantial influence of significant others (Cunningham & Kwon, 2003; Lu et al., 2011). Accordingly, TRA was chosen for this study. However, literature review was done by analyzing TPB as well due to the similarity to TRA.
Examples of contexts where TRA has been successfully applied are IT adaption (Mishra et al., 2014), food consumption (Petrovici et al., 2004) and most commonly, health behaviors (D’angelo et al., 2014; Espada et al., 2015; Guo et al., 2007). The theory has been used to a lower extent in connection to sport and event attendance. However, there are previous studies worth noting.
The TPB has been used to a greater extent than TRA in connection to sport event attendance. It has been used to study consumer’s intention to attend a sport event by investigating students intention to attend a hockey game (Cunningham & Kwon, 2003). Here it was found that attitude and subjective norm positively influence the behavioral intention of visiting the game. Together, attitude and subjective norm, were a more salient predictor of intentions to attend the game as a spectator, compared to perceived behavioral control. Cunningham and Kwon (2003) argue that this might be specific to sport spectators since the influence of peers is important when choosing whether or not to attend a sport event.
In another study TPB was used to investigate important factors of consumers’ intention to attend professional soccer events (Eddosary et al., 2015). The study measured the effect of attitude, subjective norm, perceived behavioral control and game importance on intention to attend the events. It was found that attitude and game importance had a positive impact on behavioral intention towards visiting the event. Subjective norm only had a significant impact for parts of the sample studied. However, perceived behavioral control with its dimensions time and money did not show importance overall.
In a study of the effects of a festivals impact on the support for future festivals TRA was applied (Song, Xing, & Chathoth, 2015). It was used to explain the connections between support for future festivals and the impact from past festivals. This study presents a
7
successful applicability of TRA aimed at event attendance. Here it was found that attitude is the most important variable when investigating behavioral intention.
In a study about parents’ intention to attend youth sport events the TRA was used (Kyriaki Kaplanidou & Heather J Gibson, 2012). The study aimed to understand how the overall event image impacts travelling parents´ attitude, subjective norm and behavioral intention to attend a similar sport event in the future. It was found that event image had a positive influence on attitude and subjective norm. Furthermore, it was found that attitude and subjective norm had a positive impact on behavioral intention. Thus, this study proves the TRA to be effective in explaining behavior at sport events.
In conclusion, previous research has proven TRA to be a suitable framework for predicting behavior in several contexts. It consists of the concept’s behavioral intention, attitude, and subjective norm. Accordingly, to effectively apply the framework, each of these concept’s needs to be understood properly.
2.1.1 Behavioral Intention
Behavioral intention is an important construct in TRA and it is “..assumed to capture the motivational factors that influence a behavior and to indicate how hard people are willing to try or how much effort they would exert to perform the behavior” (Ajzen, 1991, p. 181). The concept is defined as the beliefs about the likelihood of performing a certain behavior (Madden et al., 1992). Previous studies have proven behavioral intention to have a positive impact on actual behavior (Mishra et al., 2014; Morrison et al., 2002).
TRA was used in a study of green information technology acceptance where the shift towards more environmentally friendly options amongst information technology practitioners was studied (Mishra et al., 2014). Here it was found that both attitude and subjective norm had a significant impact on behavioral intention which in turn positively influences actual behavior. However, attitude had a slightly higher impact on behavioral intention compared to subjective norm.
In another study TRA was used to study children’s health issues and intention to drink alcohol (Morrison et al., 2002). Attitude, subjective norm and behavioral intention was used to predict alcohol use one year later. The findings underlined that attitude and
8
subjective norm affect the behavioral intention to drink alcohol, but attitude and subjective norm also effect the behavior of drinking alcohol directly. Thus, the connection between attitude, subjective norm, behavioral intention and actual behavior was proven. It was also found that subjective norm not only influenced behavioral intention but had a direct effect on actual behavior.
Following, attitude and subjective norm as components of TRA and important predictors of behavioral intension will be analyzed.
2.1.2 Attitude
Attitude is an important predictor of behavioral intention; it refers to the degree to which a person has a favorable or unfavorable evaluation or appraisal of the behavior in question (Ajzen, 1991). Several studies have proven attitude to be the most influential factor when predicting future behavior (Cunningham & Kwon, 2003; Eddosary et al., 2015; Mishra et al., 2014).
In a study of students intention to attend a sport event, attitude was found to be the most influential factor on behavioral intention (Eddosary et al., 2015). The results indicated that attitudes towards attending the event and the perceived game importance positively influenced the intention to attend. In fact, attitude was the most important factor of all constructs investigated. The same conclusion could be drawn in a study investigating the intention to practice green information technology where it was found that attitude had a higher impact on behavioral intention than subjective norm (Mishra et al., 2014). Accordingly, aligning results can be seen from the study of the students intention to visit a hockey game where attitude was the most influential factor (Cunningham & Kwon, 2003).
2.1.3 Subjective Norm
Alongside with attitude, subjective norm affects behavioral intention. Subjective norm is broadly defined as “the perceived social pressure to perform or not to perform the behavior in question” (Ajzen, 1991, p. 188). It is related to the normative belief that a person complies with significant others, being important persons such as family members, friends or society at a large (Fishbein & Ajzen, 1975). Subjective norm is intended to measure social influence on consumers behavior (Fishbein & Ajzen, 1975).
9
In previous research there is no consensus of to what extent subjective norm affects behavioral intention. Most studies find subjective norm to be predictive, but less predictive than attitude, in connection to behavioral intention (Eddosary et al., 2015; Godin & Kok, 1996; Mishra et al., 2014). In addition, there are studies that find subjective norm to be slightly more predictive than attitude (Gastil, 2000).
Furthermore, subjective norm seems to be an important construct in the field of sport event marketing. Subjective norm, is a salient predictor to intention (Cunningham & Kwon, 2003) due to the fact of sport spectatorship being a social function (Eddosary et al., 2015). As Cunningham and Kwon (2003) argue subjective norm is important when attending a sport event since the influence of significant others is crucial when choosing whether or not to attend such events.
2.2 Possible antecedents to TRA
As attitude and subjective norm are antecedents to behavioral intention the constructs have antecedents themselves. According to Eagly & Chaiken (1993) any external variables to the framework of TRA can be used as antecedents to attitude and subjective norm. Accordingly, studies where the TRA model has been extended by multiple antecedents depending on the topic of the research can be found. A selection of these studies has been reviewed to discover possible extensions suitable for the purpose of investigating the behavioral intention of visiting the sport event Vasaloppet.
To analyze and predict computer use Mishra et al. (2014) extended the TRA model within the research of Green Information Technology acceptance. The two constructs ‘person related beliefs’ and ‘level of awareness’ were added as well as the two factors ‘sector of respondent’ and ‘experience of respondent’. Furthermore, Petrovici et al. (2004) used TRA to gain valuable insight regarding food choice. In this study ‘habit’ was added as an extension for explaining the behavior towards food products. D’Angelo et al. (2014) investigated alcohol use in combination with Facebook posts as an omnipresent product of technology. Here, the TRA model was extended by one single component, the ‘Facebook Display’. To predict consumers attitudes and behavioral intentions toward credit card use in a developing, non-Western country, the three dimensions of materialism ‘success’, ‘centrality’ and ‘happiness’ were applied as
10
antecedents to TRA. In relationship to sport events, prior studies have analyzed event image as antecedent (Kyriaki Kaplanidou & Heather J. Gibson, 2012). A strong dependence between event image and behavioral intention was found.
Several studies have examined the construct of service quality in relation to behavioral intention. Xiao, Ren, Zhang, & Ketlhoafetse (2019) analyzed the impact of service quality on satisfaction and behavioral intention. This study was done in the case of an international marathon. The article shows not only the significance between the items, but also the difference between age groups, gender and nationalities. The findings present that service quality positively impacts the overall satisfaction of participants. Similarly, Murray & Howat (2002) analyzed the relationship of values towards service quality, satisfaction and behavioral intention. This study indicates support for service quality leading to satisfaction and further to future intensions. The important role of values when formulating satisfaction is presented as well. These positive correlations show an indication for managers to implicate a high level of service quality at sport and leisure centers. A comparable outcome was shown in the context of motor boat racing (Kim, Lee, Schoenstedt, Lee, & Kim, 2014) where a significant effect of service quality, perceived value and satisfaction was found on the behavioral intention of word-of-mouth.
A further and deeper look into behavioral intention was practiced by looking at values. The relationship between perceived quality, consumption value and behavioral intention was tested by Yoshida (2013). To do so, the utilitarian value was analyzed as monetary price and convenience. The hedonic value as entertainment and exploration. Lastly, the symbolic value was defined to investigate the higher-level need, according to Maslow’s hierarchy. Further, Yazıcı, Koçak, & Altunsöz (2017) presented the relative importance of hedonic and utilitarian value on sport events. The model used, included additionally the four E’s: education, esthetic, entertainment and escapist, to test the relationship towards satisfaction and behavioral intention. According to the previous researches mentioned and considering the relevance of behavioral intention and the focus on sport events the constructs of service quality, hedonic value and utilitarian value are chosen as antecedents to TRA in this study.
11
Service quality, as well as hedonic and utilitarian values are already proven antecedents to attitude and subjective norm (Babin et al., 1994; Xiao et al., 2019), however they have not been applied as thoroughly to sport or event attendance in combination with TRA. These concepts will be measured to investigate the effect on behavioral intention of visiting the event Vasaloppet. In order to understand each antecedent, literature on each concept has been reviewed.
Figure 2: The adapted TRA model
2.2.1 Service Quality
The judgment of the service presentation is called service quality (Cronin, 2003). It has been studied in a variety of fields. According to Lewis (1993) the term service encounter needs to be defined for a better understanding of service quality. Service encounters describe the direct interaction between the service provider and the customer. This relationship has a high effect on the overall impression as well as on the evaluation of the service quality. Service quality itself is the match between the customers’ expectations and the service provided. However, a lower satisfaction through greater expectations than the performance, does not imply a low service quality, especially since customers’ expectations are increasing due to the number of products available.
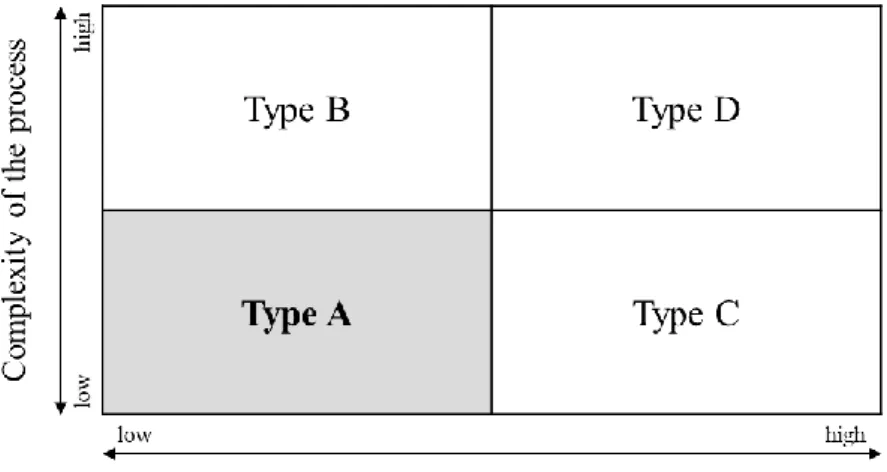
Service quality, as one of the most important elements of the management of service, can be classified by two dimensions, the ‘degree of customers involvement’ and the ‘complexity of the process’ (Prakash & Mohanty, 2013). Those dimensions lead to four types of service. Type A indicates a rather low customer involvement as well as a low
12
complexity of process, which can be seen in public transport. The classification of type B shows a high complexity of service, but a low customer involvement. A life insurance or plastic surgery can be used as an example. In contrast, a fast food restaurant shows a highly standardized process as type C, which provides a low complexity and a high involvement of the customer. Lastly, type D, such as an internet purchase, presents a high involvement as well as a high complexity. Arguably, Vasaloppet belongs to type A as it has a low customer engagement towards the service provider and the complexity of the process in not high.
Figure 3: Service Quality Dimensions (Prakash & Mohanty, 2013)
Furthermore, service quality is considered to be an important indicator for leisure consumption (Theodorakis et al., 2015). Theodorakis et al (2015) has found that the satisfaction of the event is positively influenced by experiential happiness. The same conclusion could be drawn in a study of service quality’s impact on perceived value and fan engagement, where a positive effect was seen on satisfaction of the event and experiential happiness (Jones, Byon, & Huang, 2019).
Brady & Cronin (2001) analyzed the conceptualization of service quality with a qualitative approach. In this case, service quality had three direct determinants, service interaction, physical environment and service outcome. This leads to assessing service quality on different levels, either the overall service quality or more in depth with focus on subdimensions (Theodorakis et al., 2015). The three direct determinants are composed
13
by subfactors. Interpersonal interaction is the perception of the quality during service delivery and shows the greatest effect on service quality perception. This factor can be analyzed through the attitude, behavior and/or the expertise of the service personnel. Furthermore, physical environment was studied as an influence of customers service evaluation. This factor is prominent during service delivery and shows a significant impact on service perception. Ambient conditions, facility design and social factors influence the perception of physical environment. Lastly, outcome quality describes the fulfillment of the service, which is evaluated after service delivery. Waiting time, tangibles as well as valence are considered as subfactors regarding outcome quality (Brady & Cronin, 2001). However, a difference of perception between spectators and participants of events is present at all levels (Shonk & Chelladurai, 2008). In the present study, service quality will be assessed from the three primary factors: Physical Environment, Interaction Quality and Outcome Quality.
Zeithaml, Bitner, Gremler, & Pandit (2000) are analyzing service marketing and indicate the positive customer relationship through service quality. Additionally, it was used as a construct in sport marketing and was shown to significantly impact the perceived value of the consumers of sporting events (Yoshida et al., 2013). This was also found by Kim et al. (2014), who states a statistically significant influence by service quality towards perceived values. Therefore, not only service quality was used as antecedent for the TRA in combination with sport events, but also values were further analyzed and added.
2.2.2 Values
Among researchers the interest in value is increasing due to the need of understanding consumption behavior. The service dominant economy is not only influenced by extrinsic costs, such as money, time and effort, but also by the intrinsic costs of being affective, social and expressive (Yoshida et al., 2013). Furthermore, it has been shown, that multiple consumption values are influencing behavioral intention. Those values include functional, emotional, social and epistemic values (Choe, 2018). In addition, values can be divided into hedonic and utilitarian value (Gursoy, Spangenberg, & Rutherford, 2006). Hedonic and utilitarian value can be applied to several aspects of consumer behavior (Ahtola, 1985). Traditionally they have been applied to attitudes (Hirschman & Holbrook, 1982). Ahtola (1985) even argues that attitude is a function of hedonic and utilitarian
14
values. However, he also mentions that this is a simplistic view of the hedonic and utilitarian perspectives which can be applied to areas of consumer behavior beyond attitude. This serves as an argument to apply the hedonic and utilitarian values to other aspects, such as sport events and their spectators’ intention.
The hedonic value is described as the emotional dimension, which is influenced by pleasure, fun and fantasy (Yazıcı et al., 2017). Accordingly, the hedonic aspect of an attitude towards a behavior results from entertaining and emotional feelings (Ahtola, 1985). Examples given of those feelings are love, hate, fear, joy and boredom in addition to like or dislike (Hirschman & Holbrook, 1982). In contrast, the utilitarian aspect of an attitude toward a behavior is defined as “usefulness, value, and wiseness of the behavior as perceived by the consumer” (Ahtola, 1985). It is the the functional factor which should fill a basic desire or lead to a functional goal (Yazıcı et al., 2017). Together, hedonic and utilitarian value indicate consumer value (Babin et al., 1994).
There has been proposed relationships between hedonic value, utilitarian value and future consumer decisions and evaluations of purchased products and goods (Babin et al., 1994). Research has found that hedonic and utilitarian value can be used to measure attendees’ attitudes towards events (Gursoy et al., 2006). In a study about attendance to a festival, it was found that people visit events for both hedonic and utilitarian reasons (Gursoy et al., 2006). The event provides utilitarian value by satisfying physical needs and provides hedonic value through social and personal experiences. However, hedonic attitudes have a stronger impact on peoples attendance (Gursoy et al., 2006). The same conclusion could be drawn in a study by Yazici, Koçak, and Altunsöz (2017) where the effect of experiential marketing on behavioral intentions in a festival with a sport event was measured. Here it was found that both hedonic and utilitarian attitudes positively and significantly affected behavioral intentions. However, hedonic attributes had a relatively stronger effect on participants’ satisfaction evaluations than utilitarian attributes.
2.3 Conceptualization
2.3.1 Frame of reference
The studied literature of the TRA and the chosen antecedents of service quality and values are shown in the following table to specify the frame of reference used in this study.
15 Table 1: Frame of Reference
TRA Service Quality Values
Intention and Behavior: An introduction to theory and research (Fishbein & Ajzen, 1975).
Antecedents to TRA:
The psychology of attitudes (Eagly & Chaiken 1993).
TRA and events:
Event image and traveling parents' intentions to attend youth sport events: a test of the reasoned action model, (Kaplanidou & Gibson, 2012). The effects of festival impacts on support intentions based on residents' ratings of festival performance and satisfaction: a new integrative approach. (Song, Xing & Chathoth, 2015). The Theory of Planned
Behaviour and Intentions to Attend a Sport Event.
(Cunningham & Kwon, 2003). Consumers' Intention to Attend Soccer Events: Application and Extension of the Theory of Planned Behavior (Eddosary, Ko, Sagas & Kim, 2015).
The relationships among service quality, value, satisfaction, and future intentions of customers at an Australian sports and leisure centre, (Murray & Howat, 2002).
The effect of service quality on foreign participants’ satisfaction and behavioral intention with the 2016 Shanghai International Marathon (Xiao, Ren, Zhang & Ketlhoafetse, 2019).
Looking back to see forward in services marketing: some ideas to consider (Cronin, 2003). Service Quality Measurement. (Lewis, 1993).
Understanding service quality (Prakash & Mohanty, 2013). Services marketing: Integrating customer focus across the firm. (Zeithaml, Bitner, Gremler & Pandit, 2000).
Value creation: assessing the relationships between quality, consumption value and behavioural intentions at sporting events (Yoshida, James & Cronin, 2013).
Some New Thoughts on Conceptualizing Perceived Service Quality: A Hierarchical Approach (Brady & Cronin 2001).
Value creation: assessing the relationships between quality, consumption value and behavioural intentions at sporting events (Yoshida, James & Cronin, 2013).
Effects of tourists’ local food consumption value on attitude, food destination image, and behavioral intention (Choe, 2018).
The Hedonic and Utilitarian Dimensions of Attendees' Attitudes Toward Festivals (Gursoy, Spangenberg & Rutherford, 2006). Examining the effect of experiential marketing on behavioral intentions in a festival with a specific sport event. (Yazıcı, Koçak, & Altunsöz, 2017).
Hedonic and utilitarian aspects of consumer behavior: An attitudinal perspective (Ahtola, 1985).
Hedonic consumption: emerging concepts, methods and propositions, (Hirschman & Holbrook, 1982).
Work and/or fun: measuring hedonic and utilitarian shopping value. (Babin, Darden& Griffin, 1994).
2.3.2 Conceptual framework
To show the relationship of the concepts discussed above the conceptual framework of this study is presented. Further, the contribution of the constructs to the research question ‘How do service quality, hedonic value and utilitarian value influence the spectators’
16
attitude and subjective norm towards the behavioral intention of visiting the event Vasaloppet?’ are shown.
The following figure shows the adapted TRA model for this study. The model drawn, illustrates the relationship between the three antecedents service quality, hedonic value and utilitarian value towards attitude and subjective norm, as well as further effects on behavioral intention.
Figure 4: The adapted TRA model
TRA is known to be a suitable framework to predict behavior. In the past TRA was used in several different contexts, including sport and events (Cunningham & Kwon, 2003; Eddosary et al., 2015; Kyriaki Kaplanidou & Heather J Gibson, 2012; Song et al., 2015). According to Fishbein & Ajzen (1975), TRA states the effect of attitude and subjective norm towards behavioral intention. However, to extend TRA, external variables can be used as antecedents (Eagly & Chaiken, 1993). Since previous research has shown that service quality, hedonic value and utilitarian value have a proven effect on attitude as well as on subjective norm (Babin et al., 1994; Xiao et al., 2019), the model was designed to include those antecedents. Accordingly, this study will measure the influence of service
17
quality, hedonic value and utilitarian value on spectators’ attitude and subjective norm towards the behavioral intention of visiting the event Vasaloppet.
To test the relationships among the constructs of the presented model five hypotheses were created. Firstly, the effect of service quality will be assessed as there is a known connection between service quality and behavioral intention (Murray & Howat, 2002; Xiao et al., 2019; Yoshida et al., 2013). Following, the relationship between service quality towards attitude and subjective norm will be analyzed. It is proposed that service quality has a positive and significant effect on attitude and subjective norm. Therefore, the stated hypothesis was created:
H1: Service quality has a positive and significant effect on the spectators’ attitude (H1a) and subjective norm (H1b) towards attending the Vasaloppet sport event.
Furthermore, Gursoy et al. (2006) underlines the positive relationship between utilitarian as well as hedonic value towards attitude. The two values are separate and important dimensions of attitude, which show a significant correlation (Voss, Spangenberg, & Grohmann, 2003). A positive relationship between both utilitarian and hedonic values towards subjective norm was previously analyzed as well (Ozturk, Nusair, Okumus, & Hua, 2016). Therefore, the connection between the values towards attitude and subjective norm will be tested. This study proposes that hedonic value and utilitarian value has a positive and significant effect on both attitude and subjective norm. The following two hypotheses were formulated in regard to the values:
H2: Hedonic value have a positive and significant effect on the spectators’ attitude (H2a) and subjective norm (H2b) towards attending the Vasaloppet sport event.
H3: Utilitarian value have a positive and significant effect on the spectators’ attitude (H3a) and subjective norm (H3b) towards attending the Vasaloppet sport event.
The TRA says that attitude and subjective norm has a positive and significant effect on behavioral intention (Fishbein & Ajzen, 1975). It has been proven successful for investigating behavioral intention in connection to sport events (Cunningham & Kwon, 2003; Eddosary et al., 2015; Kyriaki Kaplanidou & Heather J Gibson, 2012; Song et al., 2015). Accordingly, this will be tested by assessing the relationship between attitude and
18
subjective norm towards behavioral intention, in the context of the Vasaloppet sport event. This will be done through the following two hypotheses:
H4: Spectators attitude is positively influencing the behavioral intention towards attending the Vasaloppet sport event.
H5: Spectators subjective norm is positively influencing the behavioral intention towards attending the Vasaloppet sport event.
Given the extended TRA model with its antecedent’s service quality, hedonic value and utilitarian value the presented hypotheses will be tested in the case of spectators’ intention of visiting Vasaloppet. Following, the methodology of the study will be presented.
19
3. Methodology
______________________________________________________________________ In this chapter the methodology used to explore the model of TRA and its antecedents in the context of spectator’s intention when visiting a sport event in the case of Vasaloppet is explained.
3.1 Research design
The research design explains the method and procedures used to explore the field of interest (Porta & Last, 2018). Therefore, the research philosophy and research approach will be further explained. Research philosophy is a “system of beliefs and assumptions about the development of knowledge” (Creswell, 2018). This study´s research philosophy is grounded in epistemology and positivism. Epistemology refers to presumptions about knowledge, what is acceptable, valid and legitimate knowledge and how that knowledge can be communicated to others (Saunders, 2016). Positivism refers to the process of working with an observable social reality and make law-like generalizations about it (Saunders, 2016).
This study had a predetermined and highly structured data collection technique in order to generate numerical data to be used for examining the relationship between the variables in the TRA and its antecedents in relation to the sport event Vasaloppet. Thus, having a deductive research approach, where data was used to test the predetermined theory (Saunders, 2016). Deductive research uses measurements, which are being analyzed to draw conclusions (Watson, 2015). Accordingly, a quantitative research approach was chosen which uses numerical measures to examine relationships between variables using statistical and graphical techniques (Saunders, 2016). Quantitative research has its origin mainly in psychology (Creswell, 2018) and uses methods concerning systematic investigation of social phenomena (Watson, 2015). The three elements plan, structure and strategy are used to help determine hypothesis, conduct the study and to analyze and interpret the gathered data. In this study, this was accomplished through a survey, meaning that a quantitative description of attitudes and opinions of the spectators of Vasaloppet was tested by studying a sample of the population.
20 3.2 Data collection
There are several different survey approaches, reaching from postal survey to telephone interviews to online surveys up to face-to-face interviews (Saunders, 2012). The online survey can be distributed along different channels and provides minimal costs, fast response time, access to a large population and the guarantee of no interviewer bias. The disadvantages concern confidential information, technical problems and risk for a low response rate. In contrast, the interview offers personal contact and an increased response rate, which although can lead to interviewer bias, higher costs as well as smaller samples. Considering the advantages and disadvantages of surveys and interviews, a combination of an online survey and face-to-face interviews was chosen. Data was collected during the cross-country skiing race Vasaloppet in the final area of the event in Mora in March 2020 as well as online via E-Mail and Social Media Channels. The sample consists of spectators to the skiing race. At the Vasaloppet site three supervised surveyors distributed a total of 25 questionnaires. The survey was done online through the Qualtrics link on smart phones. Respondents were guided through the survey by the surveyors who asked the questions and helped the respondents to fill in their answers in the Qualtrics form. To receive valid responses the survey was completed on the spot together with the surveyor. Respondents were randomly chosen under the condition of attending the event as spectators and being older than 18 years. Additionally, the questionnaire was distributed online, and data was collected through the Qualtrics link without guidance. To receive responses, the link was shared in Facebook groups that were related to Vasaloppet, such as “Vasaloppet Boende”, “Längdskidor i Stockholm” and “Vasaloppstrippeln 2020”. In addition, family and friends that visited the event were contacted and asked to perform the survey. Lastly, cross-country skiing clubs were contacted to spread the questionnaire. A total of 76 questionnaires were distributed through the online survey. This gives a total of 101 responses.
3.3 Model measurement variables
Survey research is a quantitative description of trends, attitudes or opinions, which are studied by a sample of the population (Creswell, 2018). In order to provide a reasonable response rate and an increased reliability “a survey should be short, relevant, focused,
21
interesting, easy to read and complete” (Story & Tait, 2019, p. 193). However, there are many choices of questions and options of responses. To know which questions are appropriate for the research intended it is important to know the audience. Nevertheless, if validated questions from previous research is available, this should be used (Story & Tait, 2019). Accordingly, the construction of the questionnaire was inspired by the literature review in this study where the model of TRA with the antecedents was introduced. To identify the best possible measurements, proven items from previous studies where chosen and a total of 14 questions were formulated. Additionally, the main questionnaire contained the respondents demographics (age, gender and nationality) as well as the 6 factors related to the model (behavioral intention, attitude, subjective norm, service quality, hedonic value and utilitarian value).
Firstly, service quality was assessed using three sections, with each including three to four items, which resulted in a total of 11 items on service quality (Xiao et al., 2019). The physical environment was evaluated using following items: ‘The atmosphere during the cross-country skiing event in the arena is very good.’, ‘The support towards the athletes is great.’, ‘The entertainment program in the arena of the race is excellent.’ and ‘The event is well designed.’. Furthermore, interaction quality included the items: ‘The service personnel are responsive.’, ‘The service personnel are courteous.’, ‘The service personnel are knowledgeable.’ and ‘The service personnel are prompt in providing service.’. For outcome quality the items contained were: ‘Attending this event as a spectator is a great experience’, ‘Participating this event made me a more experienced spectator.’ and ‘Participation as spectator in this event is very positive.’. Those items where tested, using a 7-likert scale reaching from 1: strongly disagree to 7: strongly agree.
Secondly, hedonic value and utilitarian value were assessed using a semantic differential with seven degrees. For the utilitarian value the ‘organization of the venue’ was tested by using 6 items according to Gursoy et al. (2006): unnecessary – necessary, ineffective – effective, not-functional – functional, impractical – practical and unhelpful – helpful. These are five proven, reliable, valid and generalizable scales. In addition, Voss, Spangenberg, & Grohmann (2003) included: useless - useful, which was used in this study as well, due to the connection of the event. Furthermore, the 8 items chosen for the hedonic value are taken from three different authors: ‘The experience of visiting
22
Vasaloppet’, was tested by using the degree of: dull – exciting, not-delightful – delightful, not-fun – fun, not-thrilling – thrilling (Gursoy et al., 2006; Voss et al., 2003), unenjoyable - enjoyable, not-amusing - amusing (Voss et al., 2003), boring - interesting (Gursoy et al., 2006) and unpleasant - pleasant (Triantafillidou & Siomkos, 2014).
Lastly, to test the TRA constructs, items suggested by Eddosary et al. (2015) were used. To assess the spectator’s attitude, a semantic differential scale was used to measure the response to ‘For me, attending the Vasaloppet race this year in Mora is:’. The items used included: unpleasant – pleasant, dull – entertaining, worthless – valuable, not-comfortable – comfortable. Furthermore, to assess subjective norm, a 7-likert scale with anchors 1: strongly disagree and 7: strongly agree was chosen to test the items of: ‘Most of the people who are important to me would approve of me being a spectator in events such as Vasaloppet.’, ‘People close to me are likely to attend an event such as Vasaloppet.’ and ‘My important referent is likely to attend this event.’. Moreover, the intention to attend this event again in the future was tested with the same 7-likert scale by four items: ‘I intend to go to events as a spectator such as Vasaloppet again.’, ‘Attending an event such as Vasaloppet as a spectator is something, I plan to do in the next year.’, ‘I will try to attend an event such as Vasaloppet as a spectator in the next year.’ (Eddosary et al., 2015) and ‘I will likely recommend Vasaloppet as a spectator to a friend.’ (Koo, Byon, & Baker, 2014).
Those factors and items were created to develop a questionnaire that can answer the research question and hypotheses. Although, only proven items were used, a pre-test was carried out. The survey was sent to JIBS students and a total number of 21 responses was gathered. Due to the feedback and a testing in SPSS, some minor changes were made, and the survey was conducted in the latest format.
3.4 Sampling selection
In the sampling selection, probability sampling as well as non-probability sampling can be used. Probability sampling includes simple random sampling, systematic sampling, stratified sampling and cluster sampling. Whereas, non-probability sampling techniques includes convenience sampling, judgmental sampling, quota sampling and snowball sampling. The major difference between the two approaches is the chance of the
23
population to be selected. In this study simple random sampling was chosen. This is used when no prior data of the target population is given (Singh, 2018).
According to Pallant (2016) different authors give different advices on how many responses are needed to receive a scientific valuable outcome of the research. Stevens (1996) argues, that per predictor 15 subjects are needed for a reliable equation. This would lead to 90 needed responses for the given model. In contrast, Tabachnick et al. (2001) developed a formula: N > 50 + 8 x number of independent variables. This kind of calculation will indicate a need for 98 responses in this research. Thus, to ensure a scientific valuable outcome, a limit of 100 responses was chosen for this study.
3.5 Event description
The sport event surveyed in this study was Vasaloppet. This is the world’s most famous long-distance cross-country skiing race. It takes place annually on the first Sunday of March in Sweden and every year it draws approximately 15,800 participants from all over the world. However, in Vasaloppet’s winter week usually 65,000 participants are expected. In 2020 it was slightly below the last year’s average with 59,522 registered participants, 49,036 participants that started and 45,769 participants that finished the races. This slight decrease of participants might have been influenced by bad snow conditions this year. Regarding spectators, Vasaloppet counts as a social event where mainly significant others (such as family members and friends) of participants are watching the race (Vasaloppet, 2020).
The survey was conducted at the finishing line of the race, where an arena was built up. The arena covered the finishing line and a few hundred meters before. At the finishing line there was a big screen showing the audience the athletes reaching their goal and speakers with commentators of the race as well as music. On the side of the skiing tracks, food trucks and stands to purchase souvenirs could be found. Next to the finishing line Visma Ski Classics had a big truck where there was an after-ski party. Parking was arranged around the arena. In connection to the parking lots toilets could be found. In the whole arena and in the parking lot, service personnel were guiding the audience. In addition, service personnel with the text ‘info’ on the back of their jackets were standing
24
in the audience ready to answer questions. Police officers and security guards were found at the race as well.
The TRA has been used to study sport events before. However, to apply the newly created model an event with a wide range of spectators was searched. Vasaloppet is a big event that draws numerous international visitors and participants, which makes it suitable for the present study as it presents an opportunity to compare behavioral intentions from spectators all over the world. Additionally, the context of cross-country skiing has not been investigated before, and therefore presents new possibilities for the research.
3.6 Data analysis
To test the hypothesis and the overall relationships between the antecedents and behavioral intention, SPSS was utilized. Firstly, the data was cleaned and checked for outliers. Then a descriptive statistic was run to define demographics. Moving on, an explanatory factor analysis was conducted to justify the items used. Then the items were computed into variables. A Pearson correlation was run to explore the strength of the relationships between the continuous variables. Lastly, a multiple regression analysis was carried out.
Factor analysis is used when the underlying structure of a set of variables, with a large number of related variables, is to be explored (Pallant, 2016). It is also used to reduce a large number of related variables to a smaller set. In this study it was conducted to test the scales used for the survey. The large number of scale items and questions were analyzed using exploratory factor analysis. Then the scales were refined to form a smaller number of coherent subscales. The final items were then condensed into the variables service quality, hedonic value, utilitarian value, subjective norm, attitude and behavioral intention.
A Persons correlation was used to describe the strength and direction of the relationships between variables. The statistic obtained is Pearson’s product-moment correlation (r) and its statistical significance. The Pearson correlation can only take on numbers from -1 to +1. This shows whether there is a positive or negative correlation between the variables. The size of the value tells the strength of the relationship (Pallant, 2016). In this study a
25
Pearson correlation was used to define the correlation between the variables service quality, hedonic value, utilitarian value, subjective norm, attitude and behavioral intention.
Following, a multiple regression analysis was conducted. Multiple regression analysis is not only one technique, but a family of techniques used to explore the relationships between one dependent and several independent variables. It is used to predict a single dependent continuous variable from a group of independent variables or to test the predictive power of a set of variables and to assess the relative contribution of each individual variable. This analysis is based on correlations, but offers a more sophisticated exploration, which is used to investigate more complex real life cases (Pallant, 2016). In this study a multiple regression analysis was used to analyze the relationship between the dependent variable behavioral intention and the independent variables service quality, utilitarian value, hedonic value, attitude and subjective norm. Hence, it was used to test the predictive power of the antecedents to TRA, as well as attitude and subjective norm predictive power on behavioral intention.
Additionally, a comparison between Swedish and non-Swedish spectators was carried out, due to the number of international visitors at the event. An independensamples t-test was used to compare the mean score on the continuous variables among the two groups. It tests the statistically significant difference between the answers to the survey of the defined groups of Swedish and non-Swedish spectators (Pallant, 2016).
3.7 Validity and Reliability
Validity and reliability are tested to understand if the data collected answers the research question. To assure validity and reliability, Cronbach’s Alpha as well as Kaiser-Meyer-Olkin (KMO) Test for Sampling Adequacy and Bartlett´s test was performed.
Cronbach’s Alpha is a test concerning the scales internal consistency. Thus, to the degree the items of the scale measure the same underlaying attribute. Values range from 0 to 1, with higher values indicating greater reliability. A recommended minimum level for Cronbach’s alpha is 0.7 (Pallant, 2016). Using all the items Cronbach’s alpha was 0.932,
26
indicating the scales are valid and reliable. Using only the selected scores Cronbach’s alpha was 0.925, lower than the initial score, but still indicating valid and reliable scales. KMO test and Bartlett’s test analyses the suitability of the research for the factor analysis. A value of 0.6 or higher in the KMO test is good for the factor analysis. Whereas, Bartlett’s test is supposed to be 0.5 or lower, to be good for the factor analysis (Pallant, 2016). The obtained values from the KMO and Bartletts test are further described and analyzed in the analysis and findings chapter.
3.8 Delimitations
Due to constraints in time and resources it was chosen to only investigate one sport event. Vasaloppet was chosen as the event is of feasible size and at a suitable time for the study conducted. In addition, it is one of the largest sport events and the largest cross-country skiing race in the world, which presents the opportunity to investigate the behavioral intentions of an international and diverse crowd. It was chosen to conduct the study to the main race Vasaloppet, and not during any of the other races in connection to the event such as Tjejvasan or Halvvasan. Furthermore, a sample size with a limit of at least 100 responses was set.
3.9 Ethical considerations
During the data collection all participants voluntarily accepted to participate in the study under guarantee of anonymity of their responses and with prior information about the procedures in relation to GDPR-standards. Thus, full consent was obtained from the participants prior to the study and protection of the privacy of research participants were ensured. Furthermore, participation in the study could be cancelled at any time and all communication between the researchers and the participants was done with honesty and transparency. The processing of the data followed GDPR-standards. Accordingly, no unnecessary information was gathered or stored, and the data used was deleted after the necessary procedures in SPSS were carried out.
27
4. Analysis & Findings
______________________________________________________________________ In this chapter the gathered data will be analyzed, and findings will be stated. Firstly, the responses and the demographical data of the respondents will be presented. Secondly, the reliability tests as well as the factor analysis will be given. Third, Pearson’s Correlation and Multiple Regression will be presented. Lastly, the outcome of the analysis is presented as the research findings.
4.1 Demographics
Looking at the 101 collected responses, demographics of gender, age and nationality were observed. Regarding gender, a split of 52.5% male and 47.5% female respondents can be seen. The average age of all respondents was 41.05 years, where the youngest respondent was 21 years old and the oldest 74 years old. After collecting the age in a nominal scale, it was put into age-groups showing that 30.7% of the respondents were between 21 and 30 years old, 21.8% between 31 and 40 years old, another 21.8% between 41 and 50 years old, 15.8% between 51 and 60 years old and 9.9% 60 years and older, which provides a good spread among all age groups.
According to the collected data of nationalities, the following nine nationalities among respondents were included: Austria, Finland, Germany, Hungary, Italy, Netherlands, Norway, Sweden and Switzerland. Hence, all European countries. The analysis shows that 76% of all surveys, have been answered by Swedish spectators, and 24% were non-Swedish spectators from different European countries, see table 2 below.
28 Table 2: Demographic data of respondents
N % Gender Male 53 52.5 Female 48 47.5 Age 21-30 31 30.7 31-40 22 21.8 41-50 22 21.8 51-60 16 15.8 60+ 10 9.9 Nationality (all) Austria 6 5.9 Finland 2 2.0 Germany 11 10.9 Hungary 1 1.0 Italy 1 1.0 Netherlands 1 1.0 Norway 1 1.0 Sweden 77 76.2 Switzerland 1 1.0 Nationality (groups) Sweden 77 76.2 Non-Sweden 24 23.8 4.2 Outliers
Before starting the analysis of the model, outliers were detected. A descriptive statistics exploration was done to detect values well above or well below other cases (Pallant, 2016). In this study, several outliers were detected. However, the authors took a further look into the results and due to the trimmed 5% mean none of the items was deleted. This trimmed 5% mean did not show significant differences to the actual mean and the results of all cases were similar.
29 4.3 Factor Analysis
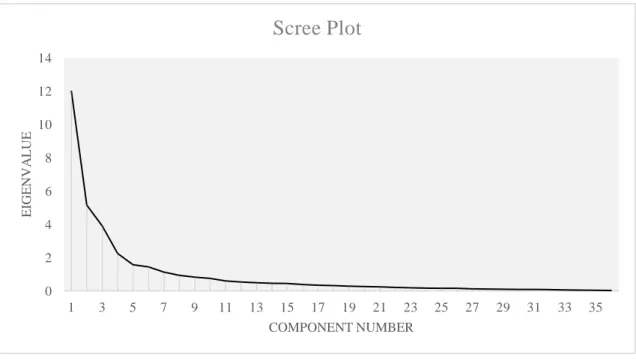
To ensure the data was suitable for Factor Analysis a KMO test and Bartlett’s test was conducted. This resulted in a KMO score of 0.80 and a score of Bartlett’s tests on a significance level of 0.00. Thus, the result is both reliable and valid, since KMO is higher than 0.6 and Bartlett’s test is lower than 0.05 (Pallant, 2016). Accordingly, the data is suitable for Factor Analysis. Using Kaisers criterion, the first seven factors were chosen. This criterion says only factors with an eigenvalue above 1.0 are to be used for further investigation (Pallant, 2016). The total variance explained of these seven factors is 76%, accordingly these seven factors together explain 76% of the used model. This result is also confirmed when looking at the scree plot which flattens out at component number 7, after which the eigenvalue is below 1.0.
Figure 5: Scree Plot
To interpret the factors, the Rotated Component Matrix was analyzed. The highest loadings on each component were used to identify the underlying variable to each component. Both the factors of the antecedents and the TRA have been analyzed. Below, all factors can be seen. The factors which are marked in light grey were excluded, as is described below. 0 2 4 6 8 10 12 14 1 3 5 7 9 11 13 15 17 19 21 23 25 27 29 31 33 35 EIG ENV A L UE COMPONENT NUMBER
Scree Plot
30
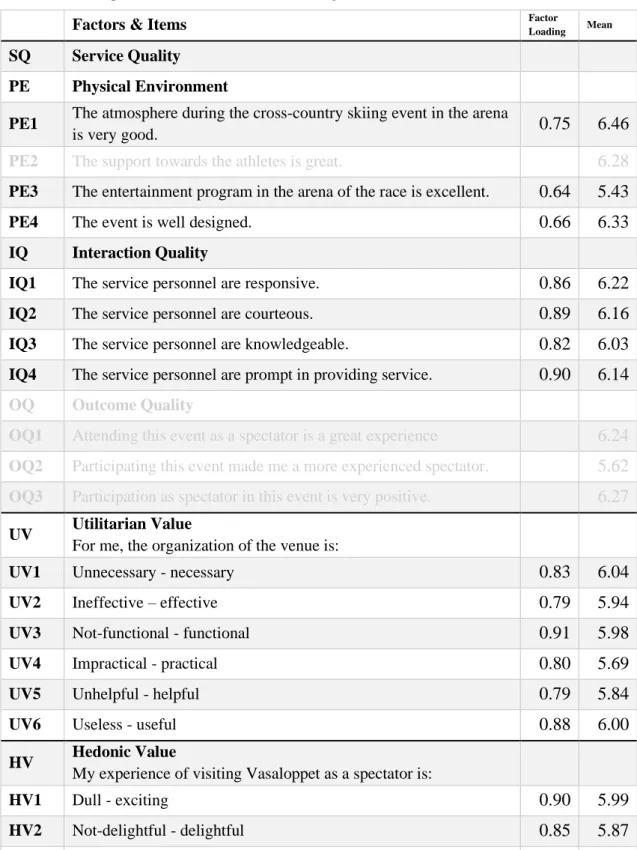
Table 3: Descriptive Statistics, Factor Loadings, and Item Means
Factors & Items Factor Loading Mean
SQ Service Quality PE Physical Environment
PE1 The atmosphere during the cross-country skiing event in the arena
is very good. 0.75 6.46
PE2 The support towards the athletes is great. 6.28
PE3 The entertainment program in the arena of the race is excellent. 0.64 5.43
PE4 The event is well designed. 0.66 6.33
IQ Interaction Quality
IQ1 The service personnel are responsive. 0.86 6.22
IQ2 The service personnel are courteous. 0.89 6.16
IQ3 The service personnel are knowledgeable. 0.82 6.03
IQ4 The service personnel are prompt in providing service. 0.90 6.14
OQ Outcome Quality
OQ1 Attending this event as a spectator is a great experience 6.24
OQ2 Participating this event made me a more experienced spectator. 5.62
OQ3 Participation as spectator in this event is very positive. 6.27
UV Utilitarian Value
For me, the organization of the venue is:
UV1 Unnecessary - necessary 0.83 6.04
UV2 Ineffective – effective 0.79 5.94
UV3 Not-functional - functional 0.91 5.98
UV4 Impractical - practical 0.80 5.69
UV5 Unhelpful - helpful 0.79 5.84
UV6 Useless - useful 0.88 6.00
HV Hedonic Value
My experience of visiting Vasaloppet as a spectator is:
HV1 Dull - exciting 0.90 5.99 HV2 Not-delightful - delightful 0.85 5.87 HV3 Not-fun - fun 0.87 6.03 HV4 Not-thrilling - thrilling 0.84 5.57 HV5 Unenjoyable - enjoyable 0.87 5.94 HV6 Not-amusing - amusing 0.87 5.77
31
HV7 Boring - interesting 0.85 5.90
HV8 Unpleasant - pleasant 0.85 5.96
ATT Attitude
For me, attending the Vasaloppet race this year in Mora is:
ATT1 Unpleasant - pleasant 0.63 5.91
ATT2 Dull - entertaining 5.79
ATT3 Worthless - valuable 0.59 5.79
ATT4 Not-comfortable - comfortable 0.72 5.60
SN Subjective norm
SN1 Most of the people who are important to me would approve of me
being a spectator in events such as Vasaloppet. 0.75 6.30
SN2 People close to me are likely to attend an event such as
Vasaloppet. 0.83 5.87
SN3 My important referent is likely to attend this event. 0.77 6.05 BI Behavioural Intention
BI1 I intend to go to events as a spectator such as Vasaloppet again. 0.72 6.09 BI2 Attending an event such as Vasaloppet as a spectator is
something, I plan to do in the next year. 0.92 5.35
BI3 I will try to attend an event such as Vasaloppet as a spectator in
the next year. 0.91 5.48
BI4 I will likely recommend watching Vasaloppet as a spectator to a
friend 6.12
In the survey, service quality was divided into physical environment (PE1-4), interaction quality (IQ1-4) and outcome quality (OQ1-3). The Rotated Component Matrix showed that PE1, PE2 and PE4 was explained by component 6. However, PE3 had a cross loading at component 3 and was thus excluded. Interaction quality had all perfectly loaded items explained by component 3. Outcome quality had no loading for OQ1 and OQ3 had a cross loading with physical environment at component 6. OQ2 was explained by component 4 where it had a cross loading with intention. Accordingly, all items of outcome quality were excluded from the factors. Utilitarian value (UV1-6) had all perfectly loaded items on component 2. Hedonic value (HV1-8) had all perfectly loaded items on component 1. Thus, all items for both hedonic and utilitarian values were used.
Attitude (ATT1-4) had loadings for ATT1, ATT3 and ATT4 on component 7. ATT2 had a cross loading with component 1 and was thereby excluded. ATT1 and ATT3 had cross