VTI rapport 623A Published 2008
www.vti.se/publications
Efficiency in goods distribution collaboration in
cities – SAMLIC
Jan R. Eriksson Tomas Svensson
Publisher: Publication:
VTI rapport 623A Published: 2008 Project code: 13208 Dnr: 2006/0485-22
SE-581 95 Linköping Sweden Project:
Goods distribution in cities
Author: Sponsor:
Jan R. Eriksson Tomas Svensson
VTI
(Swedish National Road and Transport Research Institute)
Title:
Efficiency in goods distribution collaboration in cities – SAMLIC
Abstract (background, aim, method, result) max 200 words:
The number of zones for unloading goods in the city centre is often small compared to the number of delivery addresses and carriers. The attendant phenomenon is congestion and its subsequent costs. One way to reduce these effects is to implement retail consolidation centres.
Some trials have been carried out on urban distribution centres and a few implementations have been made. More research and knowledge is still needed. The Samlic project is one contribution to increase the knowledge in this field about urban distribution.
A local network for Linköping freight forwarders took the initiative to create an economically and logistically efficient system. During a nine-week trial period in the spring of 2004, coordinated
distribution to the centre of Linköping was carried out. Three freight forwarders took part in this project. The trial shows that the number of lorries needed decreased by a third, the total time for the distribution by a fifth and the total driving distance in the centre by about fifty per cent. The following paper
describes this trail and an implementation proposal as well as the process of trying to implement it.
Keywords:
Utgivare: Publikation:
VTI rapport 623A Utgivningsår: 2008 Projektnummer: 13208 Dnr: 2006/0485-22 581 95 Linköping Projektnamn: Varudistribution i städer Författare: Uppdragsgivare: Jan R. Eriksson Tomas Svensson VTI Titel:
Effektiviteten hos samordnad varudistribution i städer – SAMLIC
Referat (bakgrund, syfte, metod, resultat) max 200 ord:
Antalet lastzoner och kajplatser för lossning av gods i citykärnor är ofta litet jämfört med antalet
leveransadresser och antalet transportörer. Den resulterande effekten blir trängsel i både trafik och kring lossningsplatserna. Detta i sin tur ger upphov till ökade kostnader för transportörerna. Ett sätt att
reducera dessa kostnader är att införa samdistribution av varor till handeln.
Ett antal försök med samdistribution, samt några få permanenta tillämpningar, har genomförts. Emellertid, det finns fortfarande ett stort behov av mer forskning och kunskap om samdistribution. Projektet Samlic utgör ett bidrag för att öka denna kunskap.
Ett lokalt nätverk av distributörer i Linköping tog initiativet till att skapa ett logistiskt och ekonomiskt effektivt system. Våren 2004, under en period på nio veckor, genomfördes ett försök med
sam-distribution i Linköpings citykärna. Tre distributörer deltog i försöket. Resultaten i försöket visade att behovet av antalet lastbilar minskade med en tredjedel, totala åtgången av tid för distributionen med en femtedel och totala körsträckan i city med femtio procent. Denna rapport beskriver detta försök, inklusive resultat, samt också ett förslag till ett permanent system med tillhörande implemen-teringsprocess.
Foreword
A local network for freight forwarders in Linköping took the initiative for a coordinated retail distribution project in Linköping City in 2000 – The Samlic project. They asked VTI to be project leader for the project in 2003.
A pilot trail was carried out in 2004 and a proposal for a system was developed during 2005. The project resulted in a number of presentations and reports in Swedish and some presentations in English.
This report is a response to a large international demand for documentation of the project in English.
Linköping June 2008
Quality review
The review seminar was carried out on 20 April 2007 where Stefan Engevall, from the Department of Science and Technology, Linköping University, reviewed and
commented on the report. Jan R. Eriksson and Tomas Svensson made alterations to the final manuscript of the report on 29 August 2008. Maud Göthe-Lundgren, research director, examined and approved the report for publication on 2 September 2008.
Kvalitetsgranskning
Granskningsseminarium genomfört den 20 april 2007 där Stefan Engevall, Institutionen för teknik och naturvetenskap, Linköpings universitet var lektör. Jan R. Eriksson och Tomas Svensson har genomfört justeringar av slutligt rapportmanus den 29 augusti 2008. Forskningschef, Maud Göthe-Lundgren, har därefter granskat och godkänt publikationen för publicering den 2 september 2008.
Contents
Summary ... 5
Sammanfattning ... 7
1 Introduction ... 9
2 Description of the pilot trial... 11
2.1 Participants ... 11
2.2 City centre subdivided into zones ... 11
2.3 The trial period... 12
2.4 Consolidation centre ... 12
2.5 Goods ... 12
2.6 Agreements ... 12
2.7 The retailers... 13
2.8 Performance of the distribution ... 14
3 Results of the pilot trial... 17
3.1 The database... 17
3.2 City centre distribution ... 20
3.3 Waiting time ... 22
3.4 Loading factors ... 23
3.5 Consolidation terminal ... 24
3.6 Reflections and comments from the participants ... 25
4 Samlic ... 26
5 Conclusions ... 29
Efficiency in goods distribution collaboration in cities – SAMLIC
by Jan R. Eriksson and Tomas Svensson
VTI (Swedish National Road and Transport Research Institute) SE-581 95 Linköping Sweden
Summary
Congestion and queues are increasing both in traffic and at the loading/unloading areas in growing cities. This in turn, leads to increased costs for the distribution of goods. The number of zones for unloading goods in the city centres is often small compared to the number of delivery addresses and the number of carriers. The attendant phenomena are congestion and costs of congestion. One way to reduce the congestion and the congestion costs is to implement retail consolidation centres. It is important for a system with a joint venture in goods distribution collaboration to be economically profitable. No matter which form the collaboration takes, it must be possible to make considerable savings.
Some trials of consolidation centres and urban distribution centres have been made as well as a few implementations. However, more research and knowledge about goods distribution collaboration in cities is still needed. The Samlic project is one contribution to the knowledge in this field.
A local network for freight forwarders in Linköping took the initiative for coordinated retail distribution in Linköping City – Samlic. The aim was to create an economically and logistically efficient system for goods distribution that is persistent and friendly to the environment. During a trial period of nine weeks in the spring of 2004, there was coordinated distribution to the centre of Linköping. Three big freight forwarders took part in this trial.
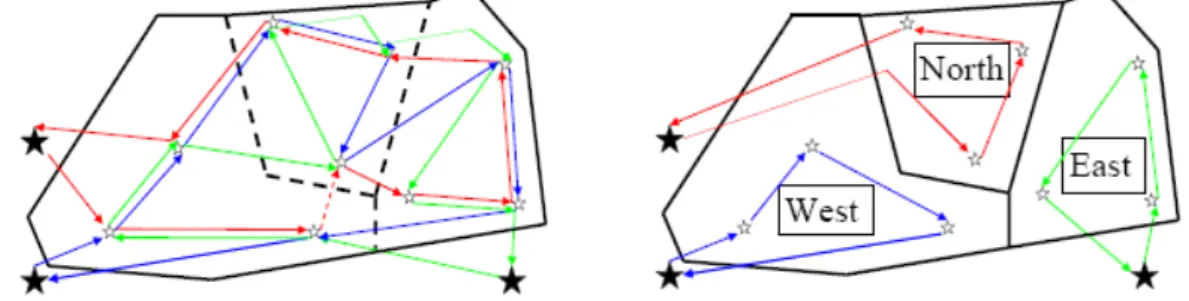
Figure Transport pattern without and with coordinated distribution.
Linköping city was subdivided into three zones. The figure above shows the transport pattern, when three distributers (blue, red green) delivering goods to the city centre, first without (the left figure) and then with coordinated distribution (the right figure).
Without coordinated distribution all three deliver goods to the whole city centre (this means in principle that every unloading area can be visited by all three distributors) and with coordinated distribution each distributor delivers goods only to one zone. In the coordinated distribution case, the goods have been sorted according to recipient zone (West, North and East) at the consolidation terminal. The resulting effects will be more efficient distribution and less traffic in the city.
The experience of the trial shows that the number of lorries needed decreased by a third (the filling per pallet was increased by fifty percent), the total time for the distribution
decreased by a fifth and the total driving distance in the centre (and thereby the
emission of exhaust fumes from vehicles in the city) decreased by about fifty per cent. The lack of a working IT system and issues concerning trademark exposure are the reasons why the proposed distribution system Samlic was not implemented within the given research project time frame.
Effektiviteten hos samordnad varudistribution i städer – SAMLIC
av Jan R. Eriksson och Tomas Svensson VTI
581 95 Linköping
Sammanfattning
För städer med ekonomisk tillväxt följer ökande distributionstrafik. Denna trafik skall också samsas med övrig trafik. Distributionskostnaderna ökar på grund av ökande trängsel. Antalet lastzoner och kajplatser för lossning av gods i citykärnor är ofta litet jämfört med antalet leveransadresser och antalet transportörer. Den resulterande effekten blir trängsel i både trafiken och kring lastplatserna. Ett sätt att reducera både trängsel och trängselkostnader är att införa samdistribution av varor till handeln. För att införandet av ett samordnat varudistributionssystem ska kunna förverkligas är det viktigt att det blir ekonomiskt lönsamt. Hur trafikeffektivt systemet än utformas, så måste de ekonomiska besparingarna med samordningen vara betydliga.
Ett antal försök med samdistribution, samt några få permanenta tillämpningar, har genomförts. Emellertid, det finns fortfarande ett stort behov av mer forskning och kunskap om samdistribution. Projektet Samlic utgör ett bidrag för att öka denna kunskap.
Ett lokalt nätverk av distributörer i Linköping tog initiativet till Samlic-projektet. Samlic står för Samdistribution med lastbil i city. Målet var att skapa ett uthålligt och miljövänligt system som är logistiskt och ekonomiskt effektivt. Våren 2004, under en period på nio veckor, genomfördes ett försök med samdistribution i Linköpings citykärna. Tre distributörer deltog i försöket.
Figur Utan och med samdistribution.
Inför pilotförsöket gjordes en indelning av Linköping innerstad i tre zoner. Figuren visar city trafikerat av tre transportörer dels utan (alla tre transportörerna kör i hela city), dels med samdistribution (de tre transportörerna kör i varsin tredjedel av city). I figuren till vänster levererar blå, röd och grön transportör gods till alla tre områdena. Det innebär att varje lastplats kan få besök av alla tre transportörerna. I samdistributionsfallet har godset sorterats efter mottagningsområde (Väst, Nord och Öst) på en samlastnings-terminal. Varje distributör, medtagande gods från alla distributörerna, kör sedan till var sitt område. Effekten blir effektivare distribution och mindre trafik i city.
Försöket analyserades och utvärderades hösten 2004 och visade att med samdistribution minskade behovet av antalet lastbilar med en tredjedel (fyllnadsgraden per pallplats ökade med femtio procent), totala tiden för utkörning minskade med en femtedel och
totala körsträckan i city (och därmed utsläppen av avgaser från fordon i city) mer än halverades.
Avsaknaden av ett fungerande IT-system samt varumärkesaspekter är orsaken till att implementering av det föreslagna samdistributionssystemet Samlic inte kunde göras inom forskningsprojektets tidsram.
1 Introduction
Congestion and queues are increasing in traffic and at the loading bays in Linköping’s inner city. This in turn, leads to increased costs for the distribution of goods. The local network for transporters in Linköping has therefore taken the initiative for the project Samlic. Coordinated goods distribution is considered by city councils and authorities as a possible alternative to more restrictive regulations and control of the lorry traffic in inner cities to improve the environment, which new environmental quality norms require.
A study to map out the pattern of goods distribution to retail shops in four shopping malls in Uppsala city was carried out in an other project (Ljungberg & Gebresenbet, 2004), in order to investigate the potential for coordinated goods distribution to
contribute to reducing financial cost, congestion and environmental impact. This study also provides a good survey of coordinated goods distribution.
In the spring of 2004, a pilot project was carried out in order to acquire data to motivate an implementation of a consolidation centre for retail goods to shops in central
Linköping – Samlic. The aim of the trial was to measure possible profits from
coordinated distribution and, while at the same time, to gain practical experience. The trial period was nine weeks and the participants were the freight forwarders (or/and their corresponding road carriers) DHL, Posten and Schenker.
The basic idea behind the pilot trial was to divide central Linköping into zones; in this case a division into three zones was chosen, West, North and East. In the coordinated distribution case, the goods are sorted in a consolidation terminal by destination zone. Each freight forwarder carries goods from all forwarders to its allocated zone.
Figure 1 Transport pattern without and with coordinated distribution
Figure 1 above shows the transport pattern before coordinated distribution, when all distributors drive in the whole city centre and when three distributors each drive in a third of the city centre. The results should be more efficient distribution and less traffic. Without coordinated distribution, blue, red and green freight forwarders distribute goods to all three zones. It is possible that a loading bay can be visited by all three forwarders. With coordinated distribution, both the congestion at the loading bays and the total number of stops for unloading are reduced.
Using the results from the pilot trial we will show that financial savings can be reached by decreasing the number of lorries. The increased cost for the coordinated distribution (terminal, staff, administration etc.) has to be less than the savings which result from a more efficient distribution in the centre to give a net saving with Samlic compared to the current situation. With a future expansion, the profits from the coordinated distribution will also increase.
From the results and the experience of the pilot trial, a proposal for a coordinated distribution system will be designed. The proposal is sufficiently detailed to be a foundation for negotiations between the various transport operators to decide about introducing a coordinated distribution system. Furthermore, we will show that the system is economically profitable and technically feasible. The proposal consists of the components necessary for a coordinated distribution system and also drafts of co-operation contracts. Components and contract drafts will not be shown here, but some comments about these will be made. One component of the distribution system is the IT system. The requirements for the IT system are that the IT-system for Samlic should communicate information to the freight forwarders’ own systems, both from the vehicles and the terminal. This should be done without changes of the freight forwarders’ IT systems. The IT system should also satisfy the information needs of Samlic. In order to run an efficient system development, Samlic should start with a temporary solution. Research is required in order to develop an IT system for
coordinated distribution. Another component is the pre-sorting routine. It is possible to make changes in the freight forwarders’ own pre-sorting routines for incoming goods from outside Linköping (which is most of the goods) to avoid extra unloading-loading operations, etc. In the proposal, suggestions for the texts for different written
agreements are also included.
One point with the Samlic project is that the process behind the proposal is described. This is of great value for future coordinated distribution projects where the private and public sectors, as well as researchers, participate in the project. It also shows the work which needs to be done before a decision about introducing a coordinated distribution system can be taken. If our implementation proposal is to be used in another city, the proposal cannot simply be copied. The process behind the proposal must also be worked through, fully or partly. This report documents the process behind the Samlic proposal and can be of assistance in the next implementation of coordinated distribution. The process of winning the support of different participants and from different participants’ organisations is necessary. Cooperation or competition are the alternatives for every organisation. Within each organisation, the view of each individual on these alternatives can vary depending on where in the organisation the person is working.
Coordinated distribution systems have already been attempted in part, both in a trial and on permanent basis in a few medium sized and big cities. For the freight transporters to be able to handle this efficiently, there should be a common concept that can be
promoted in several cities. In Samlic, such a concept is developed along with a prototype for implementation. The concept brings unity and clearness for freight transporters and at the same time makes it possible to introduce local solutions for different cities. One possibility could be to choose franchising as a model. Locally, Samlic can be designed as a joint-stock company, private limited company, trading company or simply with only mutual agreements.
2
Description of the pilot trial
One way to reduce the traffic congestion and its negative environment effects in the city centres is to implement retail consolidation centres. Coordinated goods distribution is considered by city councils and authorities as a possible alternative to more restrictive regulations and control of lorry traffic in inner cities to improve the environment, in accordance with new environmental quality norms for example. However, economic profitability is necessary for a system with a joint venture in goods distribution collaboration to be successful.
A local network for freight forwarders in Linköping has therefore taken the initiative to coordinated retail distribution in Linköping City – Samlic. The aim was to create an economically and logistically efficient system for goods distribution that is persistent and friendly to the environment.
During a trial period of nine weeks in the spring of 2004, a pilot project with
coordinated distribution to the centre of Linköping was carried out in order to obtain data to motivate an implementation of a consolidation centre for retail goods to shops in central Linköping – Samlic. The aim of the trial was to measure possible profits from coordinated distribution, while at the same time, to gain practical experience. Three freight forwarders took part in this pilot project.
2.1 Participants
The three freight forwarders who took part in the pilot trial were DHL, Posten and Schenker and their road carriers. The intention behind the pilot trial was not to include as many freight forwarders as possible but only to involve a few who were large enough in volumesto make the pilot trial both meaningful and easily feasible.
2.2
City centre subdivided into zones
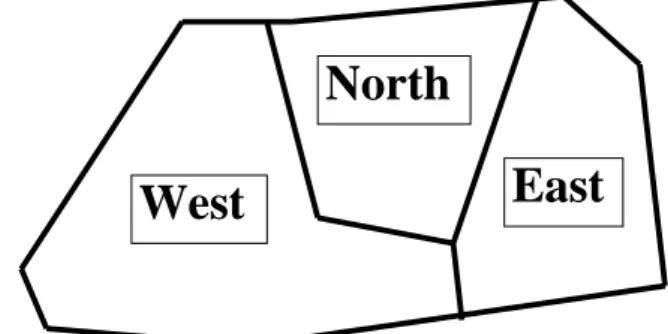
The basic idea behind the pilot trial was to divide the city centre in Linköping into zones; in this case a division into three zones was chosen (West, North and East) as there are three road carriers.
West
North
East
Figure 2 The city centre divided in three zones.
The principles for the partition of the city centre into zones were
• the zones should be of nearly equal size with regard to the amount of goods • in each zone there should be at least one big shopping mall
• the borders of the zones should be chosen in such a way as to give an efficient distribution.
To satisfy the first principle, it was necessary to make a survey of the three road carriers’ transports of goods to the city centre. For one week, data about shipments (amount and type of goods and delivery addresses) and distribution routes (driven kilometres and arrival and departure times for the loading bays) was collected. The data collected in the survey comprising copies of the consignment notes completed by the drivers with information about times was also used in the comparison studies (without and with co-ordinated distribution) to describe the effects of co-ordinated distribution. As an example of the last principle, when the borders were chosen it was necessary to take the traffic regulations for lorries into consideration.
Using these three principles above, the road carriers together worked out the borders of the zones for the partition of the city centre, which was used in the pilot trial.
2.3 The
trial
period
The trial period was nine weeks. The reason for choosing a long period was that we wanted to study the effects of learning and also that we should get enough data to reach correct conclusions from the trial. Nine weeks also made it possible to divide the period into three sub periods of three weeks. The advantage was that we let each freight
forwarder deliver goods to each zone (but each freight forwarder delivers only to one zone during the same three-week sub-period). In that way, effects which specifically depend on the freight forwarder, can then be separated and studied.
2.4 Consolidation
centre
The transhipment of goods requires both floor space for sorting the goods and loading bays during a limited time. In this case, the time window for unloading, sorting and loading, is the time between about 7.30 and 10.00. At this time of the day, the capacity utilization of the terminals is extremely low and the marginal cost of the utilization of terminals is, in principle, zero. During the pilot trial Schenker’s terminal was used without charge as a consolidation centre. The charge should be reasonably low in a permanent system.
2.5 Goods
Both parcels and mixed cargo were distributed to the shops in three big malls, while to other shops and firms, only mixed cargo (no parcels) was distributed. Goods with cash on delivery and very expensive goods (e.g. alcohol and clothes) were also excluded from the pilot trial.
The definition of mixed cargo is a somewhat different for the three freight forwarders. In the pilot trial, the freight forwarders applied their own usual definition. This was best solution because of the procedures for the sorting of the goods at their own terminals.
There is also a need for standard procedures for liabilities, receipts and notifications of missing goods, damaged goods, theft and claims. There was a mutual understanding about how this should be handled in the pilot trial and it was formalized in a written agreement. The agreement says that everything should be handled by the original forwarding agent. The insurance companies confirmed that the content of the agreement ensured that the goods were insured.
2.7 The
retailers
When shopkeepers buy their goods, the freight is nearly always free of charge. Most of the goods are delivered direct inside the shops by the freight forwarder, only sometimes do they leave the goods at the loading bays. Pooled goods receptions are no longer used. Shop assistants should concentrate on selling and devote as little time as possible to other things. If the shopkeeper is not satisfied with the delivery service, it is possible that the supplier chooses another forwarding agent. Further, if the shopkeepers are not satisfied with the coordinated distribution, it is plausible that the forwarding agents will leave the coordinated distribution system.
This was the reason that we contacted the retailer organisations at a very early stage of the project. If they had received incomplete information about the forthcoming
distribution project from others, there was an obvious risk that they would refuse to participate.
At the discussions with the retailer organisations, some of the advantages of coordinated distribution were identified. We also had opportunities to take part in some retailer meetings and they also informed the shop keepers about the project at their local meetings and in their newsletters for shopkeepers. The retailers also helped us to carry out a survey about if the coordinated distribution increases the shops efficiency in goods reception etcetera.
In connection with the start of the pilot trial new information about the project was needed for the shopkeepers. The information channels which were used were mainly the retailer organisations networks, but also the lorry-drivers (for some small shops outside the malls).
A brochure about the pilot trial was used to inform the shopkeepers. In this brochure there was information that one of the lorry-drivers from Schenker, DHL or Posten would deliver goods from all three and that the period for the trial would be from 29 March until 28 May. There was also a very short description of the trial and
information that the Linköping local authority, VTI, forwarding agents, carriers and the retailer’s organisation supported the project. In addition, names and phone numbers for contacts for each forwarding agents and the project leader were given. In case anyone wanted to read about the project, an address to the homepage of Samlic was given (Eriksson 2003).
The retailer organisations distributed the brochure to the retailers before the pilot trial and the lorry-drivers distributed it, if necessary, at the beginning of the trail. Many of the retailers were happy with only brief oral information. They thought they already knew Samlic enough from earlier information and on the whole had a very constructive attitude to the project.
2.8
Performance of the distribution
One week before the pilot trial started, the drivers were informed by their carrier and/or their forwarding agent and a member of the research group about the routines which were to be applied during the trial period. This included routines at
• their own terminal and the Samlic terminal
• management of consignment notes and scanning of goods • information about Samlic for retailers and goods’ receiver • handling of the new fill-in fields on the sticky labels.
The reason for informing the drivers in groups is that the management of consignment notes and scanning of goods is different for the three forwarding agents. To inform them in one common group would have been both inefficient and would also caused
confusion.
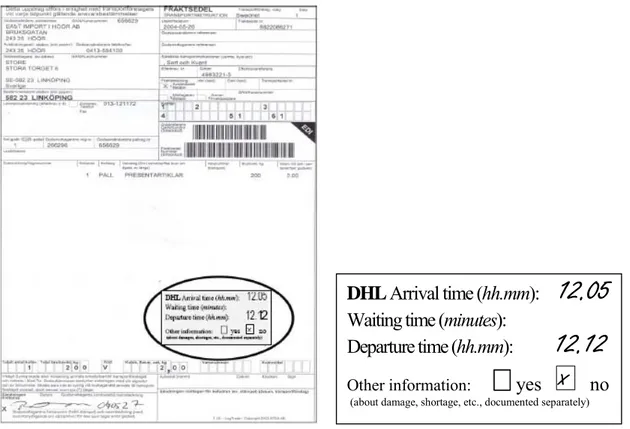
Before the lorries went to the consolidation centre terminal (Schenkers terminal was used), sticky labels ware attached on the front page of each consignment note. The sticky label contained information about which forwarding agent was the owner of the goods (pre-printed) and also four fill-in fields, see figure 3. Information to be filled-in by the driver was the time of arrival at the loading bay, waiting time (if any) at a loading bay, and the time when the driver leaves the loading bay. Additionally, if there is any additional information (yes or no) of interest. If there is any additional information the driver reports it in accordance with the routines normal to the forwarding agent or orally in person at arrival at the consolidation centre.
The front page of the consignment note itself always contains information about • the name of the addressee
• the recipient address
• the number of goods units in the consignment • the total weight of the consignment (in kilograms).
Other information which was not used in the appraisal was also available on the front page, e.g., for non-parcels there is also information about the actual type of commodity.
DHL Arrival time (hh.mm):
12.05
Waiting time (minutes):
Departure time (hh.mm):
12.12
Other information: yes X no
(about damage, shortage, etc., documented separately)
Figure 3 Front page of the consignment notes including sticky label.
At the consolidation centre the goods and consignment notes were sorted according to destination zone (see Figure 4). The lorry-drivers took care of the reloading at the consolidation terminal by themselves and no extra personnel were needed. During the trial, one member of the research group was there to do the copying of the sticky
labelled consignment notes when the drivers returned from the distribution route, and to put the data from the copies into a database.
During the drive, the lorry-driver completed fill-in fields on the sticky label with the arrival time, waiting time and leaving time for each stop (loading bay). After the drivers had delivered all the goods, they returned to the consolidation centre again, copied the consignment notes (including the sticky labels) and split up the consignment notes according to the respective forwarding agent. Finally, the carriers brought the consignment notes back to the respective forwarding agent. The copies, which were only used in the research, were used to construct a database for the project.
Figure 4 Transport pattern with coordinated distribution.
Figure 4 above shows the transport pattern for coordinated distribution when the three carriers each drive in one third of the city centre. Each zone normally requires two routes per day.
Figure 5 Front-paper and fill-in form.
Before each route the driver filled in a front-page with information about the date, lorry registration number, forwarding agent, zone, and if it was the first or the second route, see Figure 5. The time of arrival at the consolidation centre and the number of pallets with goods unloaded at the consolidation centre were also filled in on the form. The driver also filled in the time when the lorry left the consolidation centre and how many pallets were loaded on the lorry.
At the first and last stop (loading bay) on the route, a meter reading of kilometres driven was filled in, alternatively, the total driven kilometres between the first and the last stop. Information about breaks (e.g. for lunch), if any, must also to be filled in. In this way, it is possible to eliminate the effects of these breaks, or keep them separate, in the analysis of the co-ordinated distribution system. Information about damage and other comments should be filled in at any convenient opportunity, or alternatively, it could be notified on the consignment note according to the normal routines of the carrier.
When carrying out the survey, the collection of data procedure should not influence the distribution too much. The consequence of this requirement is that the lorry-driver
3
Results of the pilot trial
There were some problems in the beginning due to the different oral informal
agreements between the carriers and the retailers about the time when the goods should be delivered to the shops. These problems were easily solved, with one exception. For this exceptional case, the regular carrier delivered the retailer’s goods separately to manage to fulfil the retailer’s request for a very early delivery. It should be considered successful that it was only one retailer in the city centre that could not take part in the pilot trial. This exception had no effect on the results of the pilot trial.
It should be noted that the lorry-drivers’ great enthusiasm and good work explain a lot of the success of the pilot trial. They participated in some planning meetings for the trial and, with good reason, felt that they took a very active part in an important project. There were several interested parties in the pilot trial, such as the municipality (reducing the traffic of heavy vehicles in the city), the transport branch (improvement of the efficiency of the distribution i.e., increased profitability) and the goods receivers in the city (fewer disturbances from goods deliverers, increased profitability).
To evaluate the effects of coordinated distribution, the following parameters for the central part of the city were computed:
• total driving-time • total distance covered
• total number of stops (for unloading) • total stop-time
• total amount of transported goods (weight) • average loading factor.
These parameters can be used to describe the efficiency of the distribution. Furthermore, the first three can be used to describe how the traffic is influenced by distribution. The total number of stops can also be considered as an indicator of how much the retailers are disturbed by receiving goods at their shops.
Besides the data from the nine weeks pilot trial, data was collected both before and after this period. In these cases the zone was not east, west or north, but the whole of the city centre. One aim with this was to make it possible to compare coordinated with non-coordinated distribution. Other aims were to test the methods for collecting data before the trail and to verify some conclusions of the pilot trial. The main method for analysing the effects of coordinated distribution was to compare real coordinated distribution with modelled non-coordinated distribution during the pilot trial period.
3.1 The
database
The four data sources, see Table 1, which are used to build up the database are
described in the previous chapter. Other information could be oral reports by the drivers at arrival at the consolidation centre, information from the forwarding agent, etc.
Table 1 Source labels. Label Source
A Fill-in form
B Sticky label
C Consignment note
D Other information (from the lorry-driver, the forwarding agent, etc)
The database consists of two parts: one part describes the data which is unchanged during the route and the second describes the data for the delivery for each
consignment. There is a key, consisting of three variables, which connects these two parts.
Table 2 Variables for the routes
Variable Explanation Source
Date Date for the route A
Plate Number The plate number of the lorry which is used for the route A
Forwarding Agent The employer of the carrier A
Zone Zone of the recipient (East, West, North or City centre) A Route Number The route number for the carrier for the actual day (in the
pilot trial)
A Arrival Time Arrival time at the consolidation centre to unload A Unloaded Pallets The number of pallets from the forwarding agent to the
consolidation centre for distribution
A Departure Time Departure time from the consolidation centre A Loaded Pallets The number of pallets loaded on the lorry to be distributed
in the city centre
A
Km Out Meter reading at the first unloading place A
Km In Meter reading at the last unloading place A
Distance Covered Total distance between first and last unloading place A
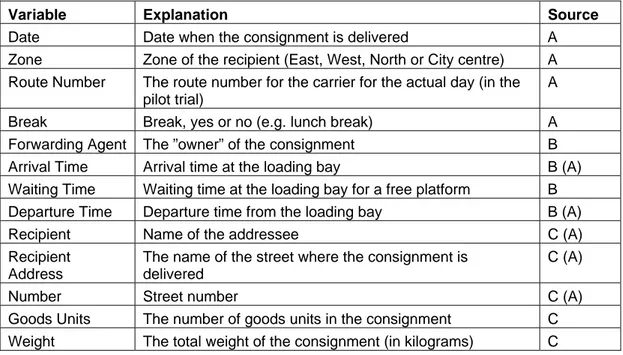
Table 3 Variables for the consignments.
Variable Explanation Source
Date Date when the consignment is delivered A
Zone Zone of the recipient (East, West, North or City centre) A Route Number The route number for the carrier for the actual day (in the
pilot trial)
A
Break Break, yes or no (e.g. lunch break) A
Forwarding Agent The ”owner” of the consignment B
Arrival Time Arrival time at the loading bay B (A)
Waiting Time Waiting time at the loading bay for a free platform B Departure Time Departure time from the loading bay B (A)
Recipient Name of the addressee C (A)
Recipient Address
The name of the street where the consignment is delivered
C (A)
Number Street number C (A)
Goods Units The number of goods units in the consignment C Weight The total weight of the consignment (in kilograms) C
The first three variables, Date, Zone and Route Number, work as a key in the database. This makes it possible to associate data for the route to the data for each consignment. To make it possible to store a break as a part of a route, in the same way as for a
delivery of a consignment, we prefer to include the information among the variables for the consignment. The variables for the break from (A) are Break and Recipient,
Recipient Address, Number, Arrival Time and Departure Time. An extract from this part of the database is shown in Table 4.
Table 4 Extract from the database – consignments.
Date Zone Drive Break For Agent Arrival Wait Depart Recipient Address No G U Weight
04-05-14 North 2 N Schenker 11:32 11:45 Indiska Tanneforsgatan 3 1 14 04-05-14 North 2 N Schenker 11:32 11:45 Indiska Tanneforsgatan 3 1 14 04-05-14 North 2 N DHL 11:32 11:45 Indiska Tanneforsgatan 3 3 3 04-05-14 North 2 N Schenker 11:32 11:45 Indiska Tanneforsgatan 3 1 15 04-05-14 North 2 N Schenker 11:42 11:45 Vattenfall Kungsgatan 23 5 69 04-05-14 North 2 N Schenker 11:42 11:45 Vattenfall Kungsgatan 23 1 296 04-05-14 North 2 N Schenker 11:47 11:49 NCC arb.plats Hamngatan 15 1 4 04-05-14 North 2 Y 12:00 12:55 Nya Tanneforsvägen 58
04-05-14 North 2 N Schenker 13:13 13:16 Expert Gyllen Nygatan 17 1 10 04-05-14 North 2 N Posten 13:13 13:16 Expert Gyllen Nygatan 17 5 04-05-14 North 2 N Schenker 13:22 13:40 Briobutiken Göran Dyks Gata 4 2 17 04-05-14 North 2 N Schenker 13:22 13:40 CD Media Göran Dyks Gata 4 5 39 04-05-14 North 2 N Posten 13:22 13:40 CD Media Göran Dyks Gata 4 11
3.2
City centre distribution
To study the effects of introducing coordinated distribution in the city centre, we will compare the following parameters: the number of stops at the loading bays, the time spent at the loading bays, the number of kilometres driven in the city centre, the driving time and the total time spent in the city centre. The time spent at the loading bays includes the time for unloading and delivery to the retailers. The waiting time for a free loading bay (in average only 2.6 minutes per day) and the time for any part of the drive from and to the consolidation terminal is not included here.
The forwarding agents are primarily interested in the reduction of the total time in the city centre, while the local authorities is more interested in the reduction of driven kilometres and driving time.
It is not possible to compare non-coordinated with coordinated distribution directly. We can either make the comparison directly with collected data but with different time periods or we can compare collected data for coordinated distribution with modelled data for non-coordinated distribution for the same time period. We will use both methods.
First we will compare the data from the nine weeks pilot trial with data collected after this period, see Table 5.
Table 5 Without/with coordinated distribution – a direct comparison of collected data.
Without With
coordinated distribution
Reduction
Number of stops at the loading bays (per day) 41.4 25.5 38 %
Total time at the loading bays (minutes per day) 458 373 19 %
Driven kilometres in the city centre (per day) 15.9 7.9 50 %
Total driving time (minutes per day) 111 62 44 %
Total time in the city centre (minutes per day) 569 435 24 %
The quantity of data collected after the pilot trial period corresponds to the quantity of data for one week in the pilot trial. No adjustments of data have been made before the comparison. Besides, drives without coordinated distribution in the city centre were often planned as parts of other drives in the city. Nevertheless, the results in Table 5 can be used for validation of a more ambitious approach with carefully collected data for only the pilot trial period.
Other variables can be used, for instance, the number of consignments, the number of goods units and the unloaded weight. These variables have been tested, both in
combination and separately. The tests show that the choice of the number of retailers at the loading bay was the best single choice and using more variables in the model did not give any significant improvement.
To study the effect of the drivers learning a new distribution system, a learning curve was constructed. It was expected that the distribution would go faster when they had worked with it for some weeks. However, the effect of learning was very weak, about one percent improvement (faster distribution dependent on learning) in total. Hence we will not include the time (e.g., the chronological order of the days in the pilot trial) in the regression model.
To compute α and β in formula (1) we use data from the 1 056 stops at loading bays in the pilot trial and a regression analysis gives the following values for the parameters:
α = 3.435 and β = 4.162 (2)
The parameter β can be understood as the average time for delivering the goods to a retailer and parameter α should be understood as the remaining time spent at the loading bay; stepping in and out of the lorry, preparing the lorry for unloading and departure etc. The error term ε is the difference between the real (time at the loading bayi) and the
modelled time (α + β × number of retailers at the loading bayi) spent at the stop.
To construct a table similar to Table 5 but for modelled values for the pilot trial period, we need to compute or estimate some explanatory variables, see Table 6. The case with coordinated distribution requires 1 056 stops to deliver all goods. By studying the consignment data in the pilot database, we find that it needs 1 548 stops if we separate the consignments on three forwarding agents. With the help of the pilot database, the average number of deliveries is also computed; 2 879 for the case with coordinated distribution (real) and 3 534 without (estimated). From Table 5, the number of average driven kilometres and driving time to the loading bays are computed. It is perhaps a bit surprising that the reductions are so small (from 0.384 to 0.310 kilometres and from 2.68 to 2.43 minutes respectively). On the other hand, this makes the model both stable and reliable.
Table 6 Values of the explanatory variables.
Without With
coordinated distribution Number of stops at the loading bays (nine weeks) 1548 1072
Number of receivings (nine weeks) 3534 2879
Average driven kilometres to the loading bays (minutes) 0.384 0.310
Average driving time to the loading bays (minutes) 2.68 2.43
The number of working days are 42 (three holidays) during the nine-week period. Then we get the number of stops per day in Table 7, by dividing the number of stops during the whole period given in Table 6 by 42.
Secondly, to compute the total time at the loading bays per day, we use the following model based on model (1), with the parametre values given by (2):
Total time at the loading bays per day = number of loading bays per day × (3) (α + average number of retailers at the loading bays × β)
To estimate the kilometres driven in the city centre per day, the number of loading bays per day are multiplied by the average number of kilometres driven to the loading bays. Multiplying the number of loading bays per day by the average driving time to the
loading bays gives the total driving time per day.
In Table 7 the total time in the city centre per day is defined by the sum of the total time at the loading bays and the total driving time. However, the estimated total time spent in the city centre also includes the waiting time.
Table 7 Without/with coordinated distribution – a comparison by help of modelling. Without With
coordinated distribution
Reduction
Number of stops at the loading bays (per day) 36.9 25.5 31 %
Total time at the loading bays (minutes per day) 477 373 22 %
Driven kilometres in the city centre (per day) 14.2 7.9 44 %
Total driving time (minutes per day) 99 62 37 %
Total time in the city centre (minutes per day) 576 435 24 %
It is surprising that the results shown in Table 5 (column Reduction) are so close to the results of Table 7. The method used to compute the results in Table 5 is very rough, data for one week directly compared without any adjustments with data for nine weeks. Thus, the results in the Table 7 should be considered as the real result of the pilot trial and the results in Table 5 should be considered as a validation of the results in Table 7. The great decrease of the variable “Number of stops at the loading bays” primary explains the reduction of the other variables. This explanation variable is also
convenient to examine before starting a new coordination distribution project; no pilot trials are needed and it is enough to study the consignment notes and use the local knowledge about loading bays.
However, when the drivers have to wait for some minutes (on one occasion, nearly half an hour) this causes stress. Furthermore, the stress factor was probably intensified when the occupied loading area was a part of a street and the waiting driver stopped the traffic. This was almost certainly the reason why the reduction of the waiting time was one of the purposes for introducing coordinated distribution.
3.4 Loading
factors
In some studies, amazing results can be seen when coordinated distribution is
introduced. However, such results are based on a loading factor, weight or volume, of nearly 100 %. In city centre distribution, it is generally not the loading factor with regard to weight which limits the amount of loaded goods, because goods distributed to retailers are generally not so heavy. The goods are loaded on pallets and it is rare that the pallets are paled, which means, that neither weight nor volume limits the amount of loaded goods.
Instead, it is the area of the flatbed of the lorry which limits the amount of goods, or more exactly, the number of pallets which can be loaded. Even this definition is more theoretic than practical as the driver needs some space to handle the unloading. The flatbed floor is used as a working place by the lorry driver; he should be able to reach the right goods at each stop. He should also be able to keep the goods and take them back to the forwarding agent, if necessary. The needed free area of the flatbed floor to handle the goods seems to decrease when the number of stops decreases. If we compare the pilot trial with the case of non-coordinated distribution, the use of the flatbed floor for delivering of goods increases by 30 %. Realistic results for the lorries which are used for city distribution are only obtained if the loading factor, with respect to the use of flatbed size, is also included. At least in the pilot trial we found that the size of the flatbed rather than the weight or volume loading capacity of the lorry limits the amount of loaded goods. The average lorry in the pilot trial had a loading capacity of 8 738 kilogram, 43 cubic metres and 18 pff (pallets on the flatbed floor).
Further, the average loaded weight per pallets is interesting. One effect of coordinated distribution is that the loaded weight per pallet increases. This is due to the fact that a retailer (sometimes) get goods from more than one forwarding agent in the same delivery. By comparing the data from the pilot trial with data which was collected after the trial, we conclude that the increased loading weight per pallets is 15 %.
The total effects, computed from real data, is that the loading factor increases by 50 % (1.30 × 1.15 = 1.50), from nearly 53 kg/pff to 79 kg/pff.
Figure 6 Increased loading of a lorry due to coordinated distribution.
51 kg / m
276 kg / m
2
It is not possible to give an exact conversion factor between the flatbed size in square metres and the capacity of the number of loaded pallets, as this depends on both the length and the width of the flatbed, but on average it was 1.04 m3/pff in the pilot trial. Applying this conversion factor on the weight per loading capacity of pallets on the flatbed floor, the loading weight increases from nearly 51 kg/m2 to 76 kg/m2(Figure 6). The effect of coordinated distribution can also be presented as values of the loading factors concerning pallets and weight, see Table 8. The loading factor (weight) increases from 10.8 % to 16.3 %, i.e., by 51 % (0.163 / 0.108 = 1.509).
Table 8 Loading factors - without/with coordinated distribution.
without with coordinated distribution
pallets/lorry 38.3% 50.1%
kg/pallet 28.3% 32.5%
kg/lorry 10.8% 16.3%
The conclusion is that the pilot trial shows that vehicle requirement decreases by a third when coordinated distribution is introduced (the amount of goods in each lorry
increases by fifty percent).
3.5 Consolidation
terminal
In addition to the actual distribution in the inner city, the activities at the consolidation terminal and freighting of goods to the terminal and the driving between the city centre and the terminal are important factors in a coordinated city distribution system.
It should be easy to reach the terminal so that it can receive goods from the forwarding agents and have enough capacity to avoid waiting times for the incoming lorries. There
Incoming goods from the forwarding agents were pre-sorted in the pilot trial. This made it possible for the lorry drivers themselves to manage the transhipments. The goods were driven from the local terminals of the forwarding agents to the consolidation terminal. However, in principle, all the goods consist of non-local consignments which have already been pre-sorted at another transhipment point before reaching Linköping. It would have been possible to change the pre-sorting routine at these transhipment points (except for the forwarding agent at the consolidation terminal) to avoid an extra transhipment in Linköping, but the cost of this change for a limited trial, such as the pilot trial, was too high.
3.6
Reflections and comments from the participants
A retailer survey was made to find their opinion of coordinated distribution and their experience of the pilot trial. The most common comment was that it is an advantage to only get one delivery per day instead of up to three. They were not disturbed so often by receiving goods. To sum up, the positive comments were
• they get one delivery per day instead of up to three • they get the deliveries at about the same time each day • they get deliveries earlier
• they get to know the driver. One negative comment was
• the goods were delivered at the wrong place
By wrong place it means the goods were delivered to the shop instead of to the loading platform, or vice versa. In general, all 440 retailers but one were positive to coordinated distribution (the unenthusiastic one missed the track and trace possibility in the last link of the supply chain).
Interviews with the lorry drivers were made after the pilot trial. Most answers were expected, but two opinions were new: The relations to the retailers became better (perhaps depending on more consignments per delivery) and the working environment becomes better due to fewer stops (not jumping in and out of the lorry so often). All drivers were positive to coordinated distribution.
At a presentation for the Linköping City Executive Board the politicians were positive to the project as one of the tools to solve the expected increasing congestion and increasing exhaust emissions depending of a forthcoming expansion of the city centre. The board asked if they could be of any help in realising the implementation of the coordinated distribution system.
Both the carriers and the local forwarding agents would have preferred to continue with the coordinated distribution as soon as possible. They would introduce it stepwise toward a permanent system, with a working administrative and information transfer system. They were convinced that coordinated distribution is economically profitable.
4 Samlic
Information about plans to start a coordinated distribution system for Linköping was sent to all the forwarding agents and carriers in their local network. The four biggest forwarding agents (Schenker, DHL, Posten and DFDS) and their four related carriers wanted to start up immediately. Others preferred to join later. The project research group was strengthened with a logistic consult from the transport branch. The interested forwarding agents and carriers established a working group together with the research group to construct a concept for coordinated distribution in Linköping which also could be applied in other cities. The results are presented below.
The tasks for the distribution company Samlic are
Table 9 The tasks for Samlic.
TERMINAL HANDLING DISTRIBUTION ADMINISTRATION
Goods reception Loading at the terminal Information
Deviation handling Unloading at the retailers Transport management Sorting incoming goods Returning goods Invoicing – Settlementing Removal of goods
(terminal)
Deviation handling Complaint unravelling Loading material
management
Unloading at the terminal Loading material management
Loading material
management
The forwarding agents wanted a concept which could be used in other cities too, not only in Linköping. It would be inefficient for them to have totally different solutions for different cities. A common concept means uniformity and clearness, but it should allow for local solutions for different cities. The type of model which makes this possible is franchising. The forwarding agents establish a common company which is the owner of the concept and the technical and the administrative systems. The common company also should sell some service, besides the concept including technical and
administrative systems, to the local companies in the cities.
The legal form of the local company could be different in different cities. The owner constellation of the local company can also be different. In Linköping, both the carriers and the forwarding agents agreed that the carriers should be the owners. Agreements (texts) have been formulated between Samlic and (i) the carriers, (ii) the forwarding agents and (iii) the owner of the terminal (only a part of the terminal is used as a Samlic consolidation terminal).
To start with, the Schenker terminal will be used as a consolidation terminal. The drivers will take care of the unloading, the sorting and the removal of goods at the terminal and loading. Schenker’s sorter can be used for parcels. If needed, staff from Schenker can be hired to manage the terminal handling. Room for short term storage (a few days) is available. In the long run, it is possible that Samlic will have its own consolidation terminal.
The creation of a detailed document about operational instruction was one important task for the working group. Delivery, complaints and loading material management routines are administrative routines which have to work very well, because several partners are involved in the Samlic distribution system.
Pricing by performance is the basic principle in the debiting and deduction model. The price should be based on the real costs for delivering a consignment of a specific weight. The external customers’ (external freight forwarders) prices are also increased by a calculated profit. The real costs for the company Samlic consist of the costs for the vehicles, the drivers, the terminal, the IT system and the administration system and the transports from the local terminals of the forwarding agents to the Samlic consolidation terminal. These costs are divided between the partners due to contracts and agreements. Samlic should debit the freight forwarders and pay the carriers.
The four forwarding agents have different systems to transmit data about the
consignments from the lorries to their IT systems and also different demands regarding track and trace facilities, e.g., that a customer should have the possibility to check the status and where a specific consignment is via Internet. Hence, the lorries have to send information about each delivery of each consignment both to the Samlic terminal (for debiting/deduction, this does not have to be sent immediately) and to the right
forwarding agent (for debiting their customers and for track and trace, this needs to be sent immediately). One way to solve this problem is to let each lorry carry all the different existing equipment (one piece of equipment per forwarding agent) with them. Another one is to develop equipment which can be used to send the information to the right forwarding agent automatically (and to the Samlic terminal). This latter approach is to be prefered because it causes less work for the drivers. A specification of
requirements for this approach has been written.
The effects of introducing a consolidation terminal in the distribution system do not mean that all the goods have to be reloaded an extra time. In principle, all the goods consist of non-local consignments which have already been pre-sorted at a transhipment point before Linköping. It would be possible to change the pre-sorting routines at these transhipment points, in principle the city Jönköping for Posten, the city Norrköping for DHL and DFDS and in Linköping, Schenker (whose terminal is used as the
consolidation terminal). This is certainly a simplified description of the logistics chains, but it is possible to avoid an extra transhipment in Linköping for most of the goods. Coordinated distribution makes it possible to rationalise the goods’ reception at the malls. An examination of one mall (44 retailers) has shown that coordinated distribution combined with an IT system which alerts the retailers to incoming goods beforehand make it possible to reduce the time for the stay of the lorry by 1 – 2 hours. The retailers are positive to this because they also save time by better planning of the goods
reception.
Other decisions which were taken by the working group were that: • the vehicles should be ornamented to market Samlic
• the drivers should be educated, they represent four different forwarding agents • the authorities should change the traffic regulations to suit coordinated distribution • the extending of Samlic to a specific mall (IKANO) outside the city should be
examined
Finally, the most important result reached by the working group was the magnitude of the economic profitability of the Samlic system. The goods which are to be distributed by Samlic for the suggested area of the city centre require six lorries with coordinated distribution and nine without. Consequently, the saving is three lorries. But the
additional costs for Samlic (the terminal, the administration etcetera) corresponds a cost for 1.3 lorries. The result is that the net saving is 1.7 lorries (or 20%).
Locally, all parts would like to start the Samlic project as soon as possible and accept temporary solutions. Two of the local forwarding agents have also got the power of attorney from their parent organisations to negotiate the conditions to take part in Samlic. The decision of the first local forwarding agent was to take part in Samlic and the decision of the second was to participate if at least two of the other forwarding agents would take part in the project.
The research group and the actual local forwarding agent made separate presentations of the project to the parent organisation for the other two. The research group had two meetings with the first parent organisation. The problem was the IT system for
deliveries. They were busy introducing a new system by their own, and therefore could not accept a temporary IT solution in Samlic and they would not like to be part of Samlic for the next two years.
The second parent organisation was positive to the project but would think it over for a month. They probably also contacted their international parent organisation. Their decision was to not take part in the project. The reason was the trademark: the carriers should show the trademark of the forwarding agent on the lorries and coordinated distribution does not allow that.
The lack of a working IT system and the trademark aspects were the reasons why this particular project was not completed within the given time frame and has not yet been implemented.
5 Conclusions
The project showed that, in Linköping, the time used for unloading at the loading bays is decreased by a fifth and
The driving kilometres (and driving time) in the city centre can be reduced to 50%.
The effect of this is that the total time for distribution in the city centre decreased by a fourth, i.e., in the city centre, the total time for the lorries is reduced to 3/4. Another important result of the project is that the loading factor increased with fifty percent when coordinated distribution was used. Thus, the number of lorries needed can be reduced to 2/3.
If the number of lorries is reduced to 2/3 then the time for each lorry in the city centre will be (3/4)/(2/3) = 9/8, i.e., in the city centre, the time for each lorry will only increase by 1/8 (12.5%). The total increase in time is clearly less than 12.5% because the total time also includes the time to load the lorry at the consolidation terminal and the drives between the city centre and the consolidation terminal.
Including the extra costs for unloading and loading at the consolidation terminal and the cost for an additional administration system, economically,
The total net savings for the freight forwarder is about 20%.
The process of trying to implement the proposal for a functional coordinated
distribution system for Linköping has provided a lot of new experience and knowledge. The introducing of a coordinated distribution system has never been considered
seriously at a national level before. The system of a joint venture in goods distribution collaboration is economic profitability, logistic efficient and persistent and friendly to the environment.
The lack of a working IT system and trademark aspects were the reasons why this particular project was not completed within the given time frame and has not yet been implemented.
There have been some trials of consolidation centres and urban distribution centres as well as a few implementations (BESTUFS project database, n.d.). In this project, (Eriksson 2003 and Eriksson et al., 2006), the background factors about goods distribution collaboration in cities and its effects are also identified and discussed. Hence Samlic is an important contribution to the research and the increasing of knowledge in this field about urban distribution.
References
BESTUFS project database, n.d., Shaping the future: careers in architecture. Retrieved February 22, 2007, from <http://www.bestufs.net>/Project search/Theme: Urban freight platforms.
Eriksson, Jan, Karlsson, Rune, Fors, Tobias, Fredholm, Olof, Lång, Anna-Maria & Svensson, Tomas, 2006. SAMLIC – The Pilot trial. VTI rapport 536. Statens väg- och transportforskningsinstitut. Linköping (in Swedish, summary in English).
Eriksson, Jan, Lundgren, Bertil & Svensson, Tomas, 2006. Implemention of SAMLIC – The Proposal and the Process. VTI rapport 528. Statens väg- och transportforsknings-institut. Linköping (in Swedish, summary in English).
Eriksson, Jan, 2003. Samlic. Retrieved February 2007, from <http://www.vti.se/samlic>.
Ljungberg, David & Gebresenbet, Girma, 2004. Mapping out the potential for
coordinated distribution in city centres: The case of Uppsala, International Journal of
www.vti.se vti@vti.se
VTI är ett oberoende och internationellt framstående forskningsinstitut som arbetar med forskning och utveckling inom transportsektorn. Vi arbetar med samtliga trafikslag och kärnkompetensen finns inom områdena säkerhet, ekonomi, miljö, trafik- och transportanalys, beteende och samspel mellan människa-fordon-transportsystem samt inom vägkonstruktion, drift och underhåll. VTI är världsledande inom ett flertal områden, till exempel simulatorteknik. VTI har tjänster som sträcker sig från förstudier, oberoende kvalificerade utredningar och expertutlåtanden till projektledning samt forskning och utveckling. Vår tekniska utrustning består bland annat av körsimulatorer för väg- och järnvägstrafik, väglaboratorium, däckprovnings-anläggning, krockbanor och mycket mer. Vi kan även erbjuda ett brett utbud av kurser och seminarier inom transportområdet.
VTI is an independent, internationally outstanding research institute which is engaged on research and development in the transport sector. Our work covers all modes, and our core competence is in the fields of safety, economy, environment, traffic and transport analysis, behaviour and the man-vehicle-transport system interaction, and in road design, operation and maintenance. VTI is a world leader in several areas, for instance in simulator technology. VTI provides services ranging from preliminary studies, highlevel independent investigations and expert statements to project management, research and development. Our technical equipment includes driving simulators for road and rail traffic, a road laboratory, a tyre testing facility, crash tracks and a lot more. We can also offer a broad selection of courses and seminars in the field of transport.