O N P H Y S I C A L R E L A T I O N S I N D R I V I N G :
J U D G E M E N T S , C O G N I T I O N A N D P E R C E P T I O N
Gabriella Eriksson
On Physical Relations in Driving:
Judgements, Cognition and Perception
© Gabriella Eriksson, Stockholm University 2014 Cover illustration by Cecilia Eriksson
ISBN 978-91-7447-855-6
Printed in Sweden by US-AB, Stockholm 2014
Abstract
Drivers need to make judgements of physical relationships related to driving speed, such as mean speed, risks, travel time and fuel consumption, in order to make optimal choices of vehicle speed. This is also the case for the gen-eral public, politicians and other stakeholders who are engaged in traffic issues. This thesis investigates how drivers’ judgements of travel time (Study I and II), fuel consumption (Study III) and mean speed (Study IV) relate to actual physical measures.
A cognitive time-saving bias has been found in judgements of travel time. The time saving bias implies that people overestimate the time saved when increasing speed from a high speed and underestimate the time saved when increasing speed from a low speed. Previous studies have mainly investigat-ed the bias from a cognitive perspective in questionnaires. In Study I the bias was shown to be present when participants were engaged in a driving simulator task where participants primarily rely on perceptual cues. Study II showed that intuitive time saving judgements can be debiased by presenting drivers with an alternative speedometer that indicate the inverted speed in minutes per kilometre.
In Study III, judgements of fuel consumption at increasing and decreas-ing speeds were examined, and the results showed systematic deviations from correct measures. In particular, professional truck drivers underesti-mated the fuel saving effect of a decrease in speed. Study IV showed that subjective mean speed judgements differed from objective mean speeds and could predict route choice better than objective mean speeds. The results indicate that biases in these judgements are robust and that they predict be-haviour.
The thesis concludes that judgements of mean speeds, time savings and fuel consumption systematically deviate from physical measures. The results have implications for predicting travel behaviour and the design of driver feedback systems.
Keywords: Time saving bias, fuel consumption, route choice, mean speed, speed choice, time gain, driver judgements
Sammanfattning
Förare bör göra bedömningar som relaterar till hastighet, såsom bedömning-ar av medelhastighet, risk, restid och bränsleåtgång. Dessa bedömningbedömning-ar är nödvändiga för att föraren ska kunna välja en optimal hastighet, men också för att allmänheten, politiker och andra intressenter som är involverade i trafikfrågor ska kunna fatta välgrundade beslut. Denna avhandling består av fyra delstudier där förares bedömningar av restid (Studie I och II), bräns-leåtgång (Studie III) och medelhastighet (Studie IV) studeras i relation till faktiska fysikaliska mått.
Tidigare enkätstudier har påvisat ett kognitivt bias i tidsvinstbedömningar vid höga och låga hastigheter som påverkar mänskligt beteende. Studie I visade att detta bias också förekommer i en primärt perceptuell motorisk uppgift där förarna i studien kör i en körsimulator. Studie II visade att dessa intuitiva tidsbedömningar kan förbättras genom att köra med en alternativ hastighetsmätare i bilen som indikerar den inverterade hastigheten i minuter per kilometer istället för hastigheten i kilometer per timme.
I Studie III undersöktes bedömningar av bränsleåtgång vid hastighetsök-ningar och hastighetssänkhastighetsök-ningar, och resultaten visar att bedömhastighetsök-ningarna systematiskt avviker från faktisk bränsleåtgång. Ett intressant resultat var att lastbilsförare i allmänhet underskattade bränslebesparingen som kan göras till följd av en hastighetssänkning. Studie IV visade att subjektiva bedöm-ningar av medelhastighet som avviker från objektiva medelhastigheter kan predicera vägval, vilket tyder på att systematiska fel i dessa bedömningar är robusta och kan predicera vägval.
Sammanfattningsvis visar avhandlingen hur bedömningar av medelhas-tighet, tidsvinst och bränsleåtgång systematiskt avviker från fysikaliska mått. Resultaten har betydelse för modellering av resebeteende och design av fö-rarstödssystem.
Acknowledgements
My dream of a research career was only just a dream until my path crossed the path of a humble gentleman at the department – Professor Ola Svenson. Thank you for your guidance and for sharing your vast knowledge and expe-rience, but most of all; thank you for believing in me. I also owe my grati-tude to my supervisors Professor Timo Mäntylä and Dr. Christopher Patten, you were both always ready to lend a helping hand. Dr. Lars Eriksson, you gave me the courage to try my own ideas. Professor Björn Lyxell, I still hear you in the form of an inner voice telling me that I should be wary of my time.
Associate Professor Jan Andersson, Research Director at VTI, you gave me the opportunity to follow my own research interests and somehow you always find the time to read all my manuscripts. Also at VTI, Dr. Selina Mårdh, thank you for keeping track of the money in my research project. I have been a part of a dream team with great researchers from various disci-plines at VTI. Thank you all, it is truly inspiring to have such excellent col-leagues!
I am also grateful to my research unit at the department for all the input and discussions; Assistant Professor Ilkka Salo, who always brings sunshine from the southern parts of Sweden, Dr. Marianne Jakobsson, Nichel Gonza-lez and Professor Torun Lindholm.
Professor Mats E. Nilsson, you are one of the best lecturers I have had during my years in academia. Thank you for taking me in when I was be-tween jobs. During my time at the Gösta Ekman laboratory I also got to know some great researchers and colleagues: Dr. Anna Lindqvist, Professor Birgitta Berglund, Britth Sandin, Catherine Sundling, Dr. Jesper Alvarsson, Professor Maria Larsson, Maria Rådsten Ekman and Dr. Martin Arvidsson.
Ivo Tudorov, my roomie and possibly the coolest guy at the department. Thank you for all the interesting discussions and words of wisdom. Also, special thanks to the cognitive psychology division and Associate Professor Fredrik Jönsson, Kristina Karlsson, Veit Kubik and Max Larsson Sundqvist. I would also like to thank my dear friend and fellow PhD student Lena Låstad. You always find the time to listen to my stories and give me great advice. Dr. Neda Kerimi, you once told me that I showed research potential and that really encourage me in my pursuit of a PhD position.
I would also like to express my gratitude to Professor Birgitta Berglund and Professor Carl Martin Allwood for commenting on an earlier version of this thesis.
My doctoral studies were supported by funds from the FFI project EFESOS. I would like to thank all of you who were involved in the project and especially the project managers at Volvo; Claes Edgren and P-A Jör-gner. It has been a pleasure working with you.
Last but not least, I would like to thank my family and friends outside of academia. Special thanks to Björn, Charlotte, Disa, Hedwig, Ingeborg, Ingmar, Martin and Sebastian for understanding when I am absorbed by science and for all the good times and laughs. I am also thankful to my par-ents who have always encouraged me in all my endeavours and my sister, Cecilia, who has supported me through thick and thin for all my life. Also thanks to our gems, Lina and Issak, for reminding me to play! Tata Baggi vous aime.
List of Studies
The present doctoral thesis is based on the following four studies:
Study I. Eriksson, G., Svenson, O., & Eriksson, L. (2013). The time saving
bias: judgements, cognition and perception. Judgment and Decision Making, 8(4), 492-497.
Study II. Eriksson, G., Patten, C.J.D., Svenson, O., & Eriksson, L. (2014).
Estimated time of arrival and the time saving bias (submitted).
In abbreviated form: Eriksson, G., Svenson, O., & Eriksson, L. (2014). Debiasing time saving
judgements by manipulation of speed display. In D. de Waard, K. Brookhuis, R. Wiczorek, F. di Nocera, P. Barham, C. Weikert, A. Kluge, W. Gerbino, & A. Toffetti. (Eds.), Proceedings
of the Human Factors and Ergonomics Society Europe Chapter 2013 Annual Conference (in progress).
Study III. Eriksson, G., & Svenson, O. (2014). Driving faster or slower?
Speed changes and judged effects on fuel consumption (submitted).
In abbreviated form: Eriksson, G., & Svenson, O. (2012). Driving faster or slower? Biased
judgments of fuel consumption at changing speeds. In N. Stanton. (Ed.), Advances in human
aspects of road and rail transportation (pp. 293-297). London: CRC Press.
Study IV. Svenson, O., Eriksson, G., Salo, I., & Peters, E. (2011).
Judg-ments of mean speed and predictions of route choice. Transportation Re-search Part F: Traffic Psychology and Behaviour, 14(6), 504-511.
Contents
1. Introduction ... 15
1.1 Bounded Rationality ... 17
1.1.1 Heuristics and Biases ... 17
1.1.2 Debiasing Judgements ... 18
1.2 Speed and Time ... 22
1.2.1 Perception ... 22
1.2.2 Cognition ... 23
1.3 Driving Parameters ... 27
1.3.1 Fuel Consumption ... 27
1.4 Information Systems ... 27
2. Aims of the Thesis ... 29
3. Summary of the Studies ... 30
3.1 Study I The Time Saving Bias: Judgements, Cognition and Perception 31 3.1.1 Background and Purpose ... 31
3.1.2 Method ... 31
3.1.3 Results and Discussion ... 32
3.2 Study II Estimated Time of Arrival and the Time Saving Bias ... 33
3.2.1 Background and Purpose ... 33
3.2.2 Method ... 33
3.2.3 Results and Discussion ... 34
3.3 Study III Speed Changes and Judged Effects on Fuel Consumption ... 35
3.3.1 Background and Purpose ... 35
3.3.2 Method ... 35
3.3.3 Results and Discussion ... 35
3.4 Study IV Judgments of Mean Speed and Predictions of Route Choice ... 37
3.4.1 Background and Purpose ... 37
3.4.2 Method ... 37
3.4.3 Results and Discussion ... 38
4. General Discussion ... 39
4.1 Does the time saving bias apply to active driving? ... 39
4.2 Can the time saving bias be debiased? ... 40
4.3 How does judgements of fuel consumed relate to actual fuel consumption at different speeds? ... 41
4.5 Can mean speed judgements predict choices? ... 43
4.6 Concluding Remarks ... 44
4.7 Future Research ... 45
15
1. Introduction
Transportation is vital to our modern society and its development, and mil-lions of people travel on our roads daily. The government of Sweden has decided to set a long term goal for zero tolerance of fatal accidents in traffic; aiming at reducing accidents (Breen, Howard & Bliss, 2008; SFS, 1997, 2003). Traffic research has strived for a better understanding of why drivers decide to engage in risky behaviour, such as speeding. An increased knowledge of driver behaviour is essential when planning and taking actions to prevent accidents.
Behavioural decision research has to a large extent been focused on nor-mative theories that aim to predict behaviour. Nornor-mative theories assume that the decision maker is a rational agent (Einhorn & Hogarth, 1992), but their models are not always consistent with actual behaviour. The gap be-tween actual and normative behaviour, and why and if such a gap exists, has been the main topic of behavioural decision making research for decades (Kahneman, Slovic & Tversky, 1982; Gilovich, Griffin & Kahneman, 2002) and is also the theme of this thesis. In the present thesis the normative mod-els are derived from the laws of physics, providing physical measures of driving-related components such as speed, travel time and fuel consumption.
The general purpose of the present thesis is to contribute to behavioural judgement and decision making research by exploring how judgements can be described and how they deviate from physical measures and if so, how these judgements can be aided and if they can predict behaviour. Another purpose is to contribute to applied research on driver behaviour. Driver be-haviour is of importance from both an accident prevention perspective and an environmental perspective, since driving speed is associated with accident risk as well as fuel consumption. In order to make optimal decisions about driving speed, risk and fuel consumption, it is important that the driver has an accurate understanding of how these factors are related in the physical world.
An increased knowledge of judgements and biases is needed to make more accurate predictions of behaviour, but also to be able to aid people in making better judgements.
16
Keren (1990) used an analogy with a physician to illustrate this point:
Few would challenge the assertion that a correct diagnosis is an essential first step for curing an illness. A necessary requirement for being a good physician is the ability to make an accurate diagnosis; only then would we expect the physician to prescribe the right treatment and monitor the recovery, eventually changing the treatment if necessary (p.523).
The more we learn about biases in drivers’ judgements, the better chance we have of actually finding tools to ameliorate these biased judgements.
The more specific objective of the thesis is to explore how people’s judgements, made when driving as well as when not driving, of driving-related components map onto the actual physical measures. To specify, how does a temporary speed reduction affect the mean speed? How much time can be gained by a speed increase? How does a speed increase affect the fuel consumed? Normative theories assume that a driver is rational in the choice of speed acting on perfect information about these physical relations. A driv-er’s choice of speed is partly based on an evaluation of the consequences of speeding. If the positive consequences outnumber the negative consequenc-es, the driver will choose to speed up (Lawton, Parker, Stradling & Man-stead, 1997). In order for the driver to be able to make an optimal choice of vehicle speed, it is important that the consequences that lay the foundation of that choice mirror actual consequences. This is not only important for the individual driver, but also to the general public and politicians who base their norms and opinions about driving, speed limits and traffic planning on judgements of speed, risks at different speeds and fuel consumption (Sven-son, Eriksson & Gonzalez, 2012).
When drivers, the public and politicians form their norms and opinions about driving, speed limits and traffic planning, they typically base their views on attitudes and implicit or explicit judgements of stopping distances, risks at different speeds etc. At best, these judgements are based on formal calculations, but often they are unaided more or less intuitive estimates. To exemplify, if judgements of how fast a car can be stopped from different speeds are biased, then discussions and decisions about speed limits will also be biased. Hence, it is important to know how people estimate how fast the speed of a car can be reduced from different speeds. This is relevant for un-derstanding debates about speed limits, speeding and attitudes towards speeding and to know how to present information about facts to prevent bi-ased views in the debate.
The particular aims of this thesis are to investigate how judgements of travel time (Study I and II), fuel consumption (Study III) and mean speed (Study IV) relate to actual physical measures. In Study I and II, time saving
17
judgements are used to predict driver behaviour. In Study IV, mean speed judgements and predictions of route choice are investigated. Study II also investigates how time saving judgements can be improved by changing in-formation format so that it better fits the drivers’ needs.
1.1 Bounded Rationality
Early normative decision theories were built on the foundation of rationality and optimality, viewing the individual as an “economic man” who has per-fect and complete knowledge of his or her environment and a stable prefer-ence system that allows optimal choices (Einhorn & Hogarth, 1992). In the traditional model of rational choice, the decision maker is seen as a “rational agent” that chooses options after assessing the probabilities of options and evaluating the associated utility. The final decision is the outcome of a com-bination of the two assessments (Gilovich, Griffin & Kahneman, 2002). Si-mon (1955) was critical of the traditional economic theories and coined the term bounded rationality to emphasise that individuals lack the ability to make complex calculations among alternative options which are required in order to make optimal choices. This is due to cognitive limitations that sometimes result in non-rational behaviour which deviates from the norma-tive models (Payne, Bettman & Johnson, 1992). Moreover, in his theory of bounded rationality, Simon (1990) stressed the importance of perceptual, cognitive and learning factors in the understanding of actual behaviour. Es-sentially, the model of bounded rationality regards full rationality as unreal-istic and instead it focuses on how the decision maker’s coping strategies can make up for cognitive limitations.
1.1.1 Heuristics and Biases
Simon (1957) introduced simplifying heuristics, or rules of thumb, to explain behavioural decision making. The heuristics and biases approach was then further developed by Amos Tversky and Daniel Kahneman and spread with-in the academic psychology, as well as other disciplwith-ines. Initially, the re-search on heuristics and biases mainly involved judgements and decisions under uncertainty where a set of simplifying heuristics were proposed as opposed to complex algorithm processing (Gilovich, Griffin & Kahneman, 2002). Tversky and Kahneman (1973) found that people generally did not behave according to probability calculations or statistical predictions, instead they use simplifying heuristics that sometimes result in reasonable judge-ments, but sometimes in errors. These errors are commonly referred to as biases, and they are also the topic of this thesis. Normative models and their predictions are often the starting point of research within the field of behav-ioural decision making. The first step when exploring biases is to investigate
18
if judgements deviate from the normative. When a bias is identified, the next step is to investigate if the judgemental biases can be ameliorated, or debi-ased, according to normative ideals.
1.1.2 Debiasing Judgements
Research on heuristics and biases has led to an increased knowledge of how behaviour deviates from normative ideals. Following the success in this field is prescriptive research that focuses on identifying better decision strategies and tools to ensure that such strategies are employed in decision making. There are two main approaches in prescriptive decision making. One ap-proach aims at improving reasoning by mapping individuals’ cognitive strat-egies and modifying these. An optimal strategy in this view leads to an ap-proximation of the normative ideal by considering the cognitive limitations of the individual as regards memory load and computation. The other ap-proach involves the use of external techniques, such as decision aids and information displays that improve information processing. Thus, an optimal strategy may simply be to make use of tools that are superior to the cognitive toolbox internal to the decision maker (Larrick, 2004). Study II of this thesis focuses on debiasing by the use of an external judgement aid, studies involv-ing debiasinvolv-ing through modifyinvolv-ing cognitive strategies will also be discussed.
Fischhoff (1982) suggested an overall classification of debiasing proce-dures based on the source of the bias and suggested three categories; the task, the judge or a mismatch between the task and the judge. In the task category, a further distinction between unfair and misunderstood tasks was made. Unfair tasks essentially concern the experimental set up and can be debiased by reducing methodological flaws, for instance by ensuring that participants are motivated to perform well in the task and that they are well-instructed. When methodological measures have been taken and a bias per-sists, then the participants themselves are likely to have some part in its ex-istence and thereby fall into the second category; judges.
According to Fischhoff (1982) judges can be either perfectible or incorri-gible. A perfectible judge can be debiased by being warned that biases may occur or informed of such biases’ direction. Another possible debiasing pro-cedure in such instances is to provide feedback or training to the participant. However, it may be that none of these countermeasures have an effect on the bias and that judges are incorrigible. In such cases, it may be better to re-place people with superior devices or acknowledge existence of a bias and adapt planning or actions accordingly.
Reed and Saavedra (1986) studied judgements of mean speed and at-tempted to debias these judgements by providing alternative instructional methods. Participants were given scenarios as in the following example:
19 “Flying east between two cities, a plane’s speed is 150 mph. On the return trip, it flies 300 mph. Find the average speed for the round trip”
In an earlier study (Reed, 1984), most participants responded with the arithmetic mean (225 mph) which is incorrect. Each of the two speeds should be weighted by the travel time spent at that speed in order to make a correct estimate (200 mph). Reed and Saavedra (1986) compared three dif-ferent instructional methods to improve estimates; a discovery, a graph and a computation method. In the discovery condition, participants were first asked to make their estimate of the average speed of a journey. Then, they were shown a computer simulation where the two speeds used in the round trip scenario were displayed as a reference point alongside a point showing their own average speed estimate. They were told that the two points would finish the journey at the exact same time if their estimate was correct. In this way, participants received visual feedback of the discrepancy between their estimated average speed and the correct average speed. In the graph method, participants were also provided with visual feedback. Participants were shown a graph of how the average speed of a round trip changes as a func-tion of the initial speed. In the computafunc-tion condifunc-tion, participants calculated the answers to average speed problems.
The study showed that the discovery method improved average estimates and was more effective than the graph method. The computation method was not successful in improving participants’ estimates. Similarly, a study on the time saving bias by Svenson (1970) showed that neither verbal nor written information about the correct formula for calculating time savings ameliorat-ed the estimates. Svenson (1971) also attemptameliorat-ed to debias time saving judgements by providing direct feedback after judgements. In the experi-mental group, participants were then trained during two and a half hour ses-sions for five days. They were asked to estimate the time saved from an orig-inal lower mean speed compared to a higher mean speed on the same dis-tance. There was a learning phase where participants were given the correct time saving after making a judgement of their own as well as a test phase where no feedback was given. A control group had an equal amount of ses-sions, but these lasted for one hour and only included the test phases. The direct feedback over five consecutive sessions did improve the participants’ estimates. In a similar study by Svenson, Eriksson and Mertz (2013), direct feedback on braking speed estimates improved accuracy, whereas additional relevant information on braking and stopping distances did not further im-prove judgements.
The third category in Fischhoff’s (1982) classification of debiasing pro-cedures involves restructuring and education in order to increase the compat-ibility between the judge and task so that participants can use their cognitive skills to the best of their ability. Examples of restructuring is to urge partici-pants to express their knowledge explicitly rather than to keep it to
them-20
selves, finding disproving evidence instead of confirming evidence of a pre-ferred answer and suggesting alternative formulations of the problem at hand. Fischhoff (1982) suggested two alternatives for education, either re-cruiting experts who have general capabilities relevant for the task or indi-viduals who have been educated in the type of reasoning required to solve a task.
Halkjelsvik, Jørgensen and Teigen (2011) attempted to debias productivi-ty estimates by reformulating the traditional question posed to participants in studies of productivity. Instead of asking how much time a given amount of work would take, they asked how much work that could be done in a given amount of time. Previous studies have shown that participants overestimate the time needed to complete small tasks and underestimate the time required to finish larger tasks. By using the inverted question, Halkjelsvik et al. (2011) were able to reverse this bias. In their study, participants gave higher productivity estimates for shorter time intervals than for longer durations.
Research on time saving judgements suggests that people fail to appreci-ate the curvilinear physical relationship between speed and travel time. In-stead, they use more linear strategies such as a ratio between speeds or a percentage (Peer & Gamliel, 2012; Svenson, 2008). Figure 1 illustrates the curvilinear physical relationship between travel time (minutes) and speed (km/h) on a 100 kilometre long distance.
Figure 1 Travel time (minutes) as a function of speed (kilometres per hour) over a 100 kilometre long distance.
0 100 200 300 400 500 600 700 0 20 40 60 80 100 120 140 160 Tr av e l tim e ( m in u te s) Speed (km/h)
Travel time as a function of speed
(km/h)
21
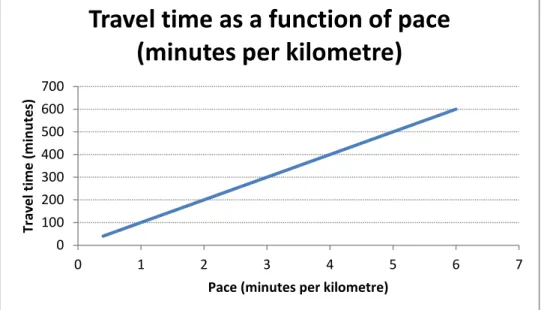
A possible debiasing technique concerning judgements of curvilinear functions such as the aforementioned, is to change the measure to one that is in line with the linear reasoning behind these intuitive judgements. A previ-ous study by Larrick and Soll (2008) showed that the measure for fuel effi-ciency in the U.S., miles per gallon, leads to biased judgements that can be reduced when presenting the information in terms of litres per 100 kilome-tres. Peer and Gamliel (2013) suggested a similar solution to the time saving bias, e.g. using pace in minutes per kilometre instead of speed in kilometres per hour. Figure 2 shows travel time as a function of pace.
Figure 2 Travel time (minutes) as a function of pace (minutes per kilometre) over a 100 kilometre long distance.
A linear reasoning of the effect pace has on the travel time over a 100 kil-ometre distance will lead to correct judgements. Peer and Gamliel (2013) conducted a questionnaire study where participants were asked to estimate travel time with support of either speed data or pace and speed data. The results showed that participants with both speed and pace data made more accurate judgements than the control group, who only received support from speed data. It is however not clear how the pace measure would affect driver judgements since the participants in the study were not actually driving while making the estimates. In the study, pace data was presented as a com-plement to the speed data and therefore it is dubious to evaluate the effect of the pace data alone. These two aspects are researched in Study II where par-ticipants were presented with either pace or speed data while driving in a simulator. In simulated driving, just as in actual driving, the driver needs to
0 100 200 300 400 500 600 700 0 1 2 3 4 5 6 7 Tr av e l tim e ( m in u te s)
Pace (minutes per kilometre)
Travel time as a function of pace
(minutes per kilometre)
22
rely more on perceptual cues. Hence, speed and time perception would be essential elements of the driving task and the choice of speed.
1.2 Speed and Time
1.2.1 Perception
Driving is a complex task and it does not solely rely on cognitive processes, but perceptual processes and perceptual-motor skills are also of utmost im-portance. Perception of distances, speed and time as well as the understand-ing of their relationship to one another, provide the basis of driver behaviour (Groeger, 2000). Earlier studies have shown that perceptions of speed, dis-tance and time deviate from physical measures in many situations (Cohen, Ono & Skelley, 1966). In the following, a brief summary of the literature on time perception that is not directly applicable to the studies of the thesis, but still relevant for theme of this dissertation, will be given.
Explanatory models of duration judgements in time perception have been divided into three main categories; the storage-size hypothesis, the pro-cessing-time model and the change model (Poynter, 1989). According to the storage-size hypothesis, perceived duration is constructed on the basis of the size of the information storage during an interval (Ornstein, 1997). The more information that is stored during an interval, the longer the duration of the interval is perceived to be. Duration judgements are therefore mainly affect-ed by the amount and complexity of information in an interval (Ornstein, 1969). The filled-duration illusion, which is that intervals with more stimuli are perceived as longer compared to the same intervals with fewer stimuli, can be explained by this model (Fraisse, 1963; Frankenhaeuser, 1959).
Processing time models assume that duration judgements are dependent upon information from two processors; one for temporal information and another for non-temporal information (Poynter, 1989). According to these models, the perceived duration length increases when the amount of stimuli needed for processing is small, e.g. when the task is easy, when participants do not need to respond directly to presented information or when participants do not need to attend to stimuli from two sources (Block & Zakay, 1997).
The change model approach is similar to the two aforementioned models in two aspects. Similar to storage size models, it acknowledges that the per-ceived duration of a time interval is defined by the number and organisation of memories linked to that time interval. As in processing time models, it is assumed that time perception is affected by the processing of interval events which involves shifting attention between different types of information (Poynter, 1989). In addition, perceived duration is determined by experi-enced change such as a change in spatial location. Hence, motion is an
im-23
portant factor in the determination of perceived duration. According to this perspective, a faster speed leads to more changes in spatial location than a slower speed and therefore the perceived duration should be longer (Brown, 1995).
Time and distance perception have been found to be susceptible to a tau (distance) and a kappa (duration) effect. The tau effect predicts that the judged distance of an interval, defined as two stimuli, e.g. visual stimuli, presented in sequence, will increase when the interval is presented repeated-ly with temporal variation and a constant distance (Helson, 1930). Corre-spondingly, the kappa effect predicts that when distance is varied among intervals and temporal separation is constant, perceived duration increases with varying distances (Cohen, Hansel & Sylvester, 1954).
Cohen, Ono and Skelly (1966) conducted a study of speed perception when drivers were actually driving. The participants in their study were all members of the police force in England and they were asked to drive a route that was unfamiliar to most of them. The experimenter would indicate if the driver needed to increase, decrease or maintain the current speed. Partici-pants were asked to estimate duration, distance and speed at the end of the journey. The results showed that the duration of a long distance travelled at a high speed was perceived to last longer than a slower and shorter trip with an equal travel time. Speed perception was found to be closer to the physical measure than distance and duration perception (Cohen, Ono & Skelley, 1966). However, a previous study (Cohen & Cooper, 1962) showed that there seem to be a bias towards overestimating slower speeds and underesti-mating higher speeds.
1.2.2 Cognition
Intuitive knowledge about the concepts of speed, time and distance and how they are interrelated, has been found in children from five years of age (Wilkening, 1981). However, neither children nor adults make perfect pre-dictions according to normative physical laws in all contexts (Wilkening & Martin, 2004). An example is problems concerning the average speed of a trip that has been proven to be troublesome for both adults and children. Imagine that you have planned to drive a distance at a speed of 100 km/h, but during the first half of that distance you are only able to keep a speed of 75 km/h. How fast do you need to drive on the second half of the distance in order to arrive at your destination at the planned time of arrival? Generally, most people answer 125 km/h (Wilkening & Martin, 2004), although the correct response is 150 km/h.
It has been suggested that people use a linear strategy, which implies ne-glecting the time remaining to make up for the lost time of the first half of the distance, and instead combine speeds with the use of addition (Huber, Krist & Wilkening, 2003). In the aforementioned example, the 25 km/h
24
speed loss over the first half would be compensated by simply adding 25 km/h to the planned average speed of the second half of the trip leading to the answer 125 km/h (Wilkening & Martin, 2004). Although this lineariza-tion heuristic can lead to a correct answer, for instance if the time spent on both distances had been constant, it can lead to errors. To illustrate, if two cars travel the same distance and the first car is driven at a speed of 100 km/h and the other at the speed of 50 km/h. If the slower car would increase its speed to 150 km/h halfway, it would not be possible to catch up with the faster car because it would already have completed the distance at that point in time.
Svenson (1976) studied intuitive mean speed and travel time judgements following a speed increase. In his study, participants were asked to make judgements of the mean speed of a model engine travelling at different speeds on parts of a given distance. The results of the experiments suggest that the effect of an increased speed on parts of a distance on the mean speed generally is overestimated. Mean speed judgements have been investigated further by Svenson and Salo (2010). They studied the impact of a reduced speed during a part of a given distance on the estimated mean speed. For instance, if you normally drive 130 km/h on a 60 kilometre long stretch, but then there is road work on that road which forces you to drive at a reduced speed of 70 km/h over 10 kilometres of the total distance. What will be your mean speed over the entire distance? The correct mean speed can be derived from the following equation:
Vn = D / (D1/V1 + D2/V2) (1)
where Vn is the new mean speed, D the total distance and D1 and D2 are the parts of the distance driven at the normal speed V1 and the reduced speed V2 .
Svenson and Salo (2010) found that participants overestimated the mean speed when the normal speed was 80 km/h or higher and the reduced speed 30 km/h. The impact of the reduced speed on the overall mean speed was underestimated. Conversely, at normal speeds of 100 km/h and above and a reduced speed of 60 km/h or higher, the mean speed was underestimated. The study showed systematic biases, but the authors were not able to explain why these biases occurred. This issue will be further addressed in Study IV of the present thesis.
Notably, speed is a derived measure dependent upon both time and dis-tance. Closely related to mean speed judgements are, therefore, judgements of travel time. It has been suggested that difficulties in estimating average speed are due to a neglect of time spent on a distance (Wilkening & Martin, 2004). However, Peer (2010a, 2010b) has studied mean speed judgements, where problems were framed so that participants needed to pay attention to duration in order to solve the problems. In his studies, participants were
25
asked to estimate the minimum average speed required to decrease the travel time of a journey from 30 min to 20 min. The results showed that the esti-mates deviated systematically from the physically correct mean speeds. Generally, people overestimate the time saved when increasing speed from an already high speed, whereas judgements of time saved when increasing from a low speed is underestimated (Fuller et al., 2009; Peer, 2010a, 2010b, 2011; Peer & Gamliel, 2012; Peer & Solomon, 2012; Svenson, 1973, 2008, 2009). This phenomenon has been referred to as the time saving bias (Sven-son, 2008). The actual time that can be saved from a speed increase can be derived from the following formula:
Time gain = cD (1/V1-1/V2) (2)
where c is a constant enabling conversion of the distance measure to other units, D is the distance travelled, V1 is the original speed and V2 the higher speed. In early studies of the time saving bias (Svenson, 1970, 1971), partic-ipants were asked to estimate the time saved between lower and higher speeds. The time saving judgements are described by the following formula:
Time gain = cDe (V2-V1)/V2 (3)
in which c and e are constants describing how perceived/cognitive dis-tance is a function of objective disdis-tance D; V1 is the original speed and V2 the higher speed. Here, the judged time saving when increasing speed is the ratio of the difference between the higher and the lower speed to the higher speed. Peer and Gamliel (2012; 2013) found that the initial speed, rather than the higher speed, in the denominator of Equation 3 better fitted the time sav-ing judgements in their study.
Most studies of mean speed and time saving judgements have been ques-tionnaire studies, where problems have been presented solely in writing. A perceptual motion study on the topic was conducted by Svenson (1973) in which participants were shown a model train completing a distance at a cer-tain speed. The task was to choose the speed that the train should keep dur-ing a succeeddur-ing trip over the same distance in order to increase or decrease the travel time by 10 seconds compared to the first trip. Again, the time saved at a lower speed was underestimated and the participants’ judgements were also best explained by Equation 3. Peer and Solomon (2012) asked taxi drivers to make mean speed and travel time estimates of a trip when they were actually driving and found time saving biases. However, it should be noted that the taxi drivers did not drive at the speed that they thought was necessary to make specified time travel savings.
The mean speed that is required, to make up for lost time on a distance, has been shown to be susceptible to the response mode. In the aforemen-tioned study by Wilkening and Martin (2004), children and adults were
26
asked to estimate the mean speed over the second half of a distance that was needed to compensate for a lower planned mean speed on the first half of that distance. Instead of only presenting the problems in writing and asking respondents to answer in writing, they presented visual information and asked participants to respond either by indicating their response on a speed-ometer or by actually producing the speed.
Participants were presented with two parallel tracks with a toy car on each track. One car was a reference car travelling at a constant speed and the other was a test car which started at the same time as the reference car but at a lower speed. The midpoint was halfway through the distance of the journey (non-linear condition) and halfway through the travel time of the journey (linear condition). In the linear condition, a linearization heuristic, adding the speed loss of the first half to the planned speed of the second half, can be used to arrive at a correct response. In the non-linear condition, the lineariza-tion heuristic will lead to an incorrect answer, because the time spent on the second half of the distance is less than on the first half and therefore an even higher speed is needed to compensate.
At the midpoint of the journey, the reference car would disappear into a tunnel for the rest of the trip. Participants were asked to estimate the speed the test car needed to keep in order to arrive at the end of the track at the same time as the reference car. In the judgement condition, participants were told the speed of the reference car and they indicated their mean speed judgement by moving a needle on a speedometer to their estimated speed. In the action condition, participants were asked to produce the speed that they estimated that the car needed to keep on the remaining distance, by setting the test car in motion. The results showed that both children and adults could make accurate judgements in linear problems in both conditions. In the judgement condition, neither children nor adults made accurate judgements of the mean speed in the non-linear problems. In the action condition, chil-dren made inaccurate judgements of non-linear judgements, but adults made judgements close to the non-linear physically correct speeds.
The study by Wilkening and Martin (2004) showed that there was a dif-ference in judgements between responses that were produced (action condi-tion) and not produced (judgement condicondi-tion). In Study I and II of this thesis, participants were also asked to produce their responses by driving at their estimated speed and these estimates were compared to static judgements given in questionnaires.
27
1.3 Driving Parameters
1.3.1 Fuel Consumption
Road transportation is one of the most energy consuming activities in mod-ern societies with far reaching environmental effects (Intmod-ernational Energy Agency, 2009). Greenhouse gas emissions in the transport sector increased with 24 % between 1990 and 2009 (European Environmental Agency, 2011a). It has been suggested that reducing speed limits would lead to a re-duction of emissions. A rere-duction in speed limits from 120 km/h to 110 km/h would decrease fuel consumption by 12 % for diesel cars and 18 % for gasoline cars, assuming little acceleration and braking according to estimates (European Environmental Agency, 2011b).
Fuel consumption and emissions vary with speed, however, the relation-ship between speed and fuel consumed is not straightforward. Generally, fuel consumption increases with average speed, but when the speed reaches about 60 to 80 km/h it decreases and then increases again at higher speeds (Haworth & Symmons, 2001). It should be noted that deceleration and ac-celeration, which are required to change vehicle speed, also affect the fuel consumed.
A reduction in speed limits would lead to longer travel times, but the sub-sequent reduction in fuel consumption may be an incentive for drivers to keep a lower speed. Even though drivers may not be concerned with envi-ronmental effects, the financial savings of a reduced fuel consumption may motivate drivers to change their driving behaviours (Haworth & Symmons, 2001). Again, it is important that drivers can make accurate judgements of the effect of their chosen speed on fuel consumption. In Study III, judge-ments of fuel saved or lost will be researched.
1.4 Information Systems
Each year the number of cars on the roads increases (Statistics Sweden, 2013) and this fact has led researchers to investigate how to use our transport system more efficiently. One approach has focused on providing road users with real-time pre trip and en route traffic information in order to change their travel behaviour in ways that are beneficial to the system’s efficiency (Chorus, Molin & van Wee, 2006). This approach has involved the devel-opment of the technology of Advanced Traveller Information Systems (ATIS) that includes systems that offer drivers real-time in-vehicle infor-mation, such as navigation and route guidance, hazard warnings, and road-way signage (Adler, Recker & McNally, 1993; Abdel-Aty & Abdalla, 2006; Ben-Elia, Erev & Shiftan, 2007; Wahle, 2008). In Study II, information on
28
the estimated time of arrival (ETA) will be discussed in relation to mean speed and time saving judgements.
Behavioural research is needed to support the development of these tech-nologies for two main reasons. One reason is in the development of these technologies, to determine what type of information that the end-users need and how it should be presented. There is also a need for increased under-standing of information processing involving, for example, cognitive and behavioural aspects when travel times are not known (Ben-Elia, Erev & Shiftan, 2007). Another reason is that information systems often assume that individuals make optimal choices according to various models stemming from expected utility, but research show that this is not always the case (Lubashevsky, Wagner, & Mahnke, 2003; O’neill, 1997; Schmidt-Daffy, 2014; Sivak, 2002). Even if road users are provided with all the relevant information of traffic conditions that is needed to optimise their choices, they may not behave as predicted by normative models. Instead, it is neces-sary to test this assumption and, if it does not hold, investigate why their behaviour deviates from the expected behaviour and how to provide support that enables them to make more informed decisions.
29
2. Aims of the Thesis
The specific aims of the thesis are to study judgements of time savings, fuel consumption and mean speed and how they relate to physically objective measures. The following research questions were addressed:
Does the time saving bias apply to active driving? (Study I)
Can the time saving bias be debiased? (Study II)
How does judgements of fuel consumed relate to actual fuel con-sumption at different speeds? (Study III)
How can mean speed judgements be modelled? (Study IV)
30
3. Summary of the Studies
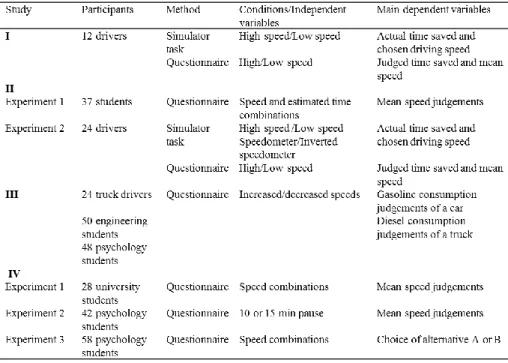
The four studies included in this thesis investigate judgements related to driving speed and how they deviate from physically objective measures. Study I and II explores the time saving bias and its relevance to active driv-ing (Study I) and if it can be debiased (Study II). Study III investigates judgements of fuel consumption when the driving speed changes. Study IV focuses on mean speed judgements and if they can predict route choice. Ta-ble 1 gives an overview of participants, methods and main variaTa-bles of the studies (I–IV).
31
3.1 Study I The Time Saving Bias: Judgements,
Cognition and Perception
3.1.1 Background and Purpose
Participants generally overestimate the time saved by speeding from a high speed (e.g. 100 km/h) and underestimate the time saved by increasing speed from a slow speed (e.g. 30 km/h) (Fuller et al., 2009; Peer, 2010a, 2010b, 2011; Peer & Gamliel, 2012; Peer & Solomon, 2012; Svenson, 1973, 2008, 2009). This phenomenon has been named the time saving bias. The bias has mainly been found in questionnaire studies in which participants were given enough information about speed, time or distance to be able to solve hypo-thetical time saving problems. Driving is a task that involves perceptual and cognitive processes and therefore it is important to study the relevance of a cognitive time saving bias to actual driving in an environment that is mainly perceptually driven. The purpose of Study I was to investigate the relevance of the bias in an active driving task in a simulator.
3.1.2 Method
A within participant design was employed in this fixed-based interactive simulator experiment. Twelve drivers were instructed to first drive a distance at a given speed and then drive the same distance again at the speed they thought was necessary to gain exactly 3 minutes in travel time. Participants were not given the duration or the distance driven. Instead, they only re-ceived information about actual instantaneous speed through the speedome-ter and were asked to make their judgements based on a first distance that they drove themselves. There were two conditions; in one condition the dis-tance 8.5 km was driven at the given speed of 30 km/h and in the other con-dition the distance was 28.3 km driven at the given speed of 100 km/h. In both conditions, the distances were driven twice. First at the given speed and then at the speed the participant thought necessary to gain the targeted travel time. The order of the two conditions (low speed first and high speed first) was balanced.
Following the two drives of each condition, participants completed a questionnaire about their perceptions of the average speed and the time gained when choosing the driving speed. This procedure was then repeated for a different speed (and distance) in the second condition. After the simula-tor task, participants were given another questionnaire with time saving problems, two of which corresponded to the two driving task conditions. The general task in the time savings questionnaire was to estimate the mean speed needed in order to gain 3 minutes on a distance of either 20 or 40 km driven at varying initial speeds. The initial speeds were 50, 60, 70, 80, 90, 100, 110 and 120 km/h. Participants were also given the driving task
prob-32
lems with the same distances (8.5 km and 28.3 km) and initial speeds (30 km/h and 100 km/h) and they were asked to judge the mean speed needed to gain 3 minutes.
3.1.3 Results and Discussion
On average, participants gained 6.14 min when increasing speed from 30 km/h which is significantly higher than the target time saving of 3 min. The average actual time saved was 2.21 min and significantly lower than 3 minutes when increasing from the higher speed 100 km/h. And yet, the aver-age judged time savings were close to the targeted 3 min. To summarise, participants saved more time than needed when increasing speed from the low speed, which suggests an underestimation of the time saved from that speed. When increasing from the higher speed, participants drove slower than needed suggesting that they overestimated the speed saving effect of the increase. The results could not be explained by a bias in speed judgements, because in both conditions participants made accurate judgements of their mean speeds.
Participants also solved time saving problems in a questionnaire and, as predicted by the time saving bias, participants overestimated the average speed needed at the lower speeds and underestimated the average speed at higher speeds. Participants were also asked to estimate the mean speed need-ed to save 3 min on the distances usneed-ed in the simulator task, which allows for direct comparison with the two conditions in the simulator task. In both the simulator task and the questionnaire task the mean speed needed to gain the travel time was overestimated when the initial speed was low and underesti-mated when it was increased from a high speed.
The results corroborate a time saving bias and suggest that the bias, pre-viously found in a cognitive context, applies to an active driving task where the driver has to rely more on perceptual cues. The bias cannot be explained by a misjudged average speed, because participants were able to make accu-rate judgements of their mean speeds. Participants also seem to be unaware that they are subject to a bias, because they judge their time saved to be close to the targeted time saving. The results also lend support to questionnaires as a valid method of studying driver-related judgements.
33
3.2 Study II Estimated Time of Arrival and the Time
Saving Bias
3.2.1 Background and Purpose
Drivers can receive information on the estimated time of arrival (ETA) at a destination through the satellite navigation system of the car. Due to unfore-seen circumstances such as road work or traffic jams, predicting the ETA can be problematic and the ETA can be changed over a journey. A driver may find him or herself under time pressure when the ETA is delayed and may want to make up for lost time. Then, the driver needs to make judge-ments of the mean speed that is required to ensure that he or she makes it to the destination on time. Previous studies have shown a time saving bias in judgements of time saved (Fuller et al., 2009; Peer, 2010a, 2010b, 2011; Peer & Gamliel, 2012; Peer & Solomon, 2012; Svenson, 1973, 2008, 2009). It has been suggested that the bias can be reduced by presenting speed in-formation in terms of the inverted speed. The first purpose of Study II was to investigate mean speed judgements when the ETA is delayed in a question-naire. The second purpose was to investigate if time saving judgements can be debiased by presenting the inverted speed (min per km) to drivers in a driving simulator task.
3.2.2 Method
Two experiments were conducted. In the first questionnaire experiment, 37 university students were asked to estimate the mean speed required to arrive on time when the ETA was delayed due to heavy traffic. Participants were given information on the total journey distance, original ETA and original planned mean speed, reduced speed and distance with reduced speed as well as the new ETA after passing the reduced speed stretch. There were 10 prob-lems and the original and reduced speed combination and estimated arrival time varied between the problems. The time of departure and the distances were the same in all problems.
In the second experiment, 12 drivers performed the same driving simula-tor task as in Study I. They drove the same two distances at the same given speeds and were asked to drive the distances a second time at the speed they thought necessary to gain exactly 3 minutes in travel time. Participants in this experiment were presented with an alternative speedometer that displayed the inverted speed in minutes per kilometre instead of the conventional speedometer which indicates speed (kilometres per hour). When increasing speed from a low speed, the inverted speedometer increases more compared to the same speed increase at higher speeds. This illustrates that more time is saved at lower speeds and less time is saved at higher speeds (balancing the
34
time saving bias) when speed is increased. The 12 participants from Study I who were presented with speed information in a conventional speedometer served as a control group1.
3.2.3 Results and Discussion
The results of the first experiment showed that when the original speed was high, participants underestimated the speed needed to arrive on time. Con-versely, when the speed was low, participants overestimated the speed. The findings support a time saving bias and suggest that drivers’ judgements need to be aided when the estimated time of arrival to the destination chang-es.
In the second experiment, the actual time savings were compared to the control group from Study I. When increasing speed from 100 km/h, the con-trol group saved 2.21 min which was significantly less time than the pace meter group which saved 3.47 min. When increasing speed from 30 km/h, the control group saved 6.14 min which was significantly more time than the pace meter group 4.42 min. The findings suggest that the intuitive time judgements were affected by the pace meter display; the judgements were more accurate when participants were presented with information about the inverted speed.
1
Participants in Study I and the driving simulator experiment in Study II were recruited at the same time and randomly assigned to one of the two studies.
35
3.3 Study III Speed Changes and Judged Effects on Fuel
Consumption
3.3.1 Background and Purpose
Greenhouse gas emissions from the transport sector increased by 24 % be-tween 1990 and 2009 (European Environmental Agency, 2011a). Reducing speed limits has been suggested as a possible countermeasure to this trend (European Environmental Agency, 2011b). It is important that the general public and stakeholders understand the effect of speed on fuel consumption in order to make optimal decisions about their own driving speed and/or general speed limit regulations. The purpose of Study III was to investigate judgements of gasoline and diesel consumption when the mean speed in-creases or dein-creases.
3.3.2 Method
In this questionnaire study, 24 professional truck drivers, 50 engineering students and 48 psychology students participated. They were first asked to estimate fuel (gasoline) consumption for a passenger car at different speeds for a distance of 100 kilometres. Half of the participants were asked to esti-mate the fuel consumed at decreasing speeds of 110, 100, 90, 80, 70 and 60 km/h and were given the gasoline fuel consumption at the reference speed 120 km/h (8.8 litres per 100 km). The other half of the participants were provided with the fuel consumption at 60 km/h (5.6 litres per 100 km) and asked to estimate fuel consumption at increased speeds 70, 80, 90, 100, 110 and 120 km/h. Thereafter, the participants were asked to make the same es-timates for the diesel consumption of a truck. The reference speed for creasing speeds was 60 km/h (16.9 litres diesel oil per 100 km) and the in-creased speeds were 70, 80, 90 and 100 km/h. The reference speed for de-creasing speeds was 100 km/h (26.5 litres diesel oil per 100 km) and the decreased speeds were 90, 80, 70 and 60 km/h. The students and four of the truck drivers answered the questions with pen and paper. The remaining truck drivers answered the questions in an online survey.
3.3.3 Results and Discussion
Fuel consumption of a passenger car
The truck driver group underestimated how much fuel that was saved by a speed decrease, generating estimates higher than the correct consumption. Engineering and psychology students made more accurate judgements and their estimates did not significantly deviate from the correct consumption
36
except in one case (engineering students estimates at 80 km/h). The two student groups overestimated the amount of fuel that would be lost by in-creases in speed. Truck drivers’ estimates were close to the correct amount of fuel consumed when speed was increased.
Diesel consumption of a truck
Estimates of diesel consumption at decreasing speeds showed an underesti-mation of the fuel saving effect. Participants in all groups estimated the die-sel consumption as higher than it actually was. At increasing speeds, none of the three groups’ estimates deviated significantly from the correct diesel consumption.
The main finding of Study III was that participants underestimated how much fuel that can be saved by decreasing speed. Systematic biases in judgements can affect the choice of speed. If one does not realise the full benefit of a speed reduction, one might also be more reluctant to decrease speed.
37
3.4 Study IV Judgments of Mean Speed and Predictions
of Route Choice
3.4.1 Background and Purpose
Judgements of mean speed have been found to be biased (Huber, Krist & Wilkening, 2003; Svenson & Salo, 2010; Wilkening & Martin, 2004). To estimate the mean speed over a distance with only two different speeds, the speeds need to be weighted by the duration that the vehicle travels with each of the two speeds. This is referred to as a time weights model. Svenson and Salo (2010) presented participants with problems giving information on the distances travelled at the two speeds rather than the durations. Therefore, the first purpose of the study was to investigate if mean speed judgements in the Svenson and Salo (2010) study could be better explained by a distance weights model, in which speeds are weighted by the distance travelled at each of the two speeds. The second purpose was to investigate mean speed judgements when the vehicle stops for a specific duration of a journey. The third purpose was to investigate if mean speed judgements from the Svenson and Salo (2010) study can predict route choices better than physically objec-tive mean speeds.
3.4.2 Method
This study comprised three experiments. In the first experiment, the ques-tionnaire data was derived from Study 3 reported in Svenson and Salo (2010). The data was reanalysed here to find a model fit. University students were asked to estimate the mean speed of a 60 km distance that normally was driven at a certain speed, but was now composed of a 10, 20, 30 or 40 km long stretch with a reduced speed. In addition to these four distances, they were given the original and reduced speed over the distance. Each of the four distances with a reduced speed was combined factorially with eight pairs of normal and lower speeds, providing a total of 32 different problems to solve. The reduced speed of 30 km/h was paired with the following origi-nal speeds: 90, 100, 110 and 120 km/h. A reduced speed to 70 km/h was paired with original speeds of 110 and 120 km/h. A speed reduction to 90 km/h was paired with original speeds of 110 and 120 km/h.
Forty-two university students were asked to judge the mean speed in the second questionnaire experiment. They were given the same type of prob-lems as in Experiment 1, but instead of a reduced speed on part of the dis-tance, there was a break for either 10 or 15 minutes when the speed was 0 km/h. A within-participant design was employed. There were 12 problems in a 6 (speeds) x 2 (pause duration) factorial design. The total distance was
38
invariant (60 km), but the speeds varied (70, 80, 90, 100, 120 or 130 km/h) and each speed was combined with a pause of 10 or 15 min.
In the third experiment, 58 university students were presented with the same route scenarios as in Experiment 1, but the routes were presented pair-wise. There were a total of 16 decision problems. In four problems, routes were presented pairwise based on their similarity in objective mean speed, meaning that both alternatives corresponded to the same or close to the same correct speeds. Another four problems paired routes that were subjectively similar, meaning that the two routes had been judged to be as fast as when presented on their own in the previous study (Svenson & Salo, 2010). In the remaining four problems, routes were paired so that objective mean speeds predicted choices opposite to the choices predicted by subjective judge-ments. Participants were asked to estimate mean speeds for each route and choose which one was faster.
3.4.3 Results and Discussion
The results of the first experiment indicated that the fit between judgements and the time and distance weights model were significant. The partial corre-lation between mean empirical judgements and the distance weights model predictions, with time weights predictions controlled for, was r = 0.825. Correspondingly, the partial correlation between judgements and time weights predictions, if distance predictions were controlled for, was r = 0.654. Hence, the distance weights model explained more of the variance in judgements as compared with the time weights model.
In the second experiment, the deviations between judged and correct mean speeds were greater at higher original speeds. At speeds of 100 km/h or more, the mean speed was overestimated and significantly different from correct speeds. The discrepancy between actual mean speeds and average judged mean speeds was greater for the 15 min pause compared to the 10 min pause.
The third experiment showed that there was no significant association be-tween objectively predicted choice and the choices made by the participants χ2
(1) = 3.804, p > 0.05. There was a significant association between subjec-tively predicted choice and the choices made by participants χ2(1) = 70.062, p < 0.001, which contrasts with the predictions made from objective mean speeds. Thus, the results showed that subjective mean speed judgements predicted choices better than objective mean speeds.
39
4. General Discussion
The general discussion will first address the five research questions of the thesis and the main findings of Studies I, II, III and IV. Secondly, the general purpose of the thesis regarding its contribution to behavioural judgement and decision making research and applied research on driver behaviour will be discussed in the “Concluding Remarks” section. In the final section, recom-mendations for further research will be proposed.
4.1 Does the time saving bias apply to active driving?
The time saving bias has been found in numerous studies concerning driving speed (Fuller et al., 2009; Peer, 2010a, 2010b, 2011; Peer & Gamliel, 2012; Peer & Solomon, 2012; Svenson, 1973, 2008, 2009), as well as in speed judgements in health care (Svenson, 2008) and productivity (Svenson, 2011; Svenson, Gonzalez & Eriksson, 2014). The bias has been studied predomi-nantly from a cognitive perspective in judgements made when not actually driving. Biases in such judgements is an important research topic as it may affect public opinions on driving speed and the attitudes of other stakehold-ers towards driving speeds and speed limits. Another interesting aspect is whether or not the time bias is relevant to drivers’ choice of driving speed as they are driving. Driving is a complex task that involves both perceptual and cognitive processes as well as perceptual-motor skills. Drivers perceive dis-tances, speed and time, and need to understand how these components inter-act in order to be able to inter-act accordingly (Groeger, 2000). These processes cannot adequately be captured in paper and pencil tasks of driving-related judgements, consequently the relevance of previous studies of driver judge-ments can be questioned. To the best of the author’s knowledge, the cogni-tive bias had not yet been studied in an experimental setting where the par-ticipants’ judgements rely primarily on perceptual cues while engaged in active driving that requires perceptual motor skills. Therefore, Study I was designed to investigate time saving judgements in an active driving task in a simulator. The results of Study I indicate a time saving bias in the simulated task, which suggests that the b ias is in fact relevant to actual driving.
The results of Study I suggest that the time saving bias is not a result of a misestimate of the mean speed, because drivers’ estimates of their own mean speeds were close to correct mean speeds derived from simulator data. Nor