DRIVER WORKLOAD IN SIMULATED ROAD
TUNNELS
Possible implications for ITS applications
‐ Preliminary findings ‐
Ruggero Ceci
Project manager, Swedish Road Administration, SE-171 90 Solna, SWEDEN
ruggero.ceci@vv.se Christopher Patten
Senior researcher, Swedish National Road and Transport Research Institute, SE-781 29, Borlänge, SWEDEN
christopher.patten@vti.se Johan Engström
Senior researcher, Volvo Technology Corporation, SE-405 08 Göteborg, SWEDEN
johan.engstrom@volvo.com
ABSTRACT
The main purpose of this study is to measure the impact of environment factors of simulated road tunnels on driver performance. Perceptual cues in the tunnel environment are manipulated in order to evaluate performance measures and examine possible implications for road tunnel safety. The effects of environment factors on driver workload are obtained from 1) objective primary task performance measures (vehicle speed, lateral position, steering wheel reversal rate) and 2) a secondary task performance measure (peripheral detection task). By manipulating visual information it was expected that driver performance could be improved and that our understanding of the demands and needs of tunnel driving can also help us determine which ITS applications may be appropriate in tunnels. The main results suggest that the effects of different tunnel designs used in this study do not affect performance significantly. They also suggest that tunnel driving in general leads to compensatory behaviour due to increased effort. The present study does not, however, have enough evidence to suggest that it is safe to allow a multitude of ITS applications in tunnels. Additionally, the effects of drowsiness are clearly distinguishable in the primary and secondary task performance measures.
BACKGROUND
There are a few long road tunnels in existence, the longest of which is the Lærdal tunnel in Norway at 24.5 km, constructed in 2000, followed by the Zhongnanshan tunnel in China at 18 km, constructed in 2007 and the Gotthard Road Tunnel in the Lepontine Alps, Switzerland at 16.9 km, constructed in 1980. A new tunnel project is underway in Sweden. The Förbifart Stockholm (FFS) tunnel is planned to be 17 km in length and completed in 2020.
Safety measures are a high priority in long tunnels because the consequences of an accident can be far more devastating than in open-air surroundings; fire and asphyxiation are major concerns. By far the best countermeasure for this type of situation is to avoid the accident all together. Inattention, distraction, drowsiness (including monotony which may precede a drowsy state) are common factors that can cause accidents (Klauer, et al. 2006).
Tunnel driving increases driving demand experienced by the drivers. Tunnel driving increases exertion required for lateral control and increases eye fixation to the centre of the road. Thus increasing road centre gaze-concentration; increasing steering micro-corrections; and reducing lateral position variability (cf. Beall & Loomis, 1996).
When driving there are numerous cues that the driver will use to control the trajectory of the vehicle; many of these cues are visual. Splay angle, parallax, visual ambient texture density, angular movement or optical flow all pertaining longitudinal and lateral control or speed and lane position. There is still no real consensus as to exactly which cues are used; however, splay angle seems to dominate for lateral control in straight-line driving. Active eye movements and optical flow are important when cornering.
Compensatory behaviour that occurs as an effect of increased driving effort created by the tunnel environment which is typically characterized in the form of e.g. reduced speed and increased headway are expected (cf. Patten, et al. 2004; Recarte & Nunes, 2002). The compensatory effect is, however, also expected to deteriorate the more a driver acclimatizes to the tunnel environment. There are a number of theoretical mechanisms that explain the general trend towards desensitization to potentially threatening objects viz. risk homeostasis or risk allostasis theory (cf. Wilde, 1988; Fuller, 2008; Lewis-Evans & Rothengatter, 2009). Vehicle speed in particular, is expected to increase and headway is expected to reduce the longer the participants drive in the tunnel environment.
The main purpose of this study is to test the hypothesis that enhanced optical cues increases lateral control and reduces driver workload in tunnel driving. In addition, it is suggested that tunnel driving in general requires more mental effort than driving on an open road; that
drowsiness leads to impaired lateral control performance, and also leads to impaired visual detection performance.
METHODS
Material and participants
The study was performed in the VTI high fidelity Driving Simulator III in Sweden. A virtual reality tunnel environment was created with different visual scenarios ranging from a very plain design (T1) with minimal road furniture to a tunnel environment with enhanced optical cues (T2) as well as misleading optical cues (T3). A baseline condition (BL) was an open-air motorway section with the same road geometry as the tunnels. Autonomous traffic was employed in the simulation to add realism.
The time delay used in the simulator is very short (40 ms), which is important when focusing on the control and manoeuvring aspects of driving. The noise, infra-sound and vibration levels inside the cabin corresponded to those of a modern vehicle. The car body used in this experiment was a SAAB with a manual 5 gear box.
24 subjects, 12 male and 12 female, participated in the study. The ages ranged between 24-45 years. All subjects held category B driving license and had a minimum of 5 years of driving experience.
Procedure
The experimental conditions and the baseline section order were randomized. All participants started with a familiarization drive (FD) of 17 km of non-tunnel, rural driving. Short breaks of up to 2 minutes between conditions were used during which the subjects were interviewed about their subjective experiences of the driving. The participants remained in the simulator during the entire experiment of approximately one hour. All participants partook in a sleep deprived/drowsy state as well as in a normally alert state of mind.
Measures
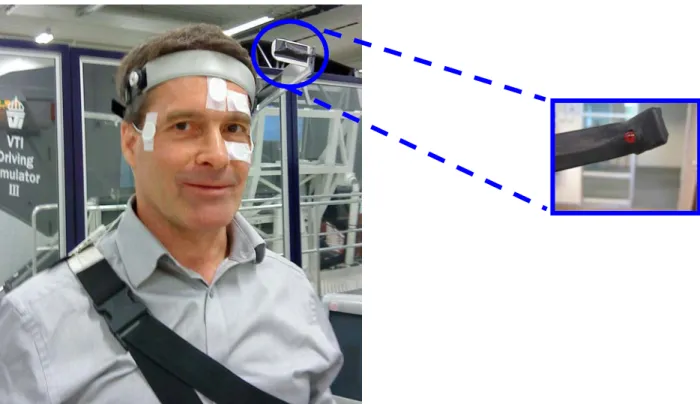
One of the methods used in the study to evaluate drivers’ workload was a peripheral detection task (PDT). It is a secondary task performance measure, where drivers must respond to visual stimuli presented off centre of their forward view by pressing a micro switch placed on the finger (van Winsum, Martens and Herland, 1999).
In the present experiment the PDT system had one red high-intensity light emitting diode (LED), which was positioned in the left part of the participant’s visual field using a head mounted device (see Figure 1). The LED on the PDT device was lit at 3-5 seconds random intervals. It was illuminated for a maximum of two seconds, or until the driver pushed the PDT response button. If
a driver reacted to the PDT stimulus within two seconds, then the reaction was scored as a "hit" and the reaction time was also measured. If the reaction came after two seconds or not at all, then is was recorded as a "miss".
Figure 1: The head-mounted PDT device with the light emitting diode highlighted. The participants were also donned with EOG sensors (not reported in this paper).
In addition to PDT, as described above, mean lane position, steering wheel reversal rate and mean speed were measured during all conditions of the study.
RESULTS
The results expressed in this paper are aggregated values for the entire tunnel sections. The tunnel sections were 17 km in length and particularly relevant for the third tunnel design (T3) is that the visual effects were only evident at specific intervals in the tunnel whereas the other road types had a constant visual design. Further data analysis will therefore be necessary for the T3 sections. All statistical analyses were performed using a standard SPSS (17.0) software package. The data was subjected to a 4*2 (Tunnel Type*Drowsiness) mixed repeated measures ANOVA. The statistical results are summarised below.
There were four road type scenarios, tunnel one (T1) with minimal road furniture, tunnel two (T2) with enhanced optical cues, tunnel three (T3) with misleading optical cues and a baseline condition (BL) that was an open-air motorway section with the same road geometry as the tunnels. Autonomous traffic (cars, busses, trucks) was present in all of the scenarios.
Primary task performance
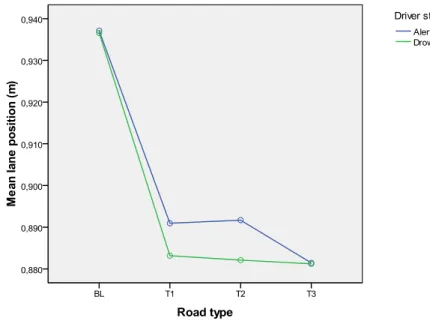
There was a significant main effect of tunnel type on mean lane position (F(3, 66)=7.78, p<.001), where the tunnel conditions induced a significant shift towards the right in the lane compared to baseline (no tunnel; see Figure 2). A planned analysis of repeated contrasts between BL vs. T1, T1 vs. T2 and T2 vs. T3 showed that only the first contrast (BL vs. T1) was significant (F(1, 22)=12.84, p<.01). Drowsiness or drowsiness order did not affect mean lane position and there were no significant interactions. There were no significant effects on longitudinal control (speed or time headway), for any of the independent variables.
Figure 2: Effects of tunnel type and drowsiness on mean lane position (m).
For steering wheel reversal rate (SWRR), qualitatively different effects were obtained for different gap size settings. For gap size 0.1, there was a significant main effect of tunnel type, where the reversal rate was higher in the tunnel conditions (F(2, 66)=3.842, p<.05; see Figure 3). Planned analysis of repeated contrasts revealed that only the difference between BL vs T1 was significant (F(1, 22)=10.63, p=.004). There was no significant effect of drowsiness. However, it can be noted that the number of reversals larger than 0.1 degrees were consistently lower in the drowsiness condition.
Figure 3: Effects of tunnel type and drowsiness on steering wheel reversal rate, gap size 0.1 deg.
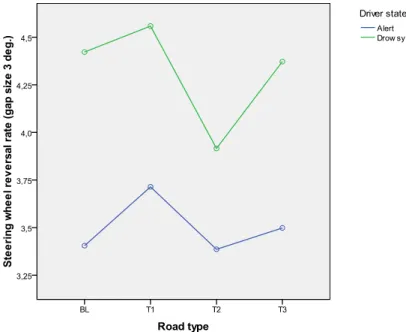
For SWRR with the gap size set to 3 degrees, the results were generally reversed to those obtained for gap size 0.1. Here, there was no effect of tunnel type although there was a trend for the contrast between T1 and T2 (p=.063). However, there was a main effect of drowsiness (F(1, 22)=7.354, p=<.05), where the number of reversals increased in the drowsiness condition. There was no significant effect of drowsiness order and no significant interactions. This is illustrated in Figure 4.
The analysis of mean speed found in Figure 5, expressed in km/h were not statistically significant but could illustrate a tendency towards a general speed reduction in tunnel driving. The mean speeds were lowest in tunnel 3 (T3) which had misleading visual cues.
Figure 5: Effects of tunnel type and drowsiness on mean speed.
Secondary task performance
Peripheral detection task (PDT) was used as a secondary task performance measure of mental workload. There were some main effects to be reported. Drowsiness significantly increased response times to the PDT (F(1, 21)=11.79, p=<.01). Tunnel type did not affect response times. There was no effect of tunnel type. The results are illustrated in Figure 6.
Figure 6: Effects of tunnel type and drowsiness on PDT response time (s).
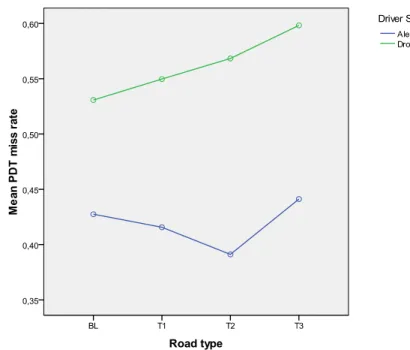
The distribution of PDT miss data was strongly skewed and, hence, the data was logarithmically transformed prior to statistical analysis. The results roughly mirrored those of the PDT response time, with a main effect of drowsiness (F(1, 22)=6.146, p=.021) but no effects of tunnel and no interactions (see Figure 7).
Figure 7: Effects of tunnel type and drowsiness on number of PDT misses.
The main results suggest that the effects of different tunnel designs used in this study do not affect performance significantly. They do, however, suggest that tunnel driving in general leads to compensatory behaviour due to increased effort. Moreover, the effects of drowsiness are clearly distinguishable in the primary and secondary task performance measures.
The influence of dynamic traffic in the road scenarios requires further investigation. It is conceivable that the presence of the autonomous vehicles have influenced the participants’ perception of the visual cues in the road scene because their presence in the optic field may have provided addition cues for e.g. lateral position, thus reducing the strength of the experimental cues. The presence of autonomous traffic does, however, increase the ecological validity of the scenarios. Primary task measures, such as mean speed and lateral performance are almost certainly directly affected by the presence of the other road users in the simulation. Further data analysis may elicit additional results hitherto unrevealed in the main-effects analyses in the present paper.
Drowsiness strongly affected both lateral vehicle control (in terms of increased standard deviation of lane position and more frequent steering reversals larger than 3 degrees) and visual detection performance (in terms of delayed response times and increased number of misses). The results provided less support, however, for the hypotheses addressing effects of tunnel design. There were some indications that tunnel driving in general leads to compensatory behaviour due to increased effort. A stronger indication of increased effort is the significant increase in micro steering corrections (SWRR with gap size 0.1 degree). This indicates that steering control becomes tighter when driving in tunnels.
Perhaps most importantly, there were no effects of the optical cues found in tunnel two (T2) and three (T3). This is somewhat surprising given that the optical effects could be considered as relatively strong. A possible explanation is that drivers mainly use existing lane markings as the main optical cues for lateral control and there is hence little room for improvement by adding optical cues on the walls or in the roof. Alternatively, misleading cues may have little effect since drivers quickly learn to disregard them, focusing instead on the cues that are provide correct guidance.
This indicates that tunnel wall decorations that unintentionally provide misleading cues may not be a road safety hazard. It is possible, however, that more transient misleading cues, or initially correct cues that unexpectedly becomes misleading, would have a larger effects. More in-depth analyses of the data will be necessary to include possible effects otherwise lost in the aggregated data set.
This study does not have enough evidence to suggest that it is safe to allow a multitude of ITS applications. Drivers do appear to exhibit a certain degree of subtle workload increases expressed in the ‘tighter’ lane position data and reduced speed. This could be due to heightened subjective feeling of workload and risk whereas the more objective data reflects no real increases.
REFERENCES
Beall, AC, & Loomis, JM (1996). Visual control of steering without course information. Perception, 25, 481-494.
Fuller, R. (2008). What drives the driver? Surface tensions and hidden consensus, Keynote at the 4th
Interna tional Conference on Traffic and Transport Psychology Washington, DC, August 31–September
4, 2008.
Klauer, S.G., Dingus, T. A., Neale, V. L., Sudweeks, J.D., and Ramsey, D.J. (2006). The Impact of Driver Inattention on Near-Crash/Crash Risk: An Analysis Using the 100-Car Naturalistic Driving Study Data. Report number DOT HS 810 594. Washington, D.C: National Highway Traffic Safety Administration. Lewis-Evans, B. & Rothengatter, T., (2009). Task difficulty, risk, effort and comfort in a simulated driving task—Implications for Risk Allostasis Theory. Accident Analysis and Prevention 41, 1053–1063.
Patten, C.J. D., Kircher, A., Ostlund, J., & Nilsson, L. (2004). Using mobile telephones: Cognitive workload and attention resource allocation. Accident Analysis and Prevention, 36, 341-350.
Recarte, M.A, and Nunes, L. (2002). Mental load and loss of control over speed in real driving. Towards a theory of attentional speed control, Transportation Research: Part F 5 (2002), pp. 111–122.
Van Winsum, W., Martens, M. & Herland, L. (1999). The effects of speech versus tactile driver support messages on workload, driver behaviour and user acceptance. Report TNO Human Factors Research Institute (in press), Soesterberg, the Netherlands.
Wilde, G.S.J., (1988). Risk homeostasis theory and traffic accidents: propositions, deductions and discussion of dissension in recent reactions, Ergonomics 3 (1988), pp. 441–468.