This is a submitted version of a paper published in IEEE Transactions on
Instrumentation and Measurement.
Citation for the published paper:
Ekström, M., Bergblomma, M., Lindén, M., Björkman, M., Ekström, M. (2012)
"A Bluetooth Radio Energy Consumption Model for Low Duty-Cycle Applications"
IEEE Transactions on Instrumentation and Measurement, 61(3): 609-617
URL:
http://dx.doi.org/10.1109/TIM.2011.2172997
Access to the published version may require subscription.
(c) 2012 IEEE. Personal use of this material is permitted. Permission from IEEE
must be obtained for all other users, including reprinting/ republishing this material
for advertising or promotional purposes, creating new collective works for resale or
redistribution to servers or lists, or reuse of any copyrighted components of this work in
other works
Permanent link to this version:
http://urn.kb.se/resolve?urn=urn:nbn:se:mdh:diva-13403
A Bluetooth Radio Energy Consumption Model
for Low Duty-Cycle Applications
M. C. Ekström
∗†, M. Bergblomma
∗‡, M. Lindén
∗, M. Björkman
∗and M. Ekström
∗∗
School of Innovation, Design and Engineering, Mälardalen University, Gurksaltargatan 9 72218 Västerås,
Sweden
†Email: martin.ekstrom@mdh.se
‡
Email: marcus.bergblomma@mdh.se
Abstract—This paper presents a realistic model of the radio energy consumption for Bluetooth equipped sensor nodes used in a low duty-cycle network. The model is based on empirical energy consumption measurements of Bluetooth modules. This model will give users the possibility to optimize their radio com-munication with respect to energy consumption whilst sustaining the data rate.
This paper shows that transmission power cannot always be directly related to energy consumption. Measurements indicate that when the transmission power ranges from -5 dBm to +10 dBm, the difference in consumed energy can be detected for each transmission peak in the sniff peak. However, the change is negligible for the overall energy consumption. The nonlinear behavior of the idle state for both master and slave when increasing the interval and number of attempts is presented. The energy consumption for a master node is in direct relation to the number of slaves and will increase by approximately 50 percent of the consumption of one slave per additional slave, regardless of the radio setting.
Index Terms—Energy model, Radio models, Power consump-tion, Bluetooth, Low-duty cycle applications
I. INTRODUCTION
This paper presents a radio energy model for Bluetooth 2.0 + Enhanced Data Rate (EDR) when using Bluetooth in a low duty-cycle network application for simulation studies with the possibility to predict the energy consumption, depending on the radio settings and the energy-affecting parameters. In the wireless communication research area energy conservation techniques are being developed at a fast rate. Simulation studies are made to find ways to prolong system lifetime. Such simulation studies often focus on the scheduling of transmissions within the sensor network. Researchers try to determine e.g. the optimal way of routing, the best topology, or whether the sensor node should aggregate data or not. All these topics are investigated with the intention of prolonging network lifetime.
It is generally understood that the radio is the most energy consuming part in short-range wireless networks nodes of low to moderate hardware complexity e.g. in wireless sensor network [1] [2] and it is a known problem that most energy models needs improvement [3]. An example is the work by Xiang et.al. [4], where a sniff scheduling scheme is presented to decrease the power consumption of Bluetooth communica-tion.
D. Macii and D. Petri have presented a method to produce an energy model for Bluetooth version 1.2 for a point-to-point
solution [5]. This does not include the possibility of changing the setting of the radio when using low power mode sniff to be able to lower the energy consumption depending on the application. A characterization of the power consumption is made by Cano et. al. [6], where a Bluetooth 1.1 module is investigated in point to point communication scenario. The power consumption in a scatternet scenario was investigated and modeled by Negri et. al. in [7] with an implementation based on Bluetooth version 1.2 chips.
Bluetooth is an evolving standard. The latest standard, Bluetooth version 4 [8], includes a low energy feature targeted at very low power consumption devices. A key focus of the development has been to decrease the latency when creating a connection. However, scatternet formations are not supported for these devices since a device is no longer permitted to have dual roles in Bluetooth version 4.
As far as the energy consumption is concerned, the most significant states for an active link with respect to the energy that sensor nodes change between are idle, receive and trans-mit. In this study the energy consumption for these different states are empirically measured and determined to enable an accurate energy model for the Bluetooth equipped sensor node. Most energy models have accurate transmission and receiving parts. However, assumptions regarding the energy consumption during the time the radio actively listens, but is not receiving data, must also be taken into consideration. Power consumption during idle radio time, i.e. the time when the radio does not listen, receive or transmit data, should also be taken into consideration when modeling the energy consumption. Radio circuits consume energy all the time unless they are completely shut off. This is also described by Bougard et. al. in [9] with the four different states as, shut-down, idle, transmit and receive. This shut-down state is similar to the sleep mode described in this paper, as it does not shut off the circuit totally but enters a low energy mode. Much like our model Bougard et. al. aim at modeling the average power consumption over time, depending on what states of the radio module are entered, however they use the IEEE 802.15.4 standard [9].
How distance affects the energy consumption is another issue concerning energy models for 2.4 GHz based radios. In short range communication the distance´s influence on the power consumption is limited. This is because the power consumption during the rx and tx states are comparable [9] and that idle listening together with processing time typically
is much longer than transmission time as stated by Negri et.
al. in [7]. The distance will also influence the time delay for
communication between two nodes in a scatternet which is investigated in the work of Etxaniz et. al. [10].
The aim of this study is to provide a realistic energy model based upon empirical measurements for Bluetooth equipped sensor nodes used in low duty cycle applications. This model will give users the possibility to optimize their radio commu-nication with respect to energy consumption with sustained data rate.
II. BLUETOOTHNETWORKCAPABILITIES
The Bluetooth system provides point-to-point connection or point-to-multipoint connections as described in [11]. Two or more devices sharing the same physical channel form an ad-hoc network or piconet. With one device acting as a master, up to seven other devices or slaves can be actively operating in the piconet. All devices in the piconet are synchronized to a common clock reference and frequency hop pattern, provided by the master. Bluetooth devices may operate in two or more overlapping piconets, creating what is referred to as a scatternet.
As stated in the Bluetooth specification for version 2 + EDR, each piconet is required to operate independently using a distinct hop pattern and master clock. Bluetooth is a technol-ogy that is suitable for short-range low duty-cycle applications where low power consumption is important, and at the same time it is necessary to support relatively high data transfer rates of up to 3 Mbit/s [12].
Being a technology optimized for portable devices with constrained power resources, Bluetooth offers various power saving modes which are used to reduce the duty cycle of devices: hold, park and sniff mode. In this study the sniff mode has been used for its low energy and low duty application capa-bilities. The basic idea of sniff mode is to reduce the duty cycle on a link between two devices by negotiating specific slots (sniff slots) where communication between devices can begin. If no communication takes place at these slots, the devices may spend the time until the next sniff slot in a low power mode. In the event of communication activity, the communication period (sniff event) can be extended dynamically until one of the devices decides to end the communication. The other device aborts the communication if it does not receive anything on the link for a configurable amount of slots. In fact, this behavior is specified only for the slave. However, if a master does not receive anything from a slave for some time (e.g. due to transmission errors), it has to assume that the slave has already gone back to low power state.
The sniff slots are determined by the user who is able to change the interval between the start of each sniff event or sniff peak. The interval setting is given in terms of the number of time slots. Each time slot is 625 µs long. The interval settings in this study range from 48 to 64000 time slots, which is equivalent to range of 30 ms to 40 s. Each sniff peak in this study is able to use 1 to 5 attempts to transmit and/or receive data.
III. MEASUREMENTSETUP
The following section describes the setup for the calibration and measurement. The measurement setup consists of two parts, the embedded measurement system on each sensor node and the data acquisition system (DAQ), which also acts as the wireless sensor network controller, referred to as the Net con-troller in the following section. All measurements performed in this study are made with the embedded measurement system.
A. Embedded measurement system
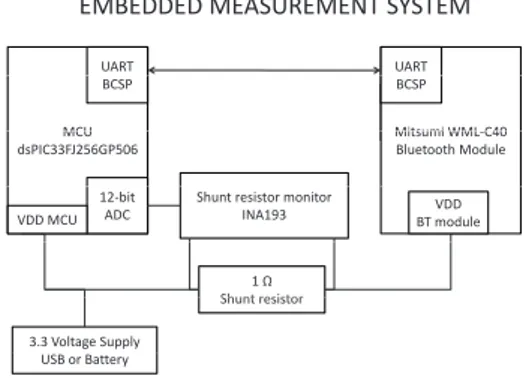
In this section the hardware that has been developed for this study to enable real-time energy measurements for Blue-tooth low duty-cycle applications is described. Each sensor node is equipped with an embedded measurement system connected to the micro controller unit (MCU), the MicroChip dsPIC33fj256GP506 operating at 80 MHz with a maximum sampling rate of 500 000 samples per second in the embedded 12-bit analog-to-digital converter [13]. This enables each node to monitor the Bluetooth radio modules power consumption with a sampling frequency of 25 kHz. A shunt resistor with a value of 1 Ohm has been used with a shunt resistor monitor, INA194 from Texas Instruments with a voltage gain of 50 and noise reduction filter, in order to measure the current consumption for the Mitsumi WML in real time [14]. The embedded measurement system is described in figure 1.
EMBEDDED MEASUREMENT SYSTEM
UART UART MCU BCSP UART BCSP Mitsumi WML C40 BCSP MCU dsPIC33FJ256GP506 Mitsumi WML!C40 Bluetooth Module Shunt resistor monitor
INA193 12!bit ADC VDD MCU BT moduleVDD 1 " Shunt resistor Shunt resistor 3.3 Voltage Supply USB or Battery
Fig. 1. Embedded Measurement System
The value of the shunt resistor is set to 1 Ohm as the resistance of the current meter should be very small and purely resistive as described by Cawley in [15]. The Mitsumi WML-C40 module is fully functional when in the voltage supply ranges between 3.2-3.4 Volt, as the maximum current consumption for the module is less than 80 mA, this result in 3.22 Volt as the lowest voltage supply when using a 1 Ohm shunt resistor.
The embedded measurement system has been calibrated with both a digital oscilloscope [16] connected to a PC with a LabView application [17] to determine the sampling rate, and a digital multimeter [18] to ensure an accurate current measurement and to compensate for the nonlinearity in the measurement system, as depicted in figure 2.
Fig. 2. Calibration of the embedded measurement system
A resolution of 17µA per bit of the embedded measure-ment system is sufficient since the lowest power consumption for the Bluecore 4 is 40µA [12]. The nonlinearity of the embedded measurement system is compensated by the MCU while recording the current consumption and converted into an average power consumption value before transmitting the measurement data to the Net controller. This on-chip measure-ment enables multiple simultaneous measuremeasure-ments and thereby utilizing the wireless sensor network capabilities. An example of this is that the transmitting and the receiving scenarios can be recorded at the same time. These measurement scenarios will be described in detail in section V.
B. Net Controller
The net controller is a software program running on a PC connected with a serial port to a Bluetooth dongle with an accessible Host Controller Interface (HCI). The software has been developed in LabWindows CVI [19] for this study. The program has two major tasks, collecting measurement data and send out configuration information to network nodes. The net controller specifies the topology of the network and link configurations between network nodes. The net controller allows the user to setup a wireless network and monitor the energy consumption for each node. This means that the wire-less network capabilities are used to create the measurements needed for developing the energy model for the Bluetooth radio in a wireless network. The advantages are that the energy consumption can be recorded for several nodes simultaneously e.g. both a master’s and a slave’s energy consumption can be recorded while the master is transmitting a packet to a slave.
IV. ENERGY AFFECTING PARAMETERS AND RADIO SETTINGS
This section will categorize the parameters and radio set-tings that influence the energy consumption in the radio model. Most parameters are simple to quantify, such as number of bytes transmitted or received, while surrounding environment is harder to control. These different parameters and radio settings are described below. The total energy consumption, ETotal, of a Bluetooth radio chip is modeled as a combination
of the idle energy consumption, EIdle, to uphold one or more
radio links, and the discrete energy for transmission and
reception of user data. Idle mode in this study is defined as that no user data is transmitted, however link manager data is still transmitted to uphold the radio link.
A. General Parameters
The parameters affecting the radio energy consumption that are not related to the settings of the radio module will be described in this section.
1) Transmission power vs distance : Transmission power
is not necessarily directly correlated to distance. The trans-mission power of the Bluetooth radio chip will affect the energy consumption, this is controlled by the radio power table in the Bluetooth stack with four discrete values for the Mitsumi WML-C40 Class 1 Bluetooth radio chip used in this study [20]. These available values are -5, 0, +5 and +10 dBm. When the received signal strength is outside a device’s preferred range it sends a request to the other device to increase or decrease its transmission power with one step in the above mentioned radio power table.
The measurements presented in Table I were performed to determine at what distances the radio changes transmission power for different environments. The table shows the maxi-mum distance for each transmission power when moving away from the transmitter (TX) and at what distance the transmitting power is lowered when moving towards the transmitter for different environments. The transmission power cannot be directly related to transmission distance without knowing the environment settings. The maximum distance may vary from 124 meters in near free space environments e.g. outdoors in low humidity to around 29 meters in very obstructed environ-ments [e.g. office to office when transmitter and receiver may communicate through a plaster wall or wooden door]. Whether or not the transmission power will have a significant influence on the energy consumption will be presented in section VI-B.
TABLE I
TRANSMISSION POWER COMPARED TO DISTANCE OF TRANSMISSION
TX Power Narrow Wide Outdoor Office to
corridor corridor Office Moving from TX -5 dBm ⇒ 0 dBm 4 m 1.5 m 1 m 0.5 m 0 dBm ⇒ +5 dBm 7 m 3.5 m 2 m 2 m +5 dBm ⇒ +10 dBm 8.5 m 6 m 4 m 4 m Maximum distance 105 m 90 m 124 m 29 m Moving towards TX +10 dBm ⇒ +5 dBm 4 m 2.5 m 3 m 4 m +5 dBm ⇒ 0 dBm 1.5 m 1 m 2 m 2 m 0 dBm ⇒ -5 dBm 0.5 m 0.5 m 1 m 1 m
2) Number of bytes vs number of packets: The number of
transmitted bytes as well as number of received bytes will affect the energy consumption for the radio model. The same number of bytes transmitted can be achieved by either trans-mitting a few large packets or several smaller packets. These measurements will determine the cost per byte dependening on whether small or large packets are used as well as on radio settings.
The Bluetooth standard uses different packet types to trans-mit data, therefore there is no linear relation for transtrans-mitted
bytes since it may cost the same amount of energy to transmit 25 bytes as well as 50 bytes. This is investigated and presented in section VI.
The relation between overhead and useful data bits in a packet should also be considered. The ratio between overhead and useful data bits will most likely change with different packet sizes and might be necessary to model depending on the model’s usage. The overhead is determined by the firmware on the Bluetooth module [21] as specified by the Bluetooth standard and cannot be altered by the user in the setup used in this study.
B. Sniff mode specific parameters
For this study the sniff mode has been chosen since it is very suitable for low duty-cycle applications. Sniff mode is a low power mode that utilizes deep-sleep between sniff peaks if the interval is greater than 160 time slots (100 ms). When using sniff mode for the Bluetooth radio energy model there are mainly three different settings that influence the overall behavior and energy consumption of the Bluetooth module: the sniff interval as described above, the number of attempts (can be configured to conform with application demands), and the role of the sensor node in the network. These settings will be called Interval, Number of Attempts and Role in the energy model and the rest of this paper.
1) Interval: The interval setting determines the number
of time slots between the start of the sniff peaks. To fully understand the behavior of the radio, the sniff peak energy consumption has been recorded and the energy consumption for each sniff peak depending on interval and attempts has been parsed out. The relation between the parameter interval and the amount of energy each sniff peak consumes is depicted in figure 3. Longer intervals lead to that each sniff peak will consume more energy, however it is not a linear relation.
Fig. 3. Energy per sniff peak for a slave node in idle state with 5 attempts
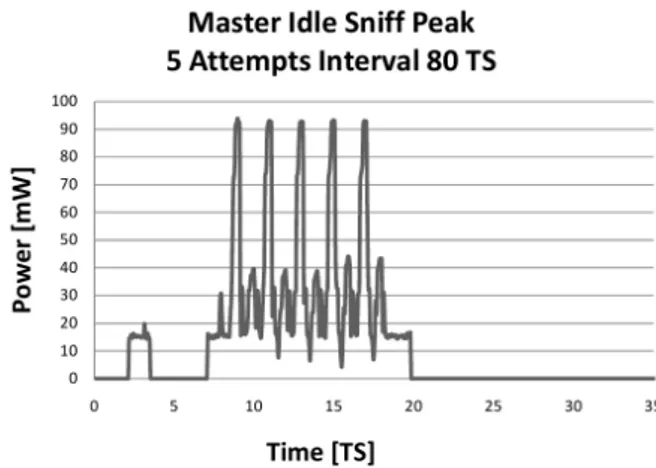
The difference in energy consumption for each sniff peak depending on the interval becomes evident when comparing figures 4 and 5, where the same number of attempts are set but the interval is increased from 80 time slots in figure 4 to 1024 time slots in figure 5. This also illustrates that the master is able to ignore to perform attempts number 3-4 when nothing
is transmitted or received in higher intervals than 160 time slots. However the radio needs more time to synchronize and uphold the link when increasing the interval and thereby the energy consumed per sniff slot is increased, as illustrated in figure 3.
Fig. 4. Energy consumption for a master node with 5 attempts and an interval of 80 TS
Fig. 5. Energy consumption for a master node with 5 attempts and an interval of 1024 TS
2) Number of attempts: The number of attempts per sniff
peak and the interval between the sniff peaks will have a major influence on the energy consumption and performance. The difference in power consumption depending on the number of attempts is depicted in figures 4 and 6. In figure 6 the interval is set to 80 time slots and 1 attempt whereas in figure 4, the number of attempts has been set to 5 and thereby this sniff slot requires more time to perform all attempts.
V. MEASUREMENTS
This section describes the measurements that have been performed and will show parts of the measurement results that the energy model is based upon. To be able to compare the energy consumption between the different transmission powers, all measurements in the following section have been performed for all four transmission powers available in the
Fig. 6. Energy consumption of a master node with 1 attempt and an interval 80 TS
radio table on the firmware on the Mitsumi WML-C40 Blue-tooth module. In the low power mode sniff there are three parameters that can be altered to fit the application. These parameters are the interval between the start of each sniff peak, the number of attempts allowed in each sniff peak and the number of slaves connected to the master in each piconet. In this study, these parameters have been set as described in the following sections to determine the energy characteristics for the Bluetooth radio when applied in a low duty-cycle application. The measurements have been divided into Idle, Transmit and Receive.
A. Idle
Many low duty-cycle applications spend most of their active time in idle or sleep mode, therefore it is important to investigate the behavior and energy consumption in this state. Idle measurements has been performed for intervals varying from 48 to 64000 time slots, with a step of 16 time slots per measurement in the 48 up to 800 time slots interval range, then increasing the step to 160 time slots in the interval range from 800 - 3200 time slots, and the step was further increased to 1600 time slots in the range of 4800 to 64000 time slots. When the radio is in idle state link manager packet are still transmitted.
The number of attempts was varied between 1 and 5 for each interval. Each measurement test scenario was performed for both master and slave with a measurement time of 10 minutes per measurement in order to acquire the average power consumption.
This measurement setup was repeated for each of the four transmission power to be able to determine the influence that transmission power will have on the idle state.
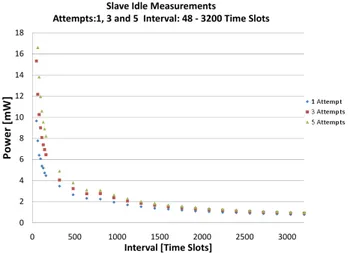
The results of the idle measurements for a slave node are presented in figure 7 where the y-axis represents the average power consumption in mW and the x-axis is the interval settings ranging from 48 to 3200 time slots. The three different measurement series presented are for a slave node with 1, 3 and 5 attempts allowed respectively.
A big difference between the master and slave roles is that the master can connect up to 7 slaves at once in each piconet
Fig. 7. Measured mean power consumption for a slave in idle mode with interval 48 - 3200 TS and attempt set to 1, 3 and 5
whereas the slave only connects to one master. In this study, the energy consumption for a master has been measured with the same method as for the idle states for the slave, with the addition of number of slaves connected in the piconet. Figure 8 shows the increased power consumption for a master depending on the increased interval and the number of slaves connected in the piconet.
Fig. 8. Measured mean power consumption for a master in idle mode with interval 48 - 1600 TS, attempt set to one and 1,3,5,7 slaves connected
B. Transmit and Receive
The measurement for transmit and receive is made si-multaneously; the energy consumption is recorded, with the embedded measurement system, on the sensor node as the master transmits and the slave receives, and vice versa. The measurement setup for transmit and receive were as follows; 1000 packets were sent and received per packet size, the packet size varying from 25 to 250 bytes with an increment of 25 bytes per step. This was made for all interval and attempt settings as described in section V-A in order to complement
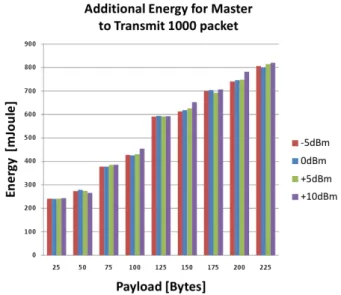
the idle measurements. The measurements were performed for all transmission powers for both master and slave resulting in a total of 3960 measurements including both transmit and receive. The measured average additional energy in millijoule [mJ] for transmitting 1000 packets for a master depending on payload and transmission power are shown in figure 9. The master radio settings are 48 time slots and 1 attempt.
Fig. 9. Additional average energy consumption to transmit 1000 packets for a master node with an interval of 48 TS and 1 attempt
VI. RESULTS ANDDISCUSSION
The results presented in this section are divided into the main parts transmission power and energy model.
A. Transmission power
The energy consumption due to transmission power is a major part in this study and all measurements described in section III have been performed with all four different transmission power settings. The results are similar to what David Macii et. al. describe in [22], the transmission power will not significantly affect the overall energy consumption since the maximum transmission distance is about 100 me-ters. The increased energy consumption because of increased transmission power is detectable when looking at a single sniff peak, but not when measuring the overall energy consumption. This has its explanation in that the transmission slot is too short at 625 µs and the increased power consumption is a maximum of 6mW when comparing the lowest transmission power at -5 dBm to the highest of +10 dBm, which is the highest transmission power allowed by the radio transmission power table determined by the firmware on the Bluetooth module. This means that the maximum possible difference would result in a total extra energy of 2.5 µJ per attempt. The energy variation for the sniff peak is greater than the energy for the additional transmission power as seen in figure 9.
B. Energy model
This section will present the energy model developed with non-linear regression from the measurements described in the previous sections. To create an energy model, the different parameters in the model need to be identified. In this equation-based model, the sniff peak is the common nominator to understand the behavior of the radio.
The total energy consumption can be calculated with each state simply added with the number of packets transmitted or received with packet size and settings for the radio, and then multiplied with the time given in seconds as shown in equation 1. In all equations presented below, time (T ) is given in seconds, Attempts (Att) is the number of attempts (ranging from 1-5) allowed per sniff peak, the Interval (Int) ranges from 48-64000 time slots. The number of packets (nP ackets) represents the total number of packets of a given payload (P L), given in bytes, that are transmitted during the time in which the energy consumption is to be calculated. The master and slave behaves differently, therefore they are represented by two different sets of coefficients.
ETotal= EIdle+ ETX+ ERX (1)
Equation 1 should be read as; the total energy for a node in a certain role is the sum of the energies for the node in idle state, additional energy for transmitting and receiving. How to calculate these energy values is described below. The energy model can be used in simulation studies to evaluate how radio settings, packet size and network topology effects the energy consumption of the Bluetooth radio in low duty-cycle applications. For all equation nonlinear fitting has been used to find the best equation coefficients for the following equations.
1) Idle model: The energy model for idle mode, EIdle,
is divided into three functions presented in equation 2. The different functions of the equation is described below.
EIdle= A(Att) · B(Int, Att) · C(Con) · T (2)
The function A(Att) describes the relation between the increased number of attempts and the increased energy con-sumption of the master and slave. Both the length of the sniff peak and the average level of power consumption increases with Att. The reason for this is that the radio module consumes more power when its listens, receives or transmits data as compared to when it only computes data. An increased number of attempts leads to a higher increase of energy consumption for each sniff peak for a master than a slave, even though the master has the possibility not to use all attempts if nothing needs to be transmitted. The reason is that the master controls the communication and will have a longer active time in each sniff peak. This leads to that the function A(Att) is linear for the slave but has a nonlinear part for the master. A second degree polynomial has been chosen to model A(Att) for the master where for the slave the coefficient a2is zero in
equation 3.
The function B(Int, Att) is to describe how the interval setting influence the energy consumption. As described in section IV, the interval setting does not only influence the time the radio module enters deep-sleep but it also affects the time and energy consumption of each individual sniff peak. As seen in figure 3, the amount of energy per sniff peak increases as the intervals increase, due to the fact that the computation time needed to uphold the link is distributed over fewer peaks and therefore each sniff peak needs to be longer. Since it also results in longer time in deep-sleep the overall energy consumption decreases with longer intervals. The listening window to capture the start of a sniff slot packet increases with a longer interval setting as stated in the Bluetooth specification [12]. Since this leads to an increased active listening time during a sniff slot the energy consumption will increase during sniff peak with long intervals. To capture this behavior an exponential function has been chosen to model B(Int, Att), as seen in equation 4, with different coefficients for master and slave. The number of attempts will affect this function as an increased number of attempts will result in more time slots in each sniff peak, leading to more available computation time to uphold the link as described above. This will decrease the parameter interval’s affect on the length of the sniff peak described above.
B(Int, Att) = Int−(b0+b1·Att) (4)
The function C(Con) describes the amount of additional energy that is dissipated by a node as a function of the number of connections. The big difference between the master and the slave is that the master’s energy consumption increases approximately by 50 % anytime an additional slave joins the piconet. On the contrary, a slave is not affected by number of connections (Con). Coefficients c0 and c1 is set to one and
zero respectively in equation 5 for a slave.
C(Con) = c0+ c1· C on (5) Combining equations 3 - 5 in equation 2 results in equa-tion 6.
EIdle=
a0+ a1· Att + a2· Att2
Int(b0+b1·Att) · (c0+ c1· C on) · T (6)
The equations in this paper are designed to model the behaviour of the Bluetooth radio as specified in the BT specification. The overall energy consumption for a Bluetooth radio version 2.0 in sniff mode is well described with the relation of time spent in sniff peaks versus the time spent in sleep mode, as most energy is needed in the sniff peak. The parameters that affect this relation, but also the energy for each sniff peak, are of course the interval setting but also the number of attempts and the number of connections for a master node. Additional connections will increase the amount of time spent in active mode per interval. Changing the radio chip will probably change the coefficients presented in Table II but the energy consumption can still be modeled as described in equations 1-7 as the behaviour of the sniff mode need to follow the specification valid for all Bluetooth 2.0 chips.
2) Transmit and Receive model: The additional energy
consumed by the radio to transmit or receive any number of packets, nP ackets) is described in equation 7 for the master or slave.
ETX/RX= nP ackets · P L · d0· Att
d1
(7) This equation is applicable for any number of packets with a payload (P L) that range from 25 to 250 bytes. The energy model includes the embedded header that the Bluetooth standard includes for packet error handling. The coefficients for the model are presented in section VI-C. The energy consumption for changing the transmission power is presented in the conclusion. The last factor of the transmit and receive equation Attd1 shows that the additional energy decreases to
transmit or receive user data with the increase of the number of attempts. Equation 7 models the amount of additional energy needed to transmit or to receive a data packet which depends linearly on the payload size and nonlinearly on the number of attempts. The slave needs more additional energy than the master. This can be explained by the fact that the master controls the communication and can therefore enter deep sleep faster.
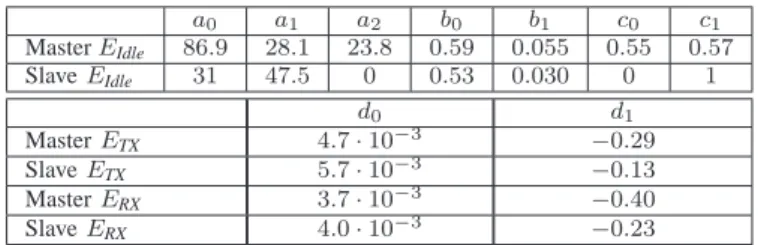
C. Energy model coefficients
For a Mitsumi WML-C40 module [20] equipped with the widespread CSR bc04 chip [21] the coefficients for the model are reported in Table II. For a slave, the coefficients a2, c0
and c1 are set to zero, zero and one respectively regardless of
the model of the radio module.
TABLE II MODELCOEFFICIENTS a0 a1 a2 b0 b1 c0 c1 Master EIdle 86.9 28.1 23.8 0.59 0.055 0.55 0.57 Slave EIdle 31 47.5 0 0.53 0.030 0 1 d0 d1 Master ETX 4.7· 10−3 −0.29 Slave ETX 5.7· 10−3 −0.13 Master ERX 3.7· 10−3 −0.40 Slave ERX 4.0· 10−3 −0.23
From Table II it is seen that the additional energy consump-tion to transmit and receive user data is larger for a slave than for a master node.
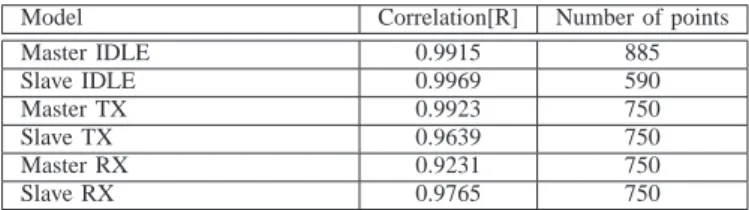
D. Goodness of fit
The correlation, R, between measured and expected data is tested for each individual part of the model to determine the goodness of fit of the individual parts of the model. The result of the correlation test is presented in Table III with the number of points used in the test.
The correlations value for the master RX can be explained with the master’s possibility to control the communication and not use all attempts in each sniff peak. This results in a behavior that is not as predictable as the other parts of the model.
GOODNESS OF FIT
Model Correlation[R] Number of points
Master IDLE 0.9915 885 Slave IDLE 0.9969 590 Master TX 0.9923 750 Slave TX 0.9639 750 Master RX 0.9231 750 Slave RX 0.9765 750 E. Comparison
In this section, the energy model is compared with measured values for the different scenarios described in Table IV. The measurements performed to extract the energy model coeffi-cients used a fixed transmission power and measurement time. In the comparison measurements, Table V, the transmission power is controlled by Bluetooth’s power control scheme. The measurement time is the time needed to transmit 1000 packets for each scenario. The calculated and measured values are shown in Table V,the third column shows the measured time that is spent to calculate the energy consumption.
TABLE IV
MEASUREMENT SCENARIOS FOR MODEL COMPARISON
Scenario Interval Attempts nPackets Payload Master TX 1 160 TS 1 1000 100 bytes 2 320 TS 3 1000 50 bytes Slave TX 3 320 TS 3 1000 25 bytes 4 800 TS 5 1000 50 bytes Master RX 5 320 TS 3 1000 25 bytes 6 800 TS 2 1000 75 bytes Slave RX 7 160 TS 1 1000 100 bytes 8 800 TS 1 1000 75 bytes TABLE V
MEASURED VALUES COMPARED TO CALCULATED VALUES
Scenario Measured [mJ] Calculated [mJ] Time [s] Error[%]
1 638.5 625.5 28.89 2.08 2 528.6 517.1 57.81 2.22 3 407.5 400.3 56.74 1.80 4 649.3 638.0 141.42 1.77 5 407.4 424.9 56.74 -4.12 6 586.4 593.5 141.82 -1.20 7 514.9 530.4 28.50 -2.92 8 601.9 584.4 141.83 2.99 VII. CONCLUSIONS
We have in this paper presented an empirically based energy model for a Bluetooth v 2.0 +EDR based radio module when using sniff mode. We have shown that transmission power cannot always be directly related to energy consumption. Our measurements indicate that when the transmit power ranges from -5 dBm to +10 dBm, the difference in energy can be detected for each attempt in the sniff peak. However, the change is negligible for the overall energy consumption. The explanation lies in that the transmission peak changes at most
from 92 mW for -5 dBm to 96 mW for +10 dBm for a maximum of 625 µs when transmitting a packet, resulting in a total extra energy of only 2.5 µW per attempt peak. The variations for the sniff slots are greater than the additional transmission power. This confirms the assumption made by Macii et.al. in [22] that the power consumption is not affected when transmitting in the tens of meters due to the low transmission power. The distance may, however, affect the energy consumption, since longer distances may increase the probability that a packet needs to be retransmitted due to full or partial packet loss. This must be investigated further before any conclusions can be drawn on how much the environment and the distance affects the total energy consumption.
REFERENCES
[1] Kemal Akkaya and Mohamed Younis. A survey on routing protocols for wireless sensor networks. Ad Hoc Networks, 3(3):325 – 349, 2005. [2] I. F. Akyildiz, W. Su, Y. Sankarasubramaniam, and E. Cayirci. Wireless sensor networks: a survey. Computer Networks, 38(4):393 – 422, 2002. [3] Ewa Hansen. Centralized routing for prolonged network lifetime in
wireless sensor networks. Licentiate thesis, January 2008.
[4] Li Xiang and Yang Xiaozong. A sniff scheduling policy for power saving in bluetooth piconet. In Parallel and Distributed Systems, 2005. Proceedings. 11th International Conference on, volume 1, 2005. [5] David Macii and Dario Petri. An effective power consumption
mea-suremetn procedure for bluetooth wireless modules. In IEEE Trans-actions on Instrumentation and Measurements, volume 2, pages 1355– 1364, August 2007.
[6] J.-C. Cano, J.-M. Cano, E. Gonzalez, C. Calafate, and P. Manzoni. Power characterization of a bluetooth-based wireless node for ubiquitous computing. In Wireless and Mobile Communications, 2006. ICWMC ’06. International Conference on, page 13, 2006.
[7] L. Negri, J. Beutel, and M. Dyer. The power consumption of bluetooth scatternets. In Consumer Communications and Networking Conference, 2006. CCNC 2006. 3rd IEEE, volume 1, 2006.
[8] Bluetooth SIG. Bluetooth Core Version 4.0, year = 2010.
[9] Bruno Bougard, Franky Cathoor, Denis C. Daly, Anantha Chandrakasan, and Wim Dehaene. Energy efficiency of the IEEE 802.15.4 standard in dense wireless microsensor networks: Modeling and improvement perspectives. In Proceedings of Design, Automation and test in Europe Confrence and Exhibition, volume 3, 2005.
[10] J. Etxaniz, A. Alonso, and G. Aranguren. Influence of the the distance between bluetooth 2.0 nodes and their link mode with the communica-tion delay. In Advances in Circuits, Electronics and Micro-Electronics (CENICS), 2010 Third International Conference on, 2010.
[11] Cambridge Silicon Radio. Bluecore scatternet support. http://www.CSR.org, 2005.
[12] Bluetooth SIG. Bluetooth specification version 2.0 + enhanced data rate, 2006.
[13] Microchip. DsPIC33F256GP506. http://www.microchip.com/wwwproducts/ Devices.aspx?dDocName=en546062, April 2008.
[14] Texas Instrument. Shunt resistor monitor INA194. http://focus.ti.com/docs/prod/folders/print/ina194.html, Januari 2008. [15] K. Cawley. Power supply transient response considerations when
testing portable devices. In Keithley Instruments White paper no. 2032 Cleveland, OH, volume 2, April 2003.
[16] Tektronix. Digital oscilloscope TDS 3012. http://www.home.agilent.com/agilent/product.jspx?pn=34410A, May 2010.
[17] National Instruments. LabView. http://www.ni.com/labview/, 2010. [18] Hewlett Packard. Digital multimeter 34401A.
http://www.tek.com/products/oscilloscopes/, May 2010.
[19] National Instruments. LabWindows CVI. http://www.ni.com/lwcvi/, 2010.
[20] Mitsumi. Bluetooth module WML-c40 class 1. http://www.mitsumi.co.jp, 2005.
[21] Cambridge Silicon Radio. Bluecore 4 external. http://www.CSR.org, 2007.
[22] David Macii, Anton Ageev, and Luca Abeni. An energy saving criterion for wireless sensor networks with time synchronization requirements. In Industrial Embedded Systems (SIES), 2010 International Symposium on, pages 166 –173, jul. 2010.