Can increases in public transport supply be justified by
concern for low-income individuals?
Disa Asplund and Roger Pyddoke
The Swedish National Road and Transport Research Institute (VTI) Division of Transport Economics
CTS Working Paper 2018:7
Abstract
This paper evaluates the impacts of different sets of distributional weights on optimal bus fares and frequencies in the small Swedish city of Uppsala. The model used represents choice between: three transport modes—public transport, cars, and a combination of walking and cycling; two time periods— peak and off-peak hours; two zones; and three origin–destination combinations. Five scenarios are evaluated: the base year (2014), a welfare-optimal combination without distributional concerns, and welfare-optimal policies for three sets of distributional weights with increasingly larger weights on low-income individuals. The main results are that, compared with the welfare-optimal scenario without distributional weights, increasing the weights of the low-income group successively increases service frequencies and reduces fares. However, comparing the simulated results with the actual fares and frequencies in Uppsala in 2014, optimal frequencies with even the most far-reaching distributional objectives are lower.
Keywords: Income distribution, Distributional weights, Optimization, Public transport, Welfare, Fares, Frequencies
JEL codes: R41, R48, R10
Centre for Transport Studies SE-100 44 Stockholm
Sweden
2
1 INTRODUCTION
One of several motives for using subsidies of public transport (PT) to reduce fares and increase supply in Sweden is that this will benefit low-income households. However, high-income individuals benefit more than do low-income individuals from shorter travel times (less congestion) and shorter waiting times (higher service frequency) as they generally value travel time more highly. On the other hand, low-income individuals (outside the largest cities) benefit more from using PT more often, so it is unclear which group will benefit the most in practice. The present study analyzes the impacts of different distributional weights on fares and frequencies optimized to maximize welfare in PT in Uppsala (Sweden’s fourth largest city with 155,000 inhabitants). This is done using three sets of distributional weights on two income groups (i.e., low income and other) compared with a baseline scenario, representing mode shares for passenger transport in 2014. The effects are calculated separately for three types of trips in two zones (i.e., two intra- and one inter-zonal types) and in peak and off-peak hours. The distributional effects are based on calculations of the per capita changes in consumer surplus for each group. These welfare changes are in turn weighted by the three sets of distributional weights. We propose a simple method to account for distributional effects in a partial equilibrium framework in a cost-effective manner, using the marginal cost of public funds (MCPF) as the shadow price of redistribution. We analyze increased price differentiation between income groups. If fares differ considerably between the employed and non-employed, this may affect the incentive to work, and this effect is excluded from the analysis. However, the unemployed do not constitute a large share of low-income bus riders in Uppsala, about 50% of whom are schoolchildren and students, according to our data.
The efficiency arguments for subsidization include the Mohring (1972) effect (i.e., reduced waiting times from higher frequencies that cannot be capitalized by operators), reduced street congestion, and wider economic benefits, mostly in terms of the labor market gains arising from higher accessibility of jobs. Of less but perhaps not negligible importance are reduced air pollution and noise. In a recent project, Asplund and Pyddoke (2019) developed a new model—the BUPOV1 model—that focuses on urban bus service, inspired by Börjesson, Fung, and Proost (2017). This model was calibrated and aggregate welfare was optimized in terms of the decision variables peak- and off-peak fares and the frequency of bus services in a small city. In the present study, the BUPOV model is extended, dividing the consumers into two income groups. This study also includes a description of travel mode distribution among various consumer groups in Uppsala. The model represents demand for bus services and alternative modes. It is based on a radial spatial representation of the city with two zones, an
1 From Swedish Bussutbud- och prissättning—optimeringsverktyg (bus supply and pricing— optimization tool).
3
inner and an outer zone. The analysis is restricted to weekday traffic, divided into two time-period categories, peak and off-peak hours. This representation makes it possible to analyze fares and frequency differentiated in time and space. The scope is intended to capture the major welfare effects of the parts of the trips that are within city boundaries of all trips starting or ending in Uppsala.
The paper starts from the assumption that all PT users have the same income and pay the same price. We then address the question of what the optimal price and frequency should be when the PT authority can price two income groups—a income group and all others—differently, and when the welfare of the low-income group is given successively larger relative distributional weights. In this context, the larger distributional weight is justified solely by a lower income per household member.
An important result is that with only efficiency motives and no distributional concerns, considerably lower fares can be justified, which has important welfare and distributional consequences; however, this comes with considerably lower service frequencies. Second, weighting low-income individuals’ wellbeing higher will lead to higher frequencies in most areas, but even the highest weights on the low-income group do not lead to the initially observed high frequencies.
Transport models are typically a subcategory of partial equilibrium models, as is BUPOV. That is, in contrast to general equilibrium models, the scope is the equilibrium in only one sub-market of the general economy. This reduction in scope reduces the number of calculations and data needed. However, it is important to remember the connections to other markets and, in some cases, to make adjustments to capture effects on important secondary markets. In the transport case, one such important market is the labor market. When it comes to distributional issues, it is crucial to recognize the connection to the general equilibrium effects on the labor market via the general tax system. Without such considerations, redistribution policies will generally not be cost effective.
Many studies have examined the distributional effects of car taxation and congestion charging.2 Some papers studying car taxation also study PT, for example, Berri (2005) in France and Aasness and Røed Larsen (2003) in Norway, but relatively few study the redistribution effects of PT pricing and frequency. A few studies estimate how much different population groups benefit from PT subsidies in general from their usage propensity. Fearnley (2006) found that, in the UK, bus subsidies predominantly benefited low-income households, while railway subsidies predominantly benefited high-income households. Börjesson, Eliasson, and Rubensson (2018) studied the distribution of PT subsidies across the Stockholm region population. They found that the mean received subsidy did not vary much with income but instead varied with residential area. Fearnley and Aarhaug (2019) studied the Greater Oslo region and found that high-income groups using intercity train services often received the largest subsidy per
2 Car taxation: Poterba (1991), Blow and Crawford (1997), and Bento, Goulder, Jacobsen, and von Haefen (2009); congestion charges: Eliasson and Mattsson (2006), Eliasson (2016), and West and Börjesson (2018).
4
passenger-kilometer, but that low-income individuals received slightly more in total due to more frequent usage of local PT trips.
Bureau and Glachant (2011) used 2001–2002 travel survey data from the Paris region to study the distributional effects of fare reductions and speed increases in PT, assuming constant behavior. They found that fare reductions generally benefited low-income individuals more than did speed increases. Kilani, Proost, and van der Loo (2014) studied reforms in combinations of congestion charging and PT, analyzing efficiency and distribution effects on different types of households, also in Paris. They used two alternative social welfare functions: one with equal weights on all incomes and no extra costs for public funds generated inside or outside the transport model, and another with a double weight on the utility of the lowest quartile of incomes, also with no extra costs for public funds. Locations of residents and workplaces were kept fixed. The authors calculated optima for several scenarios, some of which implied giving a double weight to low-income individuals. They found that the scenario yielding the highest total welfare with this distributional weighting is a scenario introducing road charges combined with increases in PT supply and PT fares, relative to a baseline with considerable congestion and crowding problems.
Compared with Bureau and Glachant (2011), this study uses more aggregated welfare calculations, treating low- and higher-income individuals as homogenous groups but considering the substitution between modes and the full welfare effect of these changes. Our approach is more similar to that of Kilani et al. (2014), though unlike them, we focus on a small city and optimize PT fares and frequencies, disregarding congestion taxes. However, Kilani et al. (2014) analyzed only two social welfare functions, one of which was ad hoc. Here, we analyze the consequences of three social welfare functions, all explicitly referring to economic theory and to empirically estimated parameter values. A difference from Kilani et al. (2014) is that we do not explicitly analyze alternative forms of the redistribution of surpluses generated for the public sector,3 though we do recognize this issue through a shadow price of redistribution.
The paper is organized as follows. In the first section, the purpose and main results are presented. The second section presents the theoretical background, while the third presents the model and the fourth the analyzed scenarios. In the fifth section, the data are used to calibrate the model to Uppsala. The sixth section gives the results and the seventh, finally, discusses the results and concludes the paper.
2 THEORETICAL BACKGROUND
The purpose of this paper is to explore the relationship between the specified objectives and the optimal policies these objectives lead to; the goal is not to
3 In Sweden, public transport and healthcare are organized on the regional governance level, so this may be the most obvious sector for the alternative use of resources.
5
advocate any particular formulation of a social welfare function or any particular PT policy.
It is often assumed that total welfare in society can be expressed as a function (Burk, 1938) of all n individuals’ utilities, which in turn are functions of their consumption:
𝑊 = 𝑊(𝑈1(𝑐1), 𝑈2(𝑐2), … . , 𝑈𝑛(𝑐𝑛) ) , (1) where 𝑊 is the total welfare in society, 𝑈𝑖 is the utility of individual 𝑖, and 𝑐𝑖 is the consumption of individual 𝑖. Implicit in (1) is that the utility of one individual can be compared to the utility of another individual, i.e., the utility functions are cardinal.4 This means that the marginal change in total welfare in society from an increase in individual 𝑖’s consumption (or income) can be expressed as:
𝛽𝑖 =𝜕𝑊 𝜕𝑐𝑖 = 𝜕𝑊 𝜕𝑈𝑖∙ 𝜕𝑈𝑖 𝜕𝑐𝑖. (2) Here, 𝜕𝑊
𝜕𝑈𝑖 refers to the social welfare weight that society assigns to each individual
and 𝜕𝑈𝑖
𝜕𝑐𝑖 is the marginal utility of consumption. The combined factor 𝛽𝑖 will here
be referred to as the distributional weight.
An alternative formulation of utility is ordinal utility, which denies the possibility of interpersonal comparisons of utility. Here Pareto efficiency is a central term. A solution to an economic problem is called Pareto efficient if no individual can be made better off without any other individual being made worse off. However, since the number of Pareto-efficient solutions can be vast, this principle alone gives little guidance as to what policy to choose in practice, but is a natural candidate as a selection criterion for a feasible set of possible policies (even for a cardinal approach).
If reforms are required to be Pareto improving,5 then the set of possible reforms is small. The Kaldor–Hicks criterion is a principle for assessing reforms that captures some of the intuitive appeal of Pareto efficiency but is less stringent and hence implies a larger set of possible reforms. Under Kaldor–Hicks efficiency, an outcome is considered better if a Pareto-efficient outcome can be reached by arranging the transfer of sufficient compensation from those who are made better off to those who are made worse off so that everybody ends up no worse off than before. However, only if compensation is both carried out and accepted, i.e., a compensation market exists, does a Kaldor–Hicks improvement imply a Pareto improvement. Otherwise, as attractive as it may seem, the Kaldor–Hicks
4 The existence of a cardinal utility function was very controversial and extensively discussed in the early 20th century, since the empirical weights implied vast redistribution compared with the current situation. However, in 1936 Alt showed that relatively simple assumptions are sufficient to imply a cardinal utility function. Today, cardinal utility is used in some branches of economics only, but this concept has recently attracted revived interest among theorists (see Köbberling, 2006).
5 In the present study, the Pareto improvement restriction is not employed; however, Asplund and Pyddoke (2019) performed such analysis with one income group only.
6
criterion will not offer a means to make value-free aggregations, but will imply interpersonal comparisons of utility, as does the cardinal utility approach. Then the only way to avoid interpersonal comparisons and remain rigorous is to adhere strictly to the Pareto principle and to use nonaggregate cost–benefit analysis (CBA) (i.e., displaying the complete distribution of impacts for each individual separately), leaving the choice between all possible Pareto-efficient projects to the decision maker.
In line with the Kaldor–Hicks criterion, Harberger (1978) advocated not using distributional weights in the CBA of a specific project if it is possible to find a more efficient redistribution mechanism outside the project. He further argued that under optimal redistribution, the weights on rich versus poor would be nearly equal and could consequently be ignored. Therefore, in CBAs of, for example, national infrastructure projects, the distributional weights are often set to 1 (it is also standard practice to assume that the utilities of individuals are additive). However, Layard (1980) replied that if redistribution generates a deadweight loss (i.e., due to taxation), then a difference in weights between rich and poor remains even after optimal redistribution.
In some cases, such as the CBA of climate change mitigation (see, e.g., Stern, 2006), redistribution is complicated to the extent that optimal redistribution may not even be possible outside the project. This restriction provides a rationale for the use of distributional weights in this setting. When distributional weights are applied, the standard assumption is that all individuals have the same utility function and the same individual weight in the welfare function, 𝜕𝑊
𝜕𝑈𝑖 = 1, so that
𝛽𝑖 = 𝜕𝑊 𝜕𝑐𝑖 =
𝜕𝑈𝑖
𝜕𝑐𝑖
is the income weight.
The utility function of an individual is usually defined in the positive quadrant and is concave, reflecting the rule of diminishing marginal utility. The elasticity of marginal utility of consumption (EMUC) is the parameter that determines how fast marginal utility decreases with consumption. It is defined as:
𝜂 = −𝑐∙𝑈´´(𝑐)
𝑈´(𝑐) . (3) EMUC has been estimated using a range of methods. From it, utility-based weights on marginal income can be estimated, for example:
𝛽𝑖 = 𝜕𝑈𝑖 𝜕𝑐𝑖 = ( 𝑐𝑖 𝑐̅) −𝜂 , (4) as proposed.
For an extensive review and discussion of the use of distributional weights in CBA, see Fleurbaey and Abi-Rafeh (2016).
7
3 THE BUPOV MODEL
This study uses and develops the BUPOV model (Asplund & Pyddoke, 2019), which was designed to capture the effects of fares and frequencies on mode choice, trip timing, and welfare in small and medium-sized cities with one PT mode. The model is based on travel behavior in Uppsala in 2014. The spatial distribution of residences and workplaces are assumed to be constant. There are two time periods, i.e., peak and off-peak hours, and we assume that the city has two zones: city center (i.e., inner zone) and outer city (i.e., outer zone). Travelers can choose between three modes: car, bus, and walking/bicycling (WB).
The mode choice depends on the monetary costs, time gains and losses due to changes in PT frequency, road congestion, and the nuisance caused by crowding in PT vehicles. In addition to the effects on producers and consumers, there are effects on freight traffic and health (i.e., noise and air pollution) as well as carbon dioxide emissions. The PT supplier runs a deficit in both the reference and optimum scenarios. The changes in deficit are evaluated using an MCPF factor of 1.3 (from the official cost–benefit guidelines for transport in Sweden, ASEK 6; Swedish Transport Administration, 2016). In an optimum, this should correspond either to the marginal welfare cost of raising one further unit of tax revenue or to the marginal value of using one further unit of public funds in sectors other than transport (e.g., health care). However, we also account for the positive (external) labor market effects of increased accessibility, by multiplying the consumer surplus by a WEB factor of 1.12 in the welfare calculations.
The BUPOV model represents three types of origin–destination (OD) pairs: within the inner zone (“inner”), between zones in any direction (“inter”), and within the outer zone (“outer”). Each type of OD pair constitutes a separate (isolated) demand system, but they are interlinked through sharing space, both inside the PT vehicles and on the streets, meaning that the handling of bus crowding and street congestion is at the core of the model. The demand for a travel alternative (i.e., mode m and time period t for a trip for an OD pair) is modelled through a change from the demand in a reference situation as:
∆𝐷𝑚,𝑡,𝑂𝐷= ∆𝐷𝑚,𝑡,𝑂𝐷(𝑓, 𝐹, 𝑜, 𝛿|𝜀) (5) where 𝑓 is frequency, 𝐹 is fare,6 𝑜 is the PT occupancy level, 𝛿 is traffic delay (for buses and cars), and 𝜀 is a matrix of elasticities. The total demand for travel is assumed to be constant in terms of the number of origins and destinations, and route choices within each mode are not assumed to be affected on an aggregate level by the variables in eq. (1).7 However, the mode and time choices for each trip are flexible. This implies that when the demand decreases for a mode in a
6 The monetary cost of the car alternative (comprising parking fees and distance-based costs) does not change.
7 The network and routing are not handled in the model, which is based on mean travel lengths and travel times for each mode and OD pair, based on the results of a separate routing model.
8
given time period, these trips are allocated among the other time periods and modes proportionally to the initial demand for each other mode and time period, and vice versa for demand increases.
Adjustment to a new demand equilibrium due to a change in a policy variable (e.g., frequency) is done by successive iterations of demand calculations for consumer travel choices, congestion, and in-vehicle crowding in buses. In the baseline case, demand is assumed to be in a steady state, but if policy regarding frequency or fare is reformed, a new steady state is approached through iteration. The levels of congestion and crowding affect the generalized cost of each travel alternative, which means that some travelers adjust their travel choices when these are changed, meaning that congestion and crowding will again be updated. This iteration process will continue until the model reaches a new steady state. In this paper, BUPOV is extended by representing two income groups instead of one, so that eq. (5) is replaced with:
∆𝐷𝑦,𝑚,𝑡,𝑂𝐷= ∆𝐷𝑦,𝑚,𝑡,𝑂𝐷(𝑓, 𝐹, 𝑜, 𝛿|𝜀) (6) where y denotes income group.
Residential location is likely to be important for income distribution (Bureau & Glachant, 2011, p. 751). However, BUPOV does not use residential location data or otherwise account for residential location, nor does it take into account differences in trip timing across income groups.
For a thorough description of the BUPOV model, see Asplund and Pyddoke (2019); Appendix A of this study formally presents extensions of the model.
4 SCENARIOS AND DISTRIBUTIONAL WEIGHTS
There are two types of scenarios in the present study: the baseline, i.e., the supply and ticket pricing levels in Uppsala in 2014, and the welfare optimum, i.e., using different distributional weights but otherwise the same set of model assumptions. For the welfare optima there are two levels of income distribution resolution: one that represents individuals homogeneously and values welfare increases equally for all individuals (as in Asplund & Pyddoke, 2019), and one with two income groups (i.e., low income and other). For the resolution level with two income groups, there are three different distributional weighting principles, resulting in three respective sets of distributional weights, meaning that there will be three distinct welfare optima. In the last three examples, the prices are optimized for each group but equal within each group.
The individuals’ willingness to pay and consequently responses are assumed to be constant in each group and across the social valuation of the group, implying that individual choices in a group do not change with social valuation per se, but only through changes in the resulting optimal fares and frequencies. The willingness to pay for reduced travel time is assumed to increase with income,
9
based on eq. (3) in Börjesson, Fosgerau, and Algers (2012).8 Price elasticities are assumed to be equal for both income groups, based on the conclusions of Miller and Savage (2017), but this assumption is subject to sensitivity analysis (see Appendix C). Differences in mode shares across income groups are also represented in the analyses.
We attempt to categorize each weighting principle as regressive, neutral, or progressive compared with the general tax system in Sweden today. On an international standard, Sweden has a progressive redistribution system (see, e.g., Aaberge, Langørgen, & Lindgren, 2010; Bastani & Lundberg, 2017), with high levels of taxes and redistribution (both non-income-related redistribution, e.g., child support, and support to low-income individuals), which makes it reasonable to assume that today in Sweden, the individuals with the lowest incomes receive more social benefits than they pay in taxes. This assumption makes it possible to deduce a revealed social preference for redistribution to this group. As we will show in Table 7, the analyzed changes in PT constitute at most 1% of total income for each income group and can thus be characterized as marginal. The current revealed social weight on the low-income group equals the marginal cost of redistribution to this group, which may be approximated by the MCPF. Hence, we will use the MCPF as the weight on income for low-income individuals as a basis of neutrality.
The following weighting principles are examined, in order of the increasing relative weighting of low-income individuals:
i. Unit weight—all individuals have the same weight. This principle could be categorized as regressive relative to the social preferences expressed through the current redistribution policies in the general tax system. This principle leads to a solution that is Pareto efficient within the analyzed transport system but may not be Pareto efficient within the larger economic system (since other weights are used there).
ii. Shadow cost—In line with Harberger (1978) and Layard (1980), the idea is to impose a shadow price of redistribution. We simply assume that the low-income group comprises net social benefit takers, and that the marginal cost of redistribution to this group through the general tax system equals the MCPF, which therefore constitutes a feasible shadow price for a partial equilibrium model (e.g., BUPOV). This approach could be seen as neutral relative to current distributional policies and is therefore in principle Pareto efficient within both the analyzed transport system and the larger economic system. However, this simple approach only accounts for the deadweight loss from increased taxation, not the effect of increased endowment to the recipients. Microeconomic theory of labor supply predicts that increased endowment to an individual will decrease her labor supply, and empirical estimates (Evers, De Mooij, & Van Vuuren, 2008) suggest that elasticities on the extensive margin (i.e., of the propensity to take a job) are greater than on the intensive margin
8 With 𝛽
10
(i.e., of the propensity to increase the number of hours worked).9 As indicated in Table 3, many low-income individuals are in fact children and young adults. Since Uppsala has a university, many of the young adults are students, so their labor supply is restricted by the availability of time; notably, 51% of the bus users are students and schoolchildren and only 6% are unemployed.
iii. Marginal utility—uses the estimated marginal utility of consumption at different income levels as distributional weights.10 This could possibly seem like a reasonable approach given the objective of maximizing aggregate utility. However, this approach is unsuitable for a partial equilibrium analysis since it does not recognize the possibility of less costly redistribution through the general tax system.11 This principle is Pareto efficient within the analyzed transportation system but not within the larger economic system, unless the marginal utility weights are no more accentuated than are weights based on the cost of redistribution. The empirical weights for these three principles are summarized in Table 6 in section 6, “Results.”
5 DATA
Uppsala lies 70 kilometers north of Stockholm and has one of Sweden’s oldest universities. In 2010, it had 155,000 inhabitants and an urban area of 51 square kilometers. Table 1 reports the mode shares for Uppsala.
9 In this respect, the shadow cost approach may provide a reasonable lower bound on the total cost of redistribution.
10 Using the formula (𝑐𝑦
𝑐) −𝜂
, where 𝑐𝑦 is the median income of each income group (assumed to equal
consumption), 𝑐 is the median income of the total sample (i.e., travelers in Uppsala), and 𝜂 is the elasticity of the marginal utility of consumption. The Stern review (2006) and HM Treasury’s (2011) Green Book use the unit value as their central estimate of EMUC. However, recent empirical literature suggests somewhat higher values; see, for example, a review in the introduction to Evans (2005) and a lower bound of EMUC close to 1 in Asplund (2017), as well as the mean results of these two studies. Groom and Maddison (2018) thoroughly analyzed EMUC for the UK, using both
revealed- and stated-preference studies, comparing the results of various methods and empirically testing underlying assumptions, resulting in a central estimate of 1.5, with a tight 95% confidence interval of 1.4–1.6. In this study, we will use the estimated value of 1.5 for two reasons: first, Groom and Maddison’s (2018) study is rigorous and relevant; second, since the estimate is fairly high, it will result in larger differences in weights across methods, so that more of the uncertainty space will be examined.
11 An assumption that might justify such a utility-based principle would be that the democratic system is incapable of adequately accounting for the population’s true preferences for
redistribution. However, such an assumption could be hard to defend when policies are made in practice. Even if this assumption were accepted, the large weights implied would have considerable implications for secondary markets such as the labor market, which is why a general equilibrium model is preferable for analyzing the effects.
11
Table 1
Mode shares in Uppsala, percent.
RVU12
2010* 2015* RVU Present study**
Car 42 37 38
Bus 12 13 16
WB 44 47 45
Other 3 2 0
* Source: Travel Survey Uppsala (Uppsala Municipality, 2016)** Refers to a weekday average (differs between peak and off-peak hours), including trips with origins or destinations outside of Uppsala.
The 2005–2006 national travel survey (SIKA, 2007) contained 2394 responses from Uppsala. The national travel survey is the sole source for studying the covariation of mode choice, age, and household income per household member in Uppsala for the desired period. Of the respondents from Uppsala, 343 stated that they made bus trips; of these, 198 respondents stated their income, and of these, in turn, 45% (or 89 respondents) had low incomes, i.e., an individual annual income per household member of less than SEK 142,332 (EUR 14,233) per year, which is less than EUR 1200 per month.13 Table 2 presents the distribution of trips per mode and income class, based on SIKA (2007). Fig. 1 shows the income distribution among PT users.
Table 2
Distribution of trips per mode and income class in Uppsala, 2005–2006. Income is annual income per household member in EUR (SEK 10 ≈ EUR 1).
Income class income Min income Max Car Bus WB Total
Missing 8% 7% 9% 24% Low 0 14,233 8% 4% 15% 27% Medium low 14,233 24,284 15% 4% 10% 28% Medium high 24,284 34,675 6% 1% 6% 14% High 34,675 3% 0% 4% 7% Total 41% 16% 44% 100%
12 RVU = Resvaneundersökning = Travel habit survey.
13 The response rate was dramatically lower in 2014, rendering conclusions on the relationship between mode choice and income uncertain. The reader may therefore think of the results of the analysis of the relationship between mode choice and income as preliminary.
12
Fig. 1. Distribution of income among PT users.
We also studied the age distribution of bus users in Uppsala. In the survey, 343 stated their age. The PT users were predominantly young (54% under 24 years old), only 9% being above the age of 64 years. Of the bus users, 34%14 were 18 years old or under, while a further 21% were 19–24 years old.15
Table 3
Distribution of income versus age among PT users.
Age, years ≤18 19–24 25–44 45–64 ≥65
Low income 43% 64% 27% 19% 9%
Other 57% 36% 73% 81% 91%
Total 100% 100% 100% 100% 100%
Table 3 shows the income distribution for each age group of PT users in Uppsala (2005–2006). One can see that the low-income share of children is almost exactly the same as the low-income share of the whole PT user sample. The highest share low-income earners, about two thirds, can be found in the age group 19-24, of which a large proportion are students. The general pattern is that income increases with age in adults.
The fare structure is complex in Uppsala, as it is in most regions. The most important concessions are for monthly passes and for children, students, benefit receivers, and retirees, and for buying multiple tickets. Table 4 shows the monthly pass prices in 2020; these prices have not been used directly in the
14 The fact that 35% of public transport users in Uppsala are under 18 years old also implies that most of these have no or very low individual income but depend largely on their parents for their expenditures.
15 In Uppsala’s travel survey from 2015, the corresponding numbers are somewhat lower: 33% for ages 12–18 years and 15% for ages 18–24 years.
13
present study, since our analysis year is 2014 and since the model uses the average paid price (across all types of tickets) per trip rather than the monthly pass price. However, these data have been used to roughly estimate the discount obtained by the income group. Although the relationship between the low-income group and those eligible for discounts is obviously not one to one, this assumption has nonetheless been adopted for simplicity, using the price multipliers calculated in Table 4.
Table 4
Monthly PT pass prices in Uppsala (as of 6 February 2020).
price (EUR) Monthly multiplier Price
Discounted* 59 0.77
Others 91 1.19
Average 77
Source: https://www.ul.se/en/tickets/travel-card * For children, students, benefit receivers, and retirees.
A further consideration is that the data do not allow the precise representation of concessionary school trips, as these likely constitute roughly a third of PT trips in peak hours.16 One implication is that demand for these trips is unlikely to be influenced by general fare changes. However, since we have estimated the mean price paid including these trips, we may have underestimated the price and therefore the response to proportional price decreases among other individuals. Miller and Savage (2017) studied rider responses at different stations to fare increases in terms of ridership on Chicago's mass-transit rail system. Their analysis concerned how changes in ridership varied with per capita income in the areas surrounding the stations in response to four different fare increases. The results are mixed. For one of the four fare increases, the decrease in ridership was larger at stations in low-income neighborhoods than at stations in higher-income neighborhoods. For another fare increase, however, the decrease in ridership was smaller at stations in low-income neighborhoods than at stations in high-income neighborhoods. This suggests that the responses of low-high-income groups can be both smaller and larger than those of higher-income groups. Because of this, in the present study we use the same price elasticity (as in Asplund & Pyddoke, 2019) for both income groups as a basis for calculating two different generalized cost elasticities. The individual valuation of travel time is assumed to increase with income, based on eq. (3) and Table 4 from Börjesson et al. (2012).17 The parameter values resulting from these calculations are presented in Table 5.
16 This was calculated using data on the number of school cards in Uppsala times the average number of trips made using school cards per workday estimated by the RPTA, and assuming that all these trips occurred during peak hours.
17 In the main analysis, 𝛽
𝐼= 0.31 and 𝛽𝐼50= 2.38, based on the second column (for 2007) in Table 4
14
Table 5
Baseline value of time (VoT) and generalized cost elasticities for the low-income and other groups, respectively.
Income group Income* (EUR /year) Pop. share** 𝜗𝑦***
VoT factor GC elasticity, PT GC elasticity, car Börje-sson Norma -lized Peak Off peak Peak Off peak Low-income 7117 36% 0.31 0.78 0.55 –0.84 –1.58 –0.69 –1.12 Other 19,992 64% 2.38 1.79 1.25 –1.09 –2.06 –0.74 –1.04 Total 15,664 100% 1.43 1
* For the Low-income group, half the income interval for the low-income group (since the median is unavailable); median income for Other and Total.
** Share of all respondents who answered income question in Uppsala, 2005–2006 (SIKA, 2007). *** 𝜗𝑦 is a parameter indicating how the individual value of time varies with income.Based on
Table 4 (2007 column) in Börjesson et al. (2012); see Appendix A.
In the sensitivity analysis (Appendix C), we test the effects of alternative specifications of the parameters in Table 5.
6 RESULTS
In this section, we examine the implications of three different sets of distributional weights for optimal PT policy. Table 6 shows the distributional weights as well as the supply and price levels in the welfare optimum for each set, based on equal price elasticities (and therefore lower generalized cost elasticities for those with low incomes). Appendix C presents a sensitivity analysis of price elasticity and the elasticity of VoT with respect to income.
15
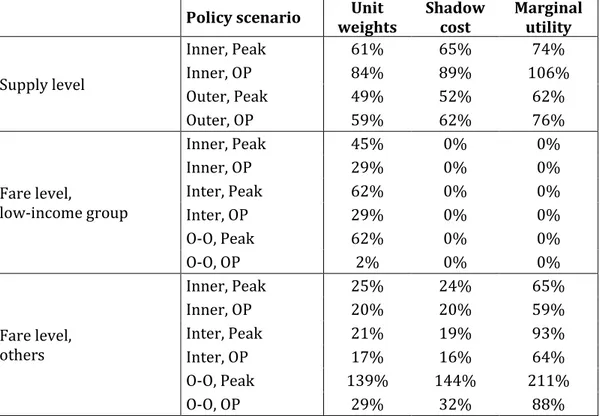
Table 6
Policy parameter values in the welfare optimum given different sets of distributional weights (as percent of baseline).
Distributional scenario One income group Unit
weights Shadow cost Marginal utility
Distributional weight, 𝛽𝑦
Low-income individuals 1.00 1.30 3.27**
Others 1.00 1.00 0.69**
Supply level per zone and time period
Inner, Peak 72% 61% 64% 69%
Inner, Off peak 86% 82% 86% 97%
Outer, Peak 48% 49% 51% 58%
Outer, Off peak 54% 57% 60% 69%
Fare level, low-income group per OD pair* and time period Inner, Peak 35% 47% 0% 0%
Inner, Off peak 25% 30% 0% 0%
Inter, Peak 56% 62% 0% 0%
Inter, Off peak 34% 30% 0% 0%
O-O, Peak 56% 62% 0% 0%
O-O, Off peak 34% 4% 0% 0%
Fare level, others per OD pair* and time period
Inner, Peak 35% 24% 23% 66%
Inner, Off peak 25% 19% 19% 58%
Inter, Peak 56% 19% 18% 96%
Inter, Off peak 34% 15% 15% 64%
O-O, Peak 56% 139% 143% 199%
O-O, Off peak 34% 28% 30% 75%
* Inner denotes trips within the inner zone, Inter trips between zones, and O-O trips from outer zone to outer zone.
** These estimates are similar in magnitude to the implicit weights estimated from general redistribution policies in Sweden, 1970–2015, by Bastani and Lundberg (2017, Fig. 4).
The column One income group presents the welfare optimum with a homogenous representation and social valuation of consumers with respect to income (as in Asplund & Pyddoke, 2019). The other three columns present cases with two income groups, using successively higher relative weightings of low-income individuals. In these three analyses, the individual valuations and responses are assumed to be the same, but the distributional weights differ across columns (with generally increasing progressiveness towards the right). The percentages refer to the baseline scenario fares, frequencies, and demand in 2014. The welfare-optimal scenario entails lower frequencies and lower fares than in the baseline. This optimal policy is largely justified by the cost savings possible in the baseline by reducing supply and increasing capacity utilization.
Let us first consider the optimal supply. The column Unit weights presents the effects of modelling low-income individuals and all other individuals separately, but using the same distributional weights. For this set of weights, the supply is slightly smaller in two of four cases, due to a lower valuation of travel time (including waiting time) in the low-income group. The column Shadow cost presents the effects of assigning the welfare changes of low-income individuals a weight of 1.3. Supply is slightly lower in the inner zone but slightly higher in the
16
outer zone than in the One income group case, and fares are significantly lower (i.e., free or almost free with one notable exception), adapting the PT services more to the preferences of the low-income group. The last scenario, Marginal
utility, presents the effects of weighting the welfare changes by their nominal
marginal utilities of income by 3.27 for low-income individuals. This leads to somewhat higher supply levels than in the reference (i.e., one group) scenario in three of four cases, but still considerably lower levels than in Uppsala in 2016. Throughout the analyses, optimal frequencies increase with increased progressiveness in weights, although these changes can be categorized as modest.
Let us now turn to optimal fares. One result stands out, namely, the increase in fares in peak hours for the group with higher incomes making trips in the outer zone only. The reason is the following: for trips in the outer zone, the time cost is much larger than the fare for this group, due a lower level of service18 than in the inner zone in combination with a high value of time for this group. This means that the effective price elasticity is lower. Moreover, the elasticity is considerably lower in peak than off-peak hours. Overall, this means that the price elasticity for this specific trip type is estimated to be much lower than for other PT trips. In addition, there are almost no net external effects from car trips for trips in the outer zone, so it does not constitute a problem if this demand is shifted towards car use.
Otherwise, optimal fare levels are as follows: for individuals with a distributional weight of 1, there are only minor changes compared with a case with only one income group; however, increasing the distributional weight on the low-income group to 1.3 is enough to justify free fares for this group.
Table 7 shows the effects of the different distributional weights on the consumer surplus for each income group (using unit weights). In all cases, joint optimization of supply and fares is more in favor of the low-income group than others, in both absolute and relative terms, and even when regressive weights are used for the optimization.
18 This includes longer walking distances to stops, a greater need to change lines, and, in the optimum, lower service frequencies.
17
Table 7
Consumer surplus for each income group (with unit weights on willingness to pay, i.e., without increased distributional weights for low income) for the different optimization principles. Figures are in EUR per weekday relative to the 2014 baseline (“+” means benefit, “–” means loss).
Benefits Income weights Unit Shadow cost Marginal utility
Monetary Low +12,791 +22,289 +22,685 Other +28,056 +28,026 +7,080 Time Low –6,619 –5,901 –3,884 Other –16,244 –13,931 –9,344 Total Low +5,892 +15,786 +18,405 Other +13,241 +15,735 –1,179 Share of income* Low +0.3% +0.8% +0.9% Other +0.1% +0.2% +0.0%
* Share of median income for each income group. Based on the assumption of 250 weekdays per year (from Börjesson et al., 2017) and 1.8 trips per person and weekday (based on UL, 2015).
Table 8 shows the effects of the different distributional weights on trip distribution across income groups and modes. Ridership increases in all scenarios. In line with Table 6, one can also see that increased progressivity in weights generally lead to relatively more PT trips in the low-income than the other group. Interestingly, total ridership increases the most in the middle scenario (Shadow cost), and total ridership increases almost as much in the Unit
weight scenario as in the Marginal utility scenario.
Table 8
Demand effects per income group of different sets of optimization weights (i.e., distributional weights). Number of trips; changes in percent.
Mode Base Distributional scenario
One income
group
Unit
weights Shadow cost Marginal utility
Low income Car 30,023 –3% –6% –8% PT 22,888 +12% +25% +29% WB 62,397 –3% –6% –7% Other Car 90,750 –2% –2% 0% PT 28,032 +12% +14% 0% WB 80,170 –2% –3% 0% Total Car 120,773 –1% –2% –3% –2% PT 50,920 +6% +12% +19% +13% WB 142,567 –1% –3% –4% –3%
18
Fearnley (2013) summarized experiences of free-fare policies across developed countries. The reported increases in ridership varied greatly from about 20% to 1000%, so our estimates in this respect are at the lower end of the distribution. However, Fearnley noted that the introduction of free-fare schemes was often accompanied by other policies to promote PT, such as increases in supply and restrictions on car users, so it was not straightforward to separate the effects of each policy. In our case, the free-fare policy is combined with a reduction in supply. It is useful to bear in mind that the data on elasticities in the model are from marginal changes, so the effects of drastic changes may be larger.
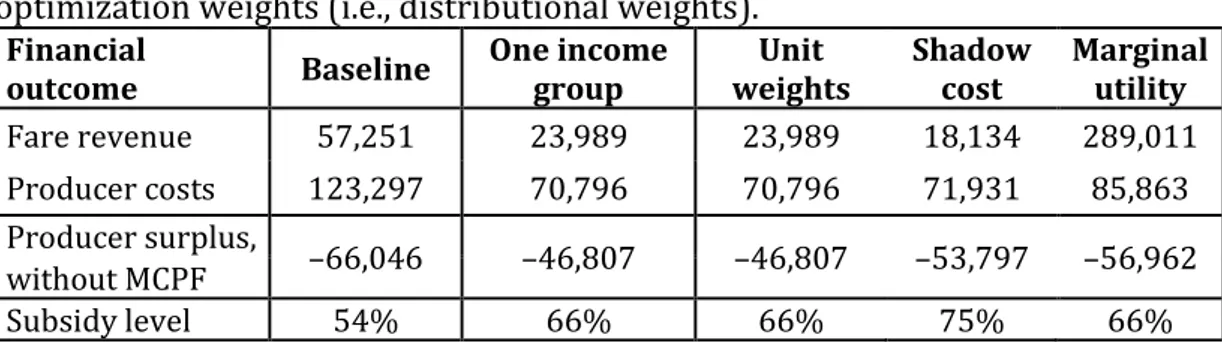
Table 9 shows the effects on financial outcomes for the regional PT authority (RPTA). There is a negative relationship between the increase in the distributional weight on low-income individuals, on one hand, and the producer surplus, on the other. With marginal utility weighting, the RPTA runs a larger deficit than in the current situation. In all scenarios, optimization leads to a reduction in this deficit due to lower costs, but an increase in the subsidy level due to lower revenues.
Table 9
Financial outcomes for RPTA in EUR per weekday for different sets of optimization weights (i.e., distributional weights).
Financial
outcome Baseline One income group weights Unit Shadow cost Marginal utility
Fare revenue 57,251 23,989 23,989 18,134 289,011 Producer costs 123,297 70,796 70,796 71,931 85,863 Producer surplus, –66,046 –46,807 –46,807 –53,797 –56,962 without MCPF Subsidy level 54% 66% 66% 75% 66%
Now, consider the following possibility: What if the “wrong” social weights are chosen? How much will social welfare decrease? In Table 10 we evaluate an optimum using other distributional weights than those used to generate the optimum (let these be called evaluation weights) to answer that question.
In Table 10, the optima resulting from each distributional set are evaluated with all sets of distributional weights (represented by the net social welfare relative to the baseline welfare). The diagonal, boldface elements therefore represent the case in which the optimum is evaluated using the same weight that generated it (and is therefore the maximum value for each row). Now consider the first row. This represents the valuation of all optima, evaluating them using the unit weights. This shows that for a political decision maker with unit weight preferences, the differences are quite small between the optima. The main conclusion is that if one is the political decision maker, even if PT is optimized according to preferences other than one’s own, the new “optimum” is strongly preferable to the status quo. This is in line with the conclusion of Asplund and Pyddoke (2019) that supply optimization is the most important optimization from an aggregate welfare perspective, and that fare optimization is less important.
19
Table 10
Net social benefits (EUR/weekday) relative to baseline given different sets of optimization and evaluation weights, respectively.
(EUR/weekday) Optimization weights
Unit weights Shadow cost Marginal utility Evaluation weights
Unit weights +38,387 +37,512 +31,860
Shadow cost +40,155 +42,248 +37,381
Marginal utility +47,677 +68,452 +73,916
7 DISCUSSION AND CONCLUSION
Asplund and Pyddoke’s (2019) analysis suggested that reducing fares and service frequencies is beneficial from an efficiency perspective, generating considerable revenue for the regional PT authority.19 An obvious objection to this recommendation was that no distributional analysis of income was carried out. For this reason, this paper analyzes the effects of introducing different distributional weights on the welfare optimum. Even with the most radical distributional weights, we find that it is optimal to reduce frequencies in a city with a large share of low-income individuals, including students and other groups among PT users. It is even the case that the optimization of supply and fares is altogether more favorable to low-income individuals than to other income groups (since low-income individuals appreciate lower fares more than improved service). Current PT policy in Uppsala appears to be designed to attract high-income users with a high value of time, rather than for the current users, i.e., individuals with relatively low incomes.
Even so, a central result is that increased distributional weights on the low-income group lead to higher optimal supply levels and lower optimal fares. In all cases, however, these weights lead to lower supply levels than in the baseline but higher supply levels than in the welfare optimum with equal weights for all individuals. However, these increases are relatively modest. A more pronounced result is that putting a weight as low as 1.3 on the low-income group is enough to justify free fares for this group.20
The present results therefore support the common notion that spending public funds on PT has progressive distributional effects given a city with a high share of low-income PT users. However, the study also indicates that general increases in bus frequencies in Uppsala cannot be justified from the perspectives of either pure economic efficiency or concern for low-income individuals.
19 Remember that the results depend on the distribution of income and on how trips are distributed among modes in each income group in Uppsala. To the extent that the social pattern represented in our data is found in other cities, the results have general value; this is not the case if social patterns differ substantially.
20 Asplund and Pyddoke (2019) showed that this result also appears in a one-income-group model, if the MCPF = 1.
20
The results further suggest that somewhat lower PT fares are a rather cheap means of redistribution to low-income households21 (perhaps contrary to many economists’ intuition). On the other hand, the results also suggest that large increases in supply are a costly means of redistribution (perhaps contrary to many PT enthusiasts’ intuition). The present study adopted a simple shadow cost of redistribution approach to represent the cost of alternative means of redistribution.22 The analysis suggests that free PT may be a cost-effective means of redistribution in Uppsala.
A possible means to realize this reform is by granting free PT to children, students, low-wage workers with children, low-income retirees, and individuals disabled from work, since they constitute a considerable share of the low-income bus users in Uppsala (children and students alone constitute 50%) and their labor supply will not be very adversely affected. Granting free PT to underemployed adults may negatively affect their labor supply, so this may be problematic. In addition, our data indicate that retirees in Uppsala have relatively high incomes, so free PT for them as a group is hard to justify in light of the current analysis.
Even if lower PT fares are a cost-efficient means of redistribution and enhance overall welfare, it is important to remember that in the low-income group there will be both winners and losers. From an equity perspective, it may seem problematic to favor low-income PT users while not giving similar benefits to low-income walkers and cyclists. A possible solution to this dilemma could be to drastically reduce the price of single tickets to a similar level per ride as provided by monthly passes, to promote a more even distribution of PT use among each income group.
An important qualification to the generality of the above results can be made. According to the data used, there is considerable spare transit capacity in Uppsala that could be utilized by low-income individuals at low cost. This may hold in general for small cities, but hardly during peak hours in large cities. It is therefore less likely that free fares for low-income individuals will be optimal in larger cities.
ACKNOWLEDGEMENTS
We thank Chengxi Liu for compiling some of the data and Prof. Stef Proost, Prof. Jonas Eliasson, Prof. Maria Börjesson, and Ph.D. Gunnel Bångman for their valuable comments. We thank TRENoP, a strategic research initiative from the Swedish government, and Vinnova, Sweden’s innovation agency, for funding.
21 Through the self-selection mechanism, PT fare subsidies may marginally reduce the overall costs of redistribution.
22 As discussed in the introduction, another possible means of redistribution could be to provide free public transportation to low-income individuals only, though such a policy would be more or less equivalent to an endowment.
21
REFERENCES
Aaberge, R., Langørgen, A. and Lindgren, P. (2010). “The impact of basic public services on the distribution of income in European countries”, pp. 331-344, in Atkinson, A.B. and Marlier, E. (2010) Income and living conditions
in Europe, Eurostat Statistical Books.
Aasness, J., Røed Larsen, E., 2003. “Distributional effects of environmental taxes on transportation”, Journal of Consumer Policy, vol. 26 (3), pp. 279–300. Alt, F. (1936). “Über die Messbarkeit des Nutzens”, Zeitschrift für
Nationalökonomie 7, 161–169. Translated into English by Schach, S.
(1971): “On the measurability of utility”. In: Chipman, J.S., Hurwicz, L., Richter, M.K., Sonnenschein, H.F. (eds.) Preferences, utility, and demand, ch. 20. New York: Hartcourt Brace Jovanovich.
Asplund, D., Pyddoke, R. (2019). “Optimal fares and frequencies for bus services in a small city”, Research in Transportation Economics, ISSN 0739-8859, https://doi.org/10.1016/j.retrec.2019.100796.
Asplund, D. (2017). “Household Production and the Elasticity of Marginal Utility of Consumption”, The B.E. Journal of Economic Analysis & Policy, vol. 17(4), doi:10.1515/bejeap-2016-0265
Balcombe, R. (editor), R. Mackett, N. Paulley, J. Preston, J. Shires, H. Titheridge, M. (2004). “Demand for public transport”, TRL Report 593
Bastani, S. and Lundberg, J. (2017). “Political preferences for redistribution in Sweden”, Journal Economic Inequality 15, pp. 345–367
Bento, A. M., Goulder, L. H., Jacobsen, M. R., von Haefen, R. H., 2009. “Distributional and efficiency impacts of increased U.S. gasoline taxes”, American
Economic Review, vol. 99(3), pp. 667–699.
Berri, A., 2005, Dynamiques de la motorisation et des dépenses de transport des
ménages—Analyses surdonné es individuelles et semi-agrégées, Ph.D.thesis,
Université de Paris1–Panthe´on –Sorbonne.
Blow, L., Crawford, I., 1997. The Distributional Effects of Taxes on Private Motoring, Commentary no. 65. The Institute for Fiscal Studies, London.
Burk, A. (1938). “A Reformulation of Certain Aspects of Welfare Economics”, The Quarterly Journal of Economics, Volume 52, Issue 2, Pages 310–334, https://doi.org/10.2307/1881737
Börjesson, M. , Eliasson, J., Rubensson, I. (2018). Distributional Effects of Public
Transport Subsidies, Working papers in Transport Economics, No 2018:17,
CTS - Centre for Transport Studies Stockholm, https://swopec.hhs.se/ctswps/abs/ctswps2018_017.htm
22
Börjesson, M., Fosgerau, M., Algers, S. (2012) “On the income elasticity of the value of travel time”, Transportation Research Part A, vol. 46, pp. 368–377. Börjesson, M., Fung, C.M., Proost, S. (2017). “Optimal prices and frequencies for
buses in Stockholm”, Economics of Transportation, vol. 9, pp. 20–36. Bureau, B. and Glachant M. (2011). “Distributional effects of public transport
policies in the Paris Region”, Transport Policy, vol. 18, pp. 745–754. Eliasson, J., (2016). “Is congestion pricing fair? Consumer and citizen perspectives
on equity effects”, Transport Policy, vol. 52, pp. 1–15
Eliasson, J., Mattsson, L.G., 2006. “Equity effects of congestion pricing”,
Transportation Research Part A, vol. 40 (7), pp. 602–620.
Evans, D. (2005). “The Elasticity of Marginal Utility of Consumption: Estimates for 20 OECD Countries”, Fiscal Studies, vol. 26 (2), pp. 197–224 0143-5671 Evers, M.; De Mooij, R.; Van Vuuren, D. (2008). “The wage elasticity of labour
supply: a synthesis of empirical estimates”, De Economist, vol. 156 (1), pp. 25–43.
Fearnley, N. (2006). “Public transport subsidies in the UK: evidence of distribu-tional effects”. World Transport Policy & Practice, Vol.12, No. 1, ISSN 1352-7614
Fearnley, N. (2013). ”Free Fares Policies: Impact on Public Transport Mode Share and Other Transport Policy Goals”, International Journal of
Transportation Vol.1, No.1 (2013), pp.75-90,
http://dx.doi.org/10.14257/ijt.2013.1.1.05
Fearnley, N., Aarhaug, J. (2019). ”Subsidising urban and sub-urban transport – distributional impacts”, European Transport Research Review 11:49, https://doi.org/10.1186/s12544-019-0386-0
Fleurbaey, M., Abi-Rafeh, R. (2016). “The Use of Distributional Weights in Benefit–Cost Analysis: Insights from Welfare Economics”, Review of
Environmental Economics and Policy, volume 10, issue 2, pp. 286–307
doi:10.1093/reep/rew003
Groom, B. & Maddison Pr., D. (2018). "New Estimates of the Elasticity of Marginal Utility for the UK", Environ. Resource Econ.,
https://doi.org/10.1007/s10640-018-0242-zHalcrow Fox and Associates and the University of Leeds (1993) London congestion charging: review
and specification of model elasticities, A report commissioned by the
Department of Transport, London.
Harberger, A. C. (1978). “On the Use of Distributional Weights in Social Cost-Benefit Analysis”, Journal of Political Economy, vol. 86, no. 2, pp. 87-120.
23
Kilani, Proost, van der Loo (2014). “Road pricing and public transport pricing reform in Paris: Complements or substitutes?”, Economics of
Transportation, vol. 3, pp. 175-187
Köbberling, V. (2006). "Strength of preference and cardinal utility", Economic
Theory, vol. 27, pp. 375-391
https://link.springer.com/article/10.1007/s00199-005-0598-5
Layard, R. (1980). “On the Use of Distributional Weights in Social Cost-Benefit Analysis”, Journal of Political Economy, vol. 88, no. 2, pp. 1041-1047 Miller, C. and Savage, I. (2017). “Does the demand response to transit fare
increases vary by income?”, Transport Policy, vol. 55, pp. 79–86.
Mohring, H. (1972). “Optimization and scale economics in urban bus transportation”, American Economic Review, vol. 62 (4), pp. 591-604 Poterba, J. M., 1991. “Is the Gasoline Tax Regressive?” In: Bradford, D. (Ed.) Tax
Policy and the Economy 5, pp. 145–164.
SIKA, (2007). RES 2005-2006 - Den nationella resvaneundersökningen, SIKA Statistik 2007:19
Stern, N. (2006). The Economics of Climate Change: The Stern Review. Cambridge, UK, Cambridge University Press. Available at: http://www.hm-treasury.gov.uk/stern_review_report.htm
Swedish Transport Administration, (2016). Analysmetod och samhällsekonomiska kalkylvärden för transportsektorn: ASEK 6.0.
HM Treasury (2011). THE GREEN BOOK - Appraisal and Evaluation in Central Government, Treasury Guidance, LONDON: TSO, Available at:
https://www.gov.uk/government/publications/the-green-book-appraisal-and-evaluation-in-central-governent
UL (2015). Statistisk årsbok 2014 – Kollektivtrafiken i Uppsala län, Landstinget i Uppsala län – Kollektivtrafikförvaltningen UL.
Uppsala municipality (2016). Resvaneundersökning hösten 2015 - En kartläggning
av kommuninvånarnas resmönster hösten 2015.
West, J. and Börjesson M., (2018). “The Gothenburg congestion charges: cost– benefit analysis and distribution effects”, Transportation,
24
APPENDIX A: THE BUPOV MODEL
List of parameters and variables
𝐴𝑧 Area of zone (Inner, outer) CS Consumer surplusCT Congestion costs for trucks 𝐷 No. of trips - Demand
𝑑 Distance (OD, travel distance, route) 𝛿 Delay (percentage)
𝑐 Cost of supply (per km, per hour, per capacity (capital cost), in total) 𝑆𝐶 Seating capacity of each bus
𝐷𝐶 Distance cost of car (inner, outer, fixed)
𝐸 Total net external effect, excluding congestion (PT, car; inner; outer) 𝑒 Net external effect per vehicle km, excluding congestion (PT, car;
inner; outer)
𝜀 Elasticity
𝑓 Fare (PT), Parking fees (car)
𝐹 Frequency
𝐹𝐶 Fixed cost of trip (parking fees, fixed cost of changes of vehicles, walking time)
𝐺𝐶 Generalized consumer cost/trip 𝑜 Occupancy (mean, point; car, PT) 𝑃𝑆 Producer surplus
PR Parking revenue
𝑄 Flows (Person, vehicle per hour; eq. per area and hour) 𝑟 Revenue from fares
𝑆 Supply (departures per hour) 𝑇𝑇𝑃 Length of period (Peak, OP)
𝑡 Travel time (In-vehicle time (IVT), changing time, wait at home) 𝜏 Marginal cost of public funds, MCPF
𝑉𝑜𝑇 Value of time (IVT, changing time, wait at home, trucks, PT-supply)
W Total welfare
𝛾 Level of subsidy (result)
Ѱ Set of restrictions for welfare optima Super- and sub-scripts
Modes (m): car, PT (Public transport), WB (Walking/Bicycle) Zones (z): Inner = I, Outer = O
OD pairs (OD): I-I, I-O, O-O
Locations (L): Center = C, Border inner = BI, Border outer = BO, Terminus = T
Time period (TP): P (peak), OP (off-peak) Model iteration (MI): i
25
Model updates compared to Asplund and Pyddoke (2019)
User optimum:
The per-hour person flows in each mode, zone and time period (in iteration i) is updated from: 𝑄𝑧,𝑚,𝑇𝑃,𝑖𝑝 = ∑𝑂𝐷(𝐷𝑂𝐷,𝑚,𝑇𝑃,𝑖∙𝛾𝑂𝐷𝑧 ∙𝑑𝑂𝐷) 𝑇𝑇𝑃 , to: 𝑄𝑧,𝑚,𝑇𝑃,𝑖𝑝 = ∑ (𝐷𝑂𝐷,𝑚,𝑇𝑃,𝑖∙𝛾𝑂𝐷 𝑧 ∙𝑑 𝑂𝐷) 𝑦,𝑂𝐷 𝑇𝑇𝑃 .
where 𝐷𝑦,𝑂𝐷,𝑚,𝑇𝑃,𝑖 is the number of demanded trips for each travel alternative for each income group y and OD pair (in iteration i) 𝛾𝑂𝐷𝑧 is the mean fraction of each trip per OD-pair that goes through zone z, 𝑑𝑂𝐷 is the travelled mean distance for each OD-pair and 𝑇𝑇𝑃 is the length of each time period.
The generalized consumer cost per car trip in each OD-pair, time period and iteration is updated from:
𝐺𝐶𝑂𝐷,𝑇𝑃,𝑖𝑐𝑎𝑟 = 𝐷𝐶∙𝑑𝑂𝐷+𝑓𝑂𝐷,𝑇𝑃𝑐𝑎𝑟 𝑜𝑐𝑎𝑟 + ∑ (𝑉𝑜𝑇𝑧,𝑇𝑃,𝑖 𝑖𝑣𝑡,𝑐𝑎𝑟∙ 𝑡 𝑂𝐷,𝑧,𝑐𝑎𝑟,𝑇𝑃,𝑖𝑖𝑣𝑡 ) 𝑧 , to: 𝐺𝐶𝑦,𝑂𝐷,𝑇𝑃,𝑖𝑐𝑎𝑟 =𝐷𝐶 ∙ 𝑑𝑂𝐷+ 𝑓𝑂𝐷,𝑇𝑃 𝑐𝑎𝑟 𝑜𝑐𝑎𝑟 + ∑(𝑉𝑜𝑇𝑧,𝑇𝑃,𝑖𝑖𝑣𝑡,𝑐𝑎𝑟∙ 𝜗𝑦∙ 𝑡𝑂𝐷,𝑧,𝑐𝑎𝑟,𝑇𝑃,𝑖𝑖𝑣𝑡 ) 𝑧
where 𝐷𝐶 is the distance cost per car (including capital, fuel and wear and tear), 𝑑𝑂𝐷is the mean distance travel per OD-pair, 𝑓𝑂𝐷,𝑇𝑃𝑐𝑎𝑟 is the mean parking fare per car payed, per OD-pair and time period, 𝑉𝑜𝑇𝑧,𝑇𝑃,𝑖𝑖𝑣𝑡,𝑐𝑎𝑟 is the value of in-vehicle travel time per zone, time period and iteration, excluding distributional regards (from Asplund and Pyddoke, 2019), 𝜗𝑦 is a parameter indicating how the individual value of time varies with income group and 𝑡𝑧,𝑐𝑎𝑟,𝑇𝑃,𝑖𝑖𝑣𝑡 is the in-vehicle travel time for car per zone .
𝜗𝑦 = ( 𝑀𝑒𝑑𝑖𝑎𝑛_𝑖𝑛𝑐𝑜𝑚𝑒𝑦 𝑀𝑒𝑑𝑖𝑎𝑛_𝑖𝑛𝑐𝑜𝑚𝑒𝑠𝑎𝑚𝑝𝑙𝑒)
𝜕𝑦
based on eq. (3) in Börjesson et. al (2012), where 𝜕𝑦 is 𝛽_𝐼 in Börjesson et al. for the low-income group, and 𝛽_𝐼50 for the other income group. However, in
26
practice there also need to be an adjustment, because available values on aggregate VoT is based on (national) mean values, rather than median income.23 The generalized consumer cost per PT trip in each zone, time period, and iteration is updated from:
𝐺𝐶𝑂𝐷,𝑇𝑃,𝑖𝑃𝑇 = 𝑓𝑂𝐷,𝑇𝑃𝑃𝑇 + ∑ (𝑉𝑜𝑇𝑇𝑃𝑘,𝑃𝑇∙ 𝑡𝑂𝐷,𝑃𝑇,𝑇𝑃𝑘 ) + 𝑘=𝑤𝑎𝑖𝑡,𝑤𝑎𝑙𝑘,𝑐ℎ + ∑ (𝑉𝑜𝑇𝑧 𝑧,𝑇𝑃,𝑖𝑖𝑣𝑡,𝑃𝑇 ∙ 𝑡𝑂𝐷,𝑧,𝑃𝑇,𝑇𝑃,𝑖𝑖𝑣𝑡 ), to: 𝐺𝐶𝑦,𝑂𝐷,𝑇𝑃,𝑖𝑃𝑇 = 𝑓𝑂𝐷,𝑇𝑃𝑃𝑇 + ∑ (𝑉𝑜𝑇𝑇𝑃𝑘,𝑃𝑇∙ 𝜗𝑦∙ 𝑡𝑂𝐷,𝑃𝑇,𝑇𝑃𝑘 ) + 𝑘=𝑤𝑎𝑖𝑡,𝑤𝑎𝑙𝑘,𝑐ℎ + ∑ (𝑉𝑜𝑇𝑧 𝑧,𝑇𝑃,𝑖𝑖𝑣𝑡,𝑃𝑇∙ 𝜗𝑦∙ 𝑡𝑂𝐷,𝑧,𝑃𝑇,𝑇𝑃,𝑖𝑖𝑣𝑡 ),
where 𝑤𝑎𝑖𝑡 denotes the (at home) waiting time, 𝑤𝑎𝑙𝑘 walking time connecting to the bus stops, and 𝑐ℎ changing time between bus routes for each trip.
The change in number of trips per mode, OD-pair and time period due to a policy reform is (in iteration i) is updated from:
∆𝐷𝑂𝐷,𝑚,𝑇𝑃,𝑖𝑡𝑜𝑡 = ∆𝐷̃𝑂𝐷,𝑚,𝑇𝑃,𝑖+ ∑ (−∆𝐷̃𝑂𝐷,𝑚̂ ,𝑇𝑃̂ ,𝑖 ∙ 𝜃𝑚𝑂𝐷,𝑚,𝑇𝑃̂ ,𝑇𝑃̂ ) 𝑚̂ ,𝑇𝑃̂
to:
∆𝐷𝑦,𝑂𝐷,𝑚,𝑇𝑃,𝑖𝑡𝑜𝑡 = ∆𝐷̃𝑦,𝑂𝐷,𝑚,𝑇𝑃,𝑖+ ∑𝑚̂ ,𝑇𝑃̂(−∆𝐷̃𝑦,𝑂𝐷,𝑚̂ ,𝑇𝑃̂ ,𝑖∙ 𝜃𝑚𝑦,𝑂𝐷,𝑚,𝑇𝑃̂ ,𝑇𝑃̂ )
Eq. (20), the partial change in demand resulting from changes in own generalized cost of each travel alternative (𝑚, 𝑇𝑃) is updated from:
∆𝐷̃𝑂𝐷,𝑚,𝑇𝑃,𝑖 = ∆𝐺𝐶𝑂𝐷,𝑚,𝑇𝑃,𝑖∙ 𝜀𝑚,𝑇𝑃 to:
∆𝐷̃𝑦,𝑂𝐷,𝑚,𝑇𝑃,𝑖 = ∆𝐺𝐶𝑦,𝑂𝐷,𝑚,𝑇𝑃,𝑖 ∙ 𝜀𝑦,𝑚,𝑇𝑃
where 𝜀𝑦,𝑚,𝑇𝑃 is the own generalized cost elasticity (which is derived from the own price elasticity24).
And the changes in generalized cost are updated from:
23 This is done by first calculating the mean VoT factor by the formula
𝑋 = 𝜗𝑙𝑜𝑤_𝑖𝑛𝑐𝑜𝑚𝑒∙ 𝑃𝑜𝑝𝑢𝑙𝑎𝑡𝑖𝑜𝑛_𝑠ℎ𝑎𝑟𝑒𝑙𝑜𝑤_𝑖𝑛𝑐𝑜𝑚𝑒+ 𝜗𝑜𝑡ℎ𝑒𝑟𝑠∙ 𝑃𝑜𝑝𝑢𝑙𝑎𝑡𝑖𝑜𝑛_𝑠ℎ𝑎𝑟𝑒𝑜𝑡ℎ𝑒𝑟𝑠
Then normalization is performed by: 𝜗̃ = 𝜗𝑦 𝑦∙ 𝑋
24 𝜀 𝑦,𝑚,𝑇𝑃= 𝜀𝑦,𝑚,𝑇𝑃 𝑝𝑟𝑖𝑐𝑒 ∙∑ (𝐺𝐶𝑦,𝑂𝐷,𝑇𝑃,0 𝑃𝑇 ∙𝐷 𝑂𝐷,𝑚,𝑇𝑃,0) 𝑂𝐷 ∑𝑂𝐷(𝑓𝑦,𝑂𝐷,𝑇𝑃𝑃𝑇 ∙𝐷𝑂𝐷,𝑚,𝑇𝑃,0)