Mälardalen University Press Licentiate Theses No. 215
AN ANALYSIS OF THE RELATIONSHIP BETWEEN
THE ENERGY AND BUILDINGS SECTORS IN SWEDEN
Mehmet Börühan Bulut 2015
School of Business, Society and Engineering
Mälardalen University Press Licentiate Theses
No. 215
AN ANALYSIS OF THE RELATIONSHIP BETWEEN
THE ENERGY AND BUILDINGS SECTORS IN SWEDEN
Mehmet Börühan Bulut
2015
Copyright © Mehmet Börühan Bulut, 2015 ISBN 978-91-7485-222-6
ISSN 1651-9256
Printed by Arkitektkopia, Västerås, Sweden
Summary
Climate change is one of the global challenges of our time. The energy sector is at the focus of the European efforts to combat climate change as it accounts for 80% of the total greenhouse gas emissions in the European Union. Build-ings represent approximately 40% of the total energy use and 33% of the total greenhouse gas emissions in the European Union, giving the buildings sector also a key role in the European climate strategy. There are, at the same time, strong interdependencies between the energy and buildings sectors due to the high amount of energy used by buildings and their rising importance as active components in the future energy systems. These interdependencies do not only influence the investment decisions in the energy and buildings sectors, but also the effectiveness of the European climate strategy. Cooperation between the energy and buildings sectors can create beneficial outcomes for the both sectors as well as the environment. It may also encourage innovation, improve the energy performance of buildings, and help achieve a higher penetration of renewable energy into the energy system.
This licentiate thesis investigates the relationship between the energy and buildings sector at the inter-company level. Presenting the data collected from interviews and a web survey answered by the energy and buildings sectors in Sweden, this thesis examines the level of cooperation between these two sec-tors, discusses trust issues between stakeholders, presents the factors that neg-atively impact cooperation, and provides recommendations for the minimisa-tion of these factors.
The findings presented in this thesis indicate an insufficient level of coop-eration between the energy and buildings sectors in Sweden, to which the fol-lowing factors have been identified to contribute in a negative a way: district heating monopolies; energy efficiency in buildings; building regulations; self-generation of electricity; and energy use patterns. The emphasis on self-inter-est by stakeholders within the both sectors appears to have created trust issues between stakeholders. Accordingly, shifting the focus from self-gains to mu-tual gains is deemed necessary to improve the cooperation between the energy and buildings sectors. This, however, requires significant changes in current practices and business models. It has been identified that the development of smart energy systems that allow a closer interaction between the energy and buildings sectors through flexible energy supply and use would minimise many of the factors that negatively impact cooperation.
Sammanfattning
Klimatförändringen är en av de stora globala utmaningar vi står inför. I Europa läggs idag stort fokus på energisektorn, som står för 80 procent av det totala utsläppen av växthusgaser. Byggnader representerar 40 procent av energian-vändningen och 33 procent av växthusutsläppen, vilket också ger byggsektorn en nyckelroll i den europeiska klimatstrategin. Samtidigt finns det starka be-roendeförhållanden mellan energi- och byggsektorn på grund av den höga energianvändningen i byggnader och deras ökade betydelse som en aktiv kom-ponent i det framtida energisystemet. Dessa beroendeförhållanden påverkar inte bara investeringsbeslut i de båda sektorerna, utan även effektiviteten i den europeiska klimatstrategin. Samarbete mellan energi- och byggsektorn kan få positiva effekter för både dem själva såväl som för miljön. Samarbete mellan sektorerna kan även uppmuntra innovation, förbättra energieffektiviteten i byggnader och tillåta en högre användning av förnyelsebar energi i energisy-stemet.
Denna licentiatavhandling utforskar förhållandet mellan energi- och bygg-sektorn på företagsnivå genom att analysera data som samlats in med hjälp av intervjuer och en webbaserad enkät. Intervjuer och enkäter har besvarades av både energi- och byggsektorerna i Sverige. Denna avhandling studerar nivån av samarbete mellan de två sektorerna, diskuterar problem gällande förtroende mellan intressenter, presenterar de identifierade faktorer som försvårar samar-bete och ger rekommendationer för att minimera dessa.
Resultatet visar på en otillräcklig nivå av samarbete mellan energi- och byggsektorerna i Sverige. De faktorer som försvårar samarbetet är följande: fjärrvärmemonopol; energieffektivitet i byggnader; byggregler, egenprodukt-ion av el och användarmönster. Naturligt finns ett egenintresse hos olika in-tressenter inom de båda sektorerna, och detta tycks ha skapat ett förtroende-problem mellan de olika sektorerna Att byta fokus från egen vinning till ge-mensamma mål bedöms vara nödvändigt för att öka samarbetet mellan energi-och byggsektorerna. Detta fodrar dock stora förändringar både i nuvarande verksamhet samt i affärsmodellerna. Det har påvisats att utvecklandet av smarta energisystem som tillåter en större interaktion mellan energi- och byggsektorerna genom flexibel energiförsörjning och användning skulle mi-nimera många av de faktorer som inverkar negativt på samarbetet.
Summary
Climate change is one of the global challenges of our time. The energy sector is at the focus of the European efforts to combat climate change as it accounts for 80% of the total greenhouse gas emissions in the European Union. Build-ings represent approximately 40% of the total energy use and 33% of the total greenhouse gas emissions in the European Union, giving the buildings sector also a key role in the European climate strategy. There are, at the same time, strong interdependencies between the energy and buildings sectors due to the high amount of energy used by buildings and their rising importance as active components in the future energy systems. These interdependencies do not only influence the investment decisions in the energy and buildings sectors, but also the effectiveness of the European climate strategy. Cooperation between the energy and buildings sectors can create beneficial outcomes for the both sectors as well as the environment. It may also encourage innovation, improve the energy performance of buildings, and help achieve a higher penetration of renewable energy into the energy system.
This licentiate thesis investigates the relationship between the energy and buildings sector at the inter-company level. Presenting the data collected from interviews and a web survey answered by the energy and buildings sectors in Sweden, this thesis examines the level of cooperation between these two sec-tors, discusses trust issues between stakeholders, presents the factors that neg-atively impact cooperation, and provides recommendations for the minimisa-tion of these factors.
The findings presented in this thesis indicate an insufficient level of coop-eration between the energy and buildings sectors in Sweden, to which the fol-lowing factors have been identified to contribute in a negative a way: district heating monopolies; energy efficiency in buildings; building regulations; self-generation of electricity; and energy use patterns. The emphasis on self-inter-est by stakeholders within the both sectors appears to have created trust issues between stakeholders. Accordingly, shifting the focus from self-gains to mu-tual gains is deemed necessary to improve the cooperation between the energy and buildings sectors. This, however, requires significant changes in current practices and business models. It has been identified that the development of smart energy systems that allow a closer interaction between the energy and buildings sectors through flexible energy supply and use would minimise many of the factors that negatively impact cooperation.
Sammanfattning
Klimatförändringen är en av de stora globala utmaningar vi står inför. I Europa läggs idag stort fokus på energisektorn, som står för 80 procent av det totala utsläppen av växthusgaser. Byggnader representerar 40 procent av energian-vändningen och 33 procent av växthusutsläppen, vilket också ger byggsektorn en nyckelroll i den europeiska klimatstrategin. Samtidigt finns det starka be-roendeförhållanden mellan energi- och byggsektorn på grund av den höga energianvändningen i byggnader och deras ökade betydelse som en aktiv kom-ponent i det framtida energisystemet. Dessa beroendeförhållanden påverkar inte bara investeringsbeslut i de båda sektorerna, utan även effektiviteten i den europeiska klimatstrategin. Samarbete mellan energi- och byggsektorn kan få positiva effekter för både dem själva såväl som för miljön. Samarbete mellan sektorerna kan även uppmuntra innovation, förbättra energieffektiviteten i byggnader och tillåta en högre användning av förnyelsebar energi i energisy-stemet.
Denna licentiatavhandling utforskar förhållandet mellan energi- och bygg-sektorn på företagsnivå genom att analysera data som samlats in med hjälp av intervjuer och en webbaserad enkät. Intervjuer och enkäter har besvarades av både energi- och byggsektorerna i Sverige. Denna avhandling studerar nivån av samarbete mellan de två sektorerna, diskuterar problem gällande förtroende mellan intressenter, presenterar de identifierade faktorer som försvårar samar-bete och ger rekommendationer för att minimera dessa.
Resultatet visar på en otillräcklig nivå av samarbete mellan energi- och byggsektorerna i Sverige. De faktorer som försvårar samarbetet är följande: fjärrvärmemonopol; energieffektivitet i byggnader; byggregler, egenprodukt-ion av el och användarmönster. Naturligt finns ett egenintresse hos olika in-tressenter inom de båda sektorerna, och detta tycks ha skapat ett förtroende-problem mellan de olika sektorerna Att byta fokus från egen vinning till ge-mensamma mål bedöms vara nödvändigt för att öka samarbetet mellan energi- och byggsektorerna. Detta fodrar dock stora förändringar både i nuvarande verksamhet samt i affärsmodellerna. Det har påvisats att utvecklandet av smarta energisystem som tillåter en större interaktion mellan energi- och byggsektorerna genom flexibel energiförsörjning och användning skulle mi-nimera många av de faktorer som inverkar negativt på samarbetet.
List of Papers
This licentiate thesis is based on the following papers:
I. Bulut, M.B., Wallin, F., Stigson, P., Vassileva, I. “Cooperation for cli-mate-friendly developments - an analysis of the relationship between the energy and buildings sectors in Sweden”. Energy Efficiency. Available online 21 June 2015
II. Bulut, M.B., Odlare, M., Stigson, P., Wallin, F., Vassileva, I. “Buildings in the future energy system – perspectives of the Swedish energy and buildings sectors on current energy challenges”. Energy and Buildings. Available online 15 August 2015.
III. Bulut, M.B., Wallin, F., Karlsson, B., (2013) “The role of buildings in the energy system – intersectoral barriers to future developments”. Presented at the 5th International Conference on Applied Energy, July 2013, Pretoria,
South Africa
List of Papers Not Included
I. Bulut, M.B., Wallin, F., (2014) “Buildings as components of smart grids – perspectives of different stakeholders”. Presented at the 6thInternational
Conference on Applied Energy, May 2014, Taipei, Taiwan (Conference paper published in Energy Procedia)
II. Bulut, M.B., Wallin, F., (2013) “The development of active buildings through renovation – Is it possible?“, Presented at the YRSB13 - iiSBE Forum of Young Researchers in Sustainable Building 2013, June 2013, Prague, Czech Republic
III. Bulut, M.B., Odlare, M., Vassileva I., Stigson, P., Wallin, F., (2015) “Ac-tive building – a definition by the Swedish energy and buildings sectors”. Submitted to Energy and Buildings.
List of Papers
This licentiate thesis is based on the following papers:
I. Bulut, M.B., Wallin, F., Stigson, P., Vassileva, I. “Cooperation for cli-mate-friendly developments - an analysis of the relationship between the energy and buildings sectors in Sweden”. Energy Efficiency. Available online 21 June 2015
II. Bulut, M.B., Odlare, M., Stigson, P., Wallin, F., Vassileva, I. “Buildings in the future energy system – perspectives of the Swedish energy and buildings sectors on current energy challenges”. Energy and Buildings. Available online 15 August 2015.
III. Bulut, M.B., Wallin, F., Karlsson, B., (2013) “The role of buildings in the energy system – intersectoral barriers to future developments”. Presented at the 5thInternational Conference on Applied Energy, July 2013, Pretoria,
South Africa
List of Papers Not Included
I. Bulut, M.B., Wallin, F., (2014) “Buildings as components of smart grids – perspectives of different stakeholders”. Presented at the 6th International
Conference on Applied Energy, May 2014, Taipei, Taiwan (Conference paper published in Energy Procedia)
II. Bulut, M.B., Wallin, F., (2013) “The development of active buildings through renovation – Is it possible?“, Presented at the YRSB13 - iiSBE Forum of Young Researchers in Sustainable Building 2013, June 2013, Prague, Czech Republic
III. Bulut, M.B., Odlare, M., Vassileva I., Stigson, P., Wallin, F., (2015) “Ac-tive building – a definition by the Swedish energy and buildings sectors”. Submitted to Energy and Buildings.
Contents
1. Introduction ... 12
1.1. Background ... 12
1.1.1. Energy and buildings ... 12
1.1.2. Swedish energy sector ... 16
1.1.3. Swedish buildings sector ... 19
1.1.4. Cooperation between stakeholders ... 21
1.2. Motivation and research questions ... 22
1.3. Objectives ... 23 1.4. Thesis contributions ... 23 1.5. Thesis outline ... 24 2. Methodology ... 25 2.1. Research design ... 25 2.2. Data collection ... 26 2.2.1. Interviews ... 26 2.2.2. Survey ... 27
3. Results and discussion ... 30
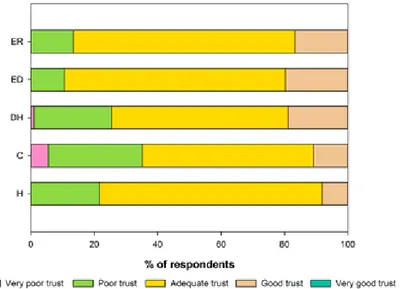
3.1. Inter-sectoral cooperation and trust ... 30
3.2. Factors that negatively impact cooperation ... 33
3.2.1. District heating monopolies ... 33
3.2.2. Energy efficiency in buildings ... 36
3.2.3. Building regulations ... 39
3.2.4. Self-generation of electricity ... 41
3.2.5. Energy use patterns ... 43
4. Conclusions... 47 5. Future works ... 50 References ... 51 Annexes ... 58 Papers ... 63
List of Figures
Figure 1. Heating in Swedish buildings. Data source: (Swedish Energy Agency 2013b) ... 15Figure 2. Price development of electricity between 1996 and 2014. Continuous lines represent the retail prices and dashed lines represent the average distribution prices, both excluding taxes. The retail prices from 2007 and onwards include electricity certificates. Data source: (Statistics Sweden 2013a, 2014, 2015)... 17
Figure 3. Average price development of district heating between 2004 and 2014. Data source: (Swedish District Heating Association 2015) 18 Figure 4. Ownership in the Swedish residential sector. Data source: (Statistics Sweden 2013b) ... 20
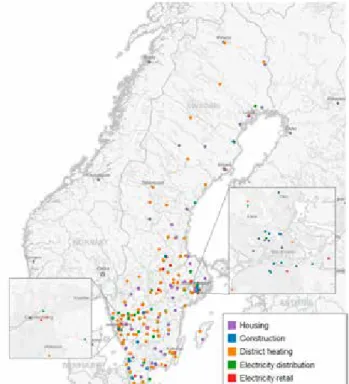
Figure 5. Map of Sweden illustrating the distribution of survey respondents. Figure created on Tableau (Tableau Software Inc., USA) ... 28
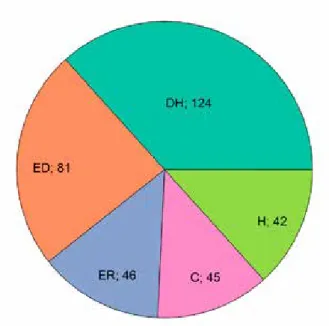
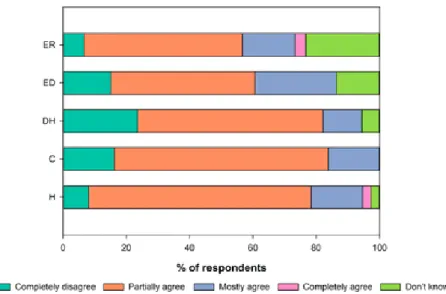
Figure 6. Breakdown of the number of respondents by stakeholder groups. 29 Figure 7. Answers to the statement “There is very good cooperation between the energy and buildings sectors”... 30
Figure 8. Answers to the question “Which of the following describes the relationship between the energy and buildings sectors the best?”. 31 Figure 9. Answers to the question "How do you agree with the following statements? - 'The deregulation of district heating networks would result in higher prices'" ... 35
Figure 10. Answers to the question “How do you think the following trends in the buildings sector would impact the energy sector? - ‘Increased energy efficiency’” ... 36
Figure 11. Answers to the question “How do you agree with the following statements? - ‘A fixed component in the energy tariff has negative impacts on energy efficiency measures’”... 37
Figure 12. Answers to the question “How do you think the following trends in the buildings sector would impact the energy sector? – ‘The use of alternative heating methods to district heating’” ... 40
Contents
1. Introduction ... 12
1.1. Background ... 12
1.1.1. Energy and buildings ... 12
1.1.2. Swedish energy sector ... 16
1.1.3. Swedish buildings sector ... 19
1.1.4. Cooperation between stakeholders ... 21
1.2. Motivation and research questions ... 22
1.3. Objectives... 23 1.4. Thesis contributions ... 23 1.5. Thesis outline ... 24 2. Methodology... 25 2.1. Research design... 25 2.2. Data collection... 26 2.2.1. Interviews ... 26 2.2.2. Survey ... 27
3. Results and discussion ... 30
3.1. Inter-sectoral cooperation and trust ... 30
3.2. Factors that negatively impact cooperation... 33
3.2.1. District heating monopolies... 33
3.2.2. Energy efficiency in buildings... 36
3.2.3. Building regulations... 39
3.2.4. Self-generation of electricity ... 41
3.2.5. Energy use patterns... 43
4. Conclusions... 47 5. Future works ... 50 References... 51 Annexes ... 58 Papers... 63
List of Figures
Figure 1. Heating in Swedish buildings. Data source: (Swedish Energy Agency 2013b) ... 15Figure 2. Price development of electricity between 1996 and 2014. Continuous lines represent the retail prices and dashed lines represent the average distribution prices, both excluding taxes. The retail prices from 2007 and onwards include electricity certificates. Data source: (Statistics Sweden 2013a, 2014, 2015) ... 17
Figure 3. Average price development of district heating between 2004 and 2014. Data source: (Swedish District Heating Association 2015) 18 Figure 4. Ownership in the Swedish residential sector. Data source: (Statistics Sweden 2013b) ... 20
Figure 5. Map of Sweden illustrating the distribution of survey respondents. Figure created on Tableau (Tableau Software Inc., USA) ... 28
Figure 6. Breakdown of the number of respondents by stakeholder groups . 29 Figure 7. Answers to the statement “There is very good cooperation between the energy and buildings sectors” ... 30
Figure 8. Answers to the question “Which of the following describes the relationship between the energy and buildings sectors the best?” . 31 Figure 9. Answers to the question "How do you agree with the following statements? - 'The deregulation of district heating networks would result in higher prices'" ... 35
Figure 10. Answers to the question “How do you think the following trends in the buildings sector would impact the energy sector? - ‘Increased energy efficiency’” ... 36
Figure 11. Answers to the question “How do you agree with the following statements? - ‘A fixed component in the energy tariff has negative impacts on energy efficiency measures’” ... 37
Figure 12. Answers to the question “How do you think the following trends in the buildings sector would impact the energy sector? – ‘The use of alternative heating methods to district heating’” ... 40
Figure 13. Answers to the question “How do you think the following trends in the buildings sector would impact the energy sector? –
‘installation of self-generation systems’” ... 42
Figure 14. Answers to the question “How do you agree with the following statements? - ‘The price of electricity varies too little over the day to create incentives for demand flexibility’” ... 45
List of Tables
Table 1. Answers (in %) to the question "Do you agree with the following statements?” ... 33Table 2. Answers (in %) to the question “How do you think the following trends in the energy sector would impact the buildings sector? - ‘Increased fixed charges in the energy tariff’” ... 38
Table 3. Answers (in %) to the question “How do you think the following trends in the energy sector would impact the buildings sector? - ‘Services for energy efficiency in buildings’” ... 38
Table 4. Answers (in %) to the question “How do you think the following trends in the energy sector would impact the buildings sector? - ‘New energy services, e.g. guaranteed indoor temperature’” ... 39
Table 5. Answers (in %) to the question "Do you agree with the following statements? - 'Self-generation of electricity can create business opportunities for energy companies'" ... 43
Table 6. Answers (in %) to the question “How do you think the following trends in the buildings sector would impact the energy sector? - 'Active and flexible customers' and 'Participation in demand response'”... 43
Table 7. Answers (in %) to the question “How do you think the following trends in the energy sector would impact the buildings sector? - 'Introduction of new pricing methods, e.g. hourly pricing, peak pricing''” ... 46
Table 8. List of respondents that were quoted in the text ... 58
Table 9. List of interview respondents ... 59
Table 10. The interview guide used in this thesis ... 60
Figure 13. Answers to the question “How do you think the following trends in the buildings sector would impact the energy sector? –
‘installation of self-generation systems’”... 42
Figure 14. Answers to the question “How do you agree with the following statements? - ‘The price of electricity varies too little over the day to create incentives for demand flexibility’” ... 45
List of Tables
Table 1. Answers (in %) to the question "Do you agree with the following statements?” ... 33Table 2. Answers (in %) to the question “How do you think the following trends in the energy sector would impact the buildings sector? - ‘Increased fixed charges in the energy tariff’” ... 38
Table 3. Answers (in %) to the question “How do you think the following trends in the energy sector would impact the buildings sector? - ‘Services for energy efficiency in buildings’” ... 38
Table 4. Answers (in %) to the question “How do you think the following trends in the energy sector would impact the buildings sector? - ‘New energy services, e.g. guaranteed indoor temperature’” ... 39
Table 5. Answers (in %) to the question "Do you agree with the following statements? - 'Self-generation of electricity can create business opportunities for energy companies'" ... 43
Table 6. Answers (in %) to the question “How do you think the following trends in the buildings sector would impact the energy sector? - 'Active and flexible customers' and 'Participation in demand response'”... 43
Table 7. Answers (in %) to the question “How do you think the following trends in the energy sector would impact the buildings sector? - 'Introduction of new pricing methods, e.g. hourly pricing, peak pricing''” ... 46
Table 8. List of respondents that were quoted in the text ... 58
Table 9. List of interview respondents ... 59
Table 10. The interview guide used in this thesis ... 60
Nomenclature
Abbreviations
CHP Combined Heat and Power
EED Energy Efficiency Directive
EPBD Energy Performance of Buildings Directive
EU European Union
GHG Greenhouse gas
IPCC Intergovernmental Panel on Climate Change
NZEB Nearly Zero Energy Building
OECD Organisation for Economic Co-operation and
Development
PV Photovoltaic
RES Renewable Energy Sources
UK The United Kingdom
UNFCC United Nations Framework Convention on
Cli-mate Change
Acknowledgments
This research was conducted at the School of Business, Society and Engineer-ing, Mälardalen University, Västerås, Sweden, with financial support from the Swedish Research Council “Formas” (244-2011-231). I would like to thank my supervisors Prof. Björn Karlsson, Dr. Fredrik Wallin, Dr. Peter Stigson for their guidance and support. Many thanks to Dr. Iana Vassileva and Dr. Monica Odlare for their contribution to this research. I would like to thank Dr. Bozena Guziana for reviewing this licentiate thesis and her valuable comments.
My gratitude is for Prof. Oktay Özcan for helping me discover my interest in energy science. Many thanks to Prof. Semida Silveira and Dr. Maria Gomez for their support and guidance during my master thesis at the Royal Institute of Technology.
Many thanks to my colleagues at Mälardalen University for interesting dis-cussions and their support. Thank you Ivo for the fun coffee/lunch breaks and interesting discussions on gut flora! Special thanks to Elena for her continuous support.
Finally, I feel very much indebted with my family. Mum, I would never be here without your support. You are the strongest woman in the world! Aybike, you are my sister and my best friend, I am so proud of you! I would also like to thank the rest of my family for their support. Many thanks to my friends for great moments, I feel lucky to know you all! Marcus, thank you for your sup-port and for making the Swedish winters bearable. Finally, special thanks to Timur for our great trips and for helping me err… do nothing!
1. Introduction
1.1. Background
The climate of our world is changing. Increasing concentrations of greenhouse gases (GHGs) in the atmosphere induce climate change, which can have irre-versible impacts on the environment, ecosystems, and people. As a result of climate change, the atmosphere and ocean have warmed, the global mean sea-levels have risen, ice and snow mass have been reduced, and the occurrence of weather anomalies has increased (IPCC 2014). The UNFCC (1992) defines climate change as "a change of climate which is attributed directly or indi-rectly to human activity that alters the composition of the global atmosphere and which is in addition to natural climate variability observed over compa-rable time periods”. Given its global character, climate change has become an important issue in the international arena, where the European Union (EU) has emerged as a prominent actor in climate change politics. The EU climate pol-icy is principally structured on the European 2020 Climate and Energy Pack-age, which was introduced in 2009. The Package has introduced measures that primarily serve for the 20/20/20 targets, aiming to reach the following by 2020 (European Commission 2014a): i) reducing the GHG emissions by 20% com-pared to the levels in 1990; ii) increasing energy efficiency by 20%; iii) in-creasing the share of renewables in the final energy use by 20%.
In 2014, the European Commission has set the bar higher and announced the EU 2030 climate targets that involve reducing the GHG emissions by 40% in comparison to the levels in 1990, and increasing both energy efficiency and the renewable energy share by 27% (European Commission 2014b). Parallel to the measures in the energy sector to reduce the GHG emissions, the build-ings sector plays an essential role in fulfilling the European climate targets, as discussed in the following sections.
1.1.1. Energy and buildings
The energy sector, covering all stakeholders that range from oil production and supply to the power sector, is responsible for 80% of the total GHGs orig-inating in the EU (European Commission 2011). As an important contributor to these emissions -approximately one-third of the total GHG emissions in the EU come from energy use in buildings- the buildings sector accounts for 40%
of the total European energy demand (European Commission 2010a). Increas-ing the energy performance of buildIncreas-ings can consequently result in significant GHG emissions reductions and contribute to the efforts of the EU to combat climate change. Lechtenböhmer and Schüring (2011) reported that it is possi-ble to reach energy savings of up to 80% in European buildings by improving the energy performance of new and existing buildings, highlighting their vast energy efficiency potential. In combination with the large energy use by build-ings, this energy efficiency potential create interdependencies between the en-ergy and buildings sectors that do not only influence the climate strategies and investment decisions within the two sectors, but also the efficiency of the EU climate policy. In the light of these factors, the energy and buildings sectors have emerged as key sectors in the European efforts to combat climate change. The importance of buildings in achieving the European climate targets has been acknowledged by several EU directives that address energy use in build-ings. One of the most important of these is the Energy Performance of Build-ings Directive (EPBD), which imposes that by 2020 all new buildBuild-ings in the EU are nearly zero-energy buildings (NZEB). The Directive defines a NZEB as a building with very low energy demand that is met by local or nearby re-newable resources (European Commission 2010a). The EPBD also imposes the major renovation of existing buildings to become NZEB and requires all new buildings and buildings undergoing renovation to be equipped with smart meters. Energy performance of buildings is also addressed in the Energy Ef-ficiency Directive (EED), which requires Member States to purchase and rent only very energy efficient buildings for governmental use and to reduce en-ergy use in existing governmental buildings by 3% per annum, in addition to drawing up renovation strategies for increasing the energy efficiency of all buildings. Moreover, the EED imposes 1.5% annual end-use energy savings on utilities, prompting them to invest in energy efficiency measures (European Commission 2012). On the other hand, the Ecodesign of Energy Related Prod-ucts Directive governs the energy performance of household appliances and establishes the minimum energy performance requirements for these products (European Commission 2009a). Concerning renewables, the Renewable En-ergy Sources (RES) Directive establishes the minimum amounts of renewable energy that needs to be integrated into the electricity, heat, and cooling supply to new buildings and buildings undergoing renovation (European Commission 2009b).
The Swedish climate policy is largely shaped by that of the EU. Following the introduction of the 20/20/20 targets, Sweden introduced the national 2020 climate targets that aim to reach the following: i) reducing the GHG emissions by 40% compared to the levels in 1990; ii) increasing energy efficiency by 20%; and iii) increasing the share of renewables in the final energy consump-tion by 50%. (Swedish Government Offices 2013a)
Looking at Sweden, buildings account for 40% of the energy use and 20% of the total domestic GHG emissions (Larsson et al. 2008; Toller et al. 2009).
In line with its energy efficiency target, Sweden has set targets to cut energy use in buildings by 20% by 2020 and by 50%by 20501 (Swedish Government Offices 2005). Heat savings, accounting for approximately two-thirds of the energy efficiency potential in Swedish buildings, contributes the most to these targets (Chalmers Energy Centre 2005). Sweden was one of the first European countries to achieve universal roll-out of smart electricity meters and end-us-ers have been entitled to hourly metering free of charge since 2012 (European Commission 2010b; Swedish Government Offices 2012). In addition, a new proposal has been put forward by the Swedish Coordination Council for Smart Grid to grant free of charge access to hourly electricity consumption data for all end-users (Swedish Government Offices 2014a). In combination with the progressive smart meter policy, several measures have been introduced to en-courage electricity savings, such as the obligatory billing of all dwellings in a building and clearer energy bills, among others (Swedish Government Offices 2013b). Moreover, Swedish customers are entitled to investment subsidies for photovoltaic (PV) systems, in addition to tax reductions on surplus electricity that is fed back into the grid, which came into force in 2015 (Swedish Energy Agency 2015; Swedish Government Offices 2014b). The Swedish micro-gen-eration market was dominated by PV systems with 43.2 MW of installed ca-pacity by 2013, generating electricity that is enough to meet only 0.03% of the total domestic electricity demand (Lindahl 2013). It can be, however, expected that the share of solar power in the final electricity consumption increases as a result of the tax reduction scheme.
1 The reference year for the both targets is 1995.
Figure 1. Heating in Swedish buildings. Data source: (Swedish Energy Agency
2013b)
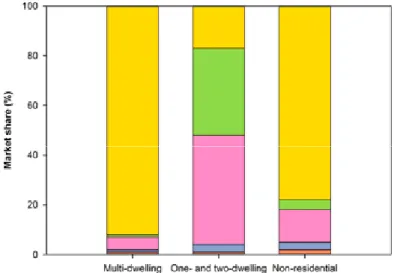
Buildings are categorised, in the context of this thesis, as residential and non-residential based on their purpose. Residential and non-non-residential buildings in Sweden used 146 TWh of energy in 2012, of which 79.5 TWh was used for heating purposes2 (Swedish Energy Agency 2013a, 2013b). Including the
electricity used for heating purposes, residential and non-residential buildings together accounted for 56% (72 TWh) of the total electricity demand in 2012 (Swedish Energy Agency 2014a).
District heating is the most popular heating method for multi-dwelling and non-residential buildings, while electric heating leads the one and two-dwell-ing buildtwo-dwell-ings market, as shown in Figure 1. Electric heattwo-dwell-ing in Swedish build-ings is mainly in the form of heat pumps. The national heat pumps market has grown to 1.1 million devices in 2013, of which 96% are installed in one- and two-dwelling buildings (Swedish Energy Agency 2014b). The rapid develop-ment of the heat pumps market in the recent years can be partially related to the national building regulations that impose lower insulation requirements on buildings heated by heat pumps (Persson and Perman 2011). Air-source heat pumps have especially gained popularity in the recent years, with 90% of new one- and two-dwelling buildings reportedly use some type of air-source heat pump for heating purposes (Swedish Energy Agency 2009).
In line with its energy efficiency target, Sweden has set targets to cut energy use in buildings by 20% by 2020 and by 50% by 20501 (Swedish Government Offices 2005). Heat savings, accounting for approximately two-thirds of the energy efficiency potential in Swedish buildings, contributes the most to these targets (Chalmers Energy Centre 2005). Sweden was one of the first European countries to achieve universal roll-out of smart electricity meters and end-us-ers have been entitled to hourly metering free of charge since 2012 (European Commission 2010b; Swedish Government Offices 2012). In addition, a new proposal has been put forward by the Swedish Coordination Council for Smart Grid to grant free of charge access to hourly electricity consumption data for all end-users (Swedish Government Offices 2014a). In combination with the progressive smart meter policy, several measures have been introduced to en-courage electricity savings, such as the obligatory billing of all dwellings in a building and clearer energy bills, among others (Swedish Government Offices 2013b). Moreover, Swedish customers are entitled to investment subsidies for photovoltaic (PV) systems, in addition to tax reductions on surplus electricity that is fed back into the grid, which came into force in 2015 (Swedish Energy Agency 2015; Swedish Government Offices 2014b). The Swedish micro-gen-eration market was dominated by PV systems with 43.2 MW of installed ca-pacity by 2013, generating electricity that is enough to meet only 0.03% of the total domestic electricity demand (Lindahl 2013). It can be, however, expected that the share of solar power in the final electricity consumption increases as a result of the tax reduction scheme.
1The reference year for the both targets is 1995.
Figure 1. Heating in Swedish buildings. Data source: (Swedish Energy Agency
2013b)
Buildings are categorised, in the context of this thesis, as residential and non-residential based on their purpose. Residential and non-non-residential buildings in Sweden used 146 TWh of energy in 2012, of which 79.5 TWh was used for heating purposes2 (Swedish Energy Agency 2013a, 2013b). Including the
electricity used for heating purposes, residential and non-residential buildings together accounted for 56% (72 TWh) of the total electricity demand in 2012 (Swedish Energy Agency 2014a).
District heating is the most popular heating method for multi-dwelling and non-residential buildings, while electric heating leads the one and two-dwell-ing buildtwo-dwell-ings market, as shown in Figure 1. Electric heattwo-dwell-ing in Swedish build-ings is mainly in the form of heat pumps. The national heat pumps market has grown to 1.1 million devices in 2013, of which 96% are installed in one- and two-dwelling buildings (Swedish Energy Agency 2014b). The rapid develop-ment of the heat pumps market in the recent years can be partially related to the national building regulations that impose lower insulation requirements on buildings heated by heat pumps (Persson and Perman 2011). Air-source heat pumps have especially gained popularity in the recent years, with 90% of new one- and two-dwelling buildings reportedly use some type of air-source heat pump for heating purposes (Swedish Energy Agency 2009).
1.1.2. Swedish energy sector
Sweden is a high-income country with an export-oriented economy. Despite a relatively high energy demand, the Swedish economy has the second lowest carbon-intensity (CO2/GDP) among OECD countries (OECD 2014). The
pri-mary energy supply in 2012 was 598 TWh, of which approximately one third came from fossil fuels. Excluding losses and use for non-energy purposes, the total energy use in the same year was 377 TWh. The residential and non-resi-dential (services) sectors used the most energy with 39% of the total energy use, followed by the industrial and the transport sectors with 38% and 23%, respectively. Despite small fluctuations, the total energy use has remained sta-ble in the last two decades (Swedish Energy Agency 2014a).
Sweden has one of the highest per-capita electric power consumption rates in the world with 14,000 kWh/year (World Bank 2014). Nevertheless, the ma-jority of power production in Sweden rely on fossil-free resources. In 2012, hydropower represented 48% of the total electricity generation, while nuclear power and wind power contributed with 38% and 4%, respectively. The re-maining power production (10%) came from combustion based generation at CHP plants and the industry (Swedish Energy Agency 2013a).
Sweden deregulated its electricity market in 1996, which opened the gen-eration and retail of electricity to competition, and joined Nord Pool, the Nor-dic power market. The deregulation did not only introduce competition to the electricity market, but also changed the market composition significantly. Be-fore the deregulation, ten state-owned companies accounted for 90% of the total generation and the rest was supplied by municipalities and small private companies (Kärrmark 2001). The state-owned Vattenfall owned and operated the transmission network until it was taken over by Svenska Kraftnät (Swedish National Grid) in 1992. Some 300 companies, of which the majority were mu-nicipally owned, operated the distribution networks and electricity prices were set on a cost-pricing basis with respect to the Swedish Local Government Act, which stipulates that municipalities are not allowed to make profits (Kärrmark 2001). Following the deregulation, the transmission and distribution of elec-tricity remained as natural monopolies3. Several municipalities, now obliged to charge customers market prices, sold their energy companies for financial and political reasons (Andersson and Thörnqvist 2006). Acquisitions and the internationalisation of the electricity market after the deregulation resulted in a higher concentration of ownership and capital in the market (Lundgren et al. 2013). This has been a matter of criticism by industry and interest groups, such as the Swedish Paper Workers Union, as well as some researchers in the
3 In natural monopolies, the capital costs for the infrastructure are so high that only a single
company can operate the network in the most cost-effective way (Posner 1969).
dia, which argued that large companies influence the electricity prices to in-crease their profits (Dagens Nyheter 2007; Expressen 2007; Göteborgs-posten 2007, 2011; Sveriges Radio 2009).
Figure 2. Price development of electricity between 1996 and 2014. Continuous
lines represent the retail prices and dashed lines represent the average distribution prices, both excluding taxes. The retail prices from 2007 and onwards include electricity certificates. Data source: (Statistics Sweden 2013a, 2014, 2015)
Despite the introduction of competition with the deregulation, the retail prices of electricity in Sweden rose significantly between 1996 and 2011. After 2011, however, they have been following a downward trend, as displayed in Figure 2. The average prices for electricity distribution, on the other hand, have been steadily increasing and have reached 50% higher than the pre-deregulation levels for some user groups (Figure 2). In addition, the price per kWh of dis-tributed electricity vary significantly throughout the country, reaching twice the lowest price charged in some networks (Nils Holgerssongruppen 2014). Increasing electricity distribution prices and high price differences between networks led to allegations of monopoly abuse and price regulations on elec-tricity distribution were introduced as late as 2011. However, they have failed to alleviate the criticism by some industry and interest groups representing the buildings sector, which called for stricter price regulations on the distribution of electricity (SvD 2011; Swedish Property Federation 2013). The govern-ment announced in 2014 that new price regulations will be adopted to ensure fair prices and empower consumers (Swedish Government Offices 2014c).
1.1.2. Swedish energy sector
Sweden is a high-income country with an export-oriented economy. Despite a relatively high energy demand, the Swedish economy has the second lowest carbon-intensity (CO2/GDP) among OECD countries (OECD 2014). The
pri-mary energy supply in 2012 was 598 TWh, of which approximately one third came from fossil fuels. Excluding losses and use for non-energy purposes, the total energy use in the same year was 377 TWh. The residential and non-resi-dential (services) sectors used the most energy with 39% of the total energy use, followed by the industrial and the transport sectors with 38% and 23%, respectively. Despite small fluctuations, the total energy use has remained sta-ble in the last two decades (Swedish Energy Agency 2014a).
Sweden has one of the highest per-capita electric power consumption rates in the world with 14,000 kWh/year (World Bank 2014). Nevertheless, the ma-jority of power production in Sweden rely on fossil-free resources. In 2012, hydropower represented 48% of the total electricity generation, while nuclear power and wind power contributed with 38% and 4%, respectively. The re-maining power production (10%) came from combustion based generation at CHP plants and the industry (Swedish Energy Agency 2013a).
Sweden deregulated its electricity market in 1996, which opened the gen-eration and retail of electricity to competition, and joined Nord Pool, the Nor-dic power market. The deregulation did not only introduce competition to the electricity market, but also changed the market composition significantly. Be-fore the deregulation, ten state-owned companies accounted for 90% of the total generation and the rest was supplied by municipalities and small private companies (Kärrmark 2001). The state-owned Vattenfall owned and operated the transmission network until it was taken over by Svenska Kraftnät (Swedish National Grid) in 1992. Some 300 companies, of which the majority were mu-nicipally owned, operated the distribution networks and electricity prices were set on a cost-pricing basis with respect to the Swedish Local Government Act, which stipulates that municipalities are not allowed to make profits (Kärrmark 2001). Following the deregulation, the transmission and distribution of elec-tricity remained as natural monopolies3. Several municipalities, now obliged to charge customers market prices, sold their energy companies for financial and political reasons (Andersson and Thörnqvist 2006). Acquisitions and the internationalisation of the electricity market after the deregulation resulted in a higher concentration of ownership and capital in the market (Lundgren et al. 2013). This has been a matter of criticism by industry and interest groups, such as the Swedish Paper Workers Union, as well as some researchers in the
me-3In natural monopolies, the capital costs for the infrastructure are so high that only a single
company can operate the network in the most cost-effective way (Posner 1969).
dia, which argued that large companies influence the electricity prices to in-crease their profits (Dagens Nyheter 2007; Expressen 2007; Göteborgs-posten 2007, 2011; Sveriges Radio 2009).
Figure 2. Price development of electricity between 1996 and 2014. Continuous
lines represent the retail prices and dashed lines represent the average distribution prices, both excluding taxes. The retail prices from 2007 and onwards include electricity certificates. Data source: (Statistics Sweden 2013a, 2014, 2015)
Despite the introduction of competition with the deregulation, the retail prices of electricity in Sweden rose significantly between 1996 and 2011. After 2011, however, they have been following a downward trend, as displayed in Figure 2. The average prices for electricity distribution, on the other hand, have been steadily increasing and have reached 50% higher than the pre-deregulation levels for some user groups (Figure 2). In addition, the price per kWh of dis-tributed electricity vary significantly throughout the country, reaching twice the lowest price charged in some networks (Nils Holgerssongruppen 2014). Increasing electricity distribution prices and high price differences between networks led to allegations of monopoly abuse and price regulations on elec-tricity distribution were introduced as late as 2011. However, they have failed to alleviate the criticism by some industry and interest groups representing the buildings sector, which called for stricter price regulations on the distribution of electricity (SvD 2011; Swedish Property Federation 2013). The govern-ment announced in 2014 that new price regulations will be adopted to ensure fair prices and empower consumers (Swedish Government Offices 2014c).
District heating represented 58% of the Swedish heating market in 2013 with 46.7 TWh (Swedish Energy Agency 2014b). There is at least one district heat-ing network in 263 of the 290 municipalities (Nils Holgerssongruppen 2014). Similar to electricity distribution, district heating suppliers hold a natural mo-nopoly position in their networks, meaning that despite interconnections be-tween some networks, the customers buy heat from the local supplier. District heating generation in Sweden relies primarily on biofuels (44%), followed by waste (21%), fossil fuels (including peat) (11%), flue-gas condensation (9%), electricity (8%), and industrial waste heat (7%) (Swedish District Heating Association 2014). Combined Heat and Power (CHP) plants generates both electricity and heat, connecting some district heating networks to the electric-ity market. Due to this connection, the deregulation has also introduced sev-eral changes to the district heating sector.
Prior to the deregulation in 1996, municipalities owned the majority of dis-trict heating networks and sold heat on a cost-pricing basis with respect to the non-profit obligations on municipalities. To prevent risks of cross-subsidisa-tion between heat and electricity produccross-subsidisa-tion in CHP plants, price regulacross-subsidisa-tions on district heating were lifted and district heating suppliers were instructed to charge market value for the heat. Switching from cost-pricing to market-pric-ing attracted the interest of for-profit companies, which acquired multiple net-works around the country and created a higher concentration of ownership in the national district heating market. (Söderholm and Wårell 2011)
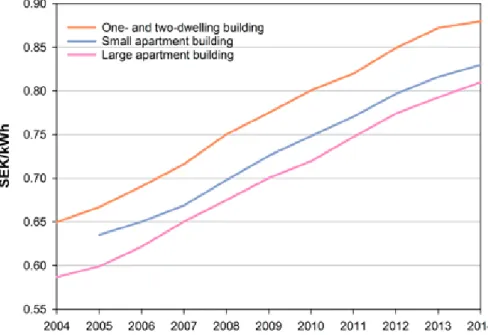
Figure 3. Average price development of district heating between 2004 and 2014.
Data source: (Swedish District Heating Association 2015)
Despite the lack of price regulations, the average prices for district heating did not rise significantly between 1996 and 2004. After 2004, however, the aver-age prices of district heating have increased steadily for all customer groups, as illustrated in Figure 3. In addition, the price differences between suppliers have grown to reach more than twice the lowest price in the most expensive networks (Nils Holgerssongruppen 2014). Heat prices were reported to have increased more in networks owned by large companies than those owned by smaller companies (Swedish Government Offices 2011a). As a result of these developments, some suppliers have been accused of exploiting their monop-oly position and the growing criticism led to a governmental inquiry into third-party access to district heating networks in 2011 (NyTeknik 2013; Swedish Government Offices 2011b; Sveriges Radio 2010; SVT 2007). The inquiry proposed a similar structure to the electricity market with competitive gener-ation and retail, and a price regulated distribution. However, the Swedish gov-ernment has instead introduced a so-called “controlled access” to district heat-ing networks, allowheat-ing external suppliers to sell heat to district heatheat-ing net-works in cases where the heat supplier and the network owner fail to reach an agreement. The controlled access is expected to increase the penetration of industrial waste heat to district heating networks, but it does not open the retail end of district heating to competition (Swedish Government Offices 2014d).
1.1.3. Swedish buildings sector
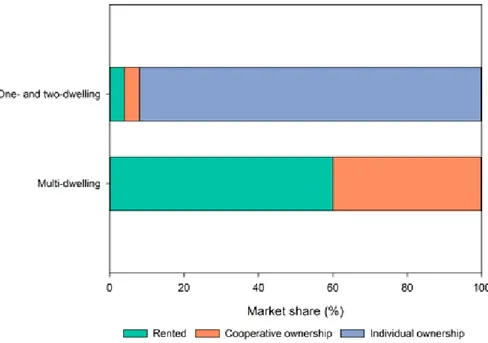
In Sweden, the residential sector consisted of two million households in multi-dwelling buildings (blocks of flats) and two and a half million households in one- and two-dwelling buildings (villas) in 2014. Most flats in multi-dwelling buildings are rented from housing companies whereas private persons own a strong majority of the one- and two-dwelling buildings, as shown in Figure 4 (Statistics Sweden 2013b). Cooperative ownership is common in multi-dwell-ing buildmulti-dwell-ings, as also illustrated in Figure 4. A housmulti-dwell-ing cooperative is an eco-nomical association that is formed by the owners in a building to provide hous-ing on a non-profit basis.
The Swedish non-residential sector, on the other hand, consists of 70,000 buildings that are used by commercial organisations, schools, libraries, swim-ming pools and other establishments (Swedish Energy Agency 2014c). Ap-proximately 80% of the commercial spaces in Sweden are owned privately (Swedish Property Federation 2014).
District heating represented 58% of the Swedish heating market in 2013 with 46.7 TWh (Swedish Energy Agency 2014b). There is at least one district heat-ing network in 263 of the 290 municipalities (Nils Holgerssongruppen 2014). Similar to electricity distribution, district heating suppliers hold a natural mo-nopoly position in their networks, meaning that despite interconnections be-tween some networks, the customers buy heat from the local supplier. District heating generation in Sweden relies primarily on biofuels (44%), followed by waste (21%), fossil fuels (including peat) (11%), flue-gas condensation (9%), electricity (8%), and industrial waste heat (7%) (Swedish District Heating Association 2014). Combined Heat and Power (CHP) plants generates both electricity and heat, connecting some district heating networks to the electric-ity market. Due to this connection, the deregulation has also introduced sev-eral changes to the district heating sector.
Prior to the deregulation in 1996, municipalities owned the majority of dis-trict heating networks and sold heat on a cost-pricing basis with respect to the non-profit obligations on municipalities. To prevent risks of cross-subsidisa-tion between heat and electricity produccross-subsidisa-tion in CHP plants, price regulacross-subsidisa-tions on district heating were lifted and district heating suppliers were instructed to charge market value for the heat. Switching from cost-pricing to market-pric-ing attracted the interest of for-profit companies, which acquired multiple net-works around the country and created a higher concentration of ownership in the national district heating market. (Söderholm and Wårell 2011)
Figure 3.Average price development of district heating between 2004 and 2014.
Data source: (Swedish District Heating Association 2015)
Despite the lack of price regulations, the average prices for district heating did not rise significantly between 1996 and 2004. After 2004, however, the aver-age prices of district heating have increased steadily for all customer groups, as illustrated in Figure 3. In addition, the price differences between suppliers have grown to reach more than twice the lowest price in the most expensive networks (Nils Holgerssongruppen 2014). Heat prices were reported to have increased more in networks owned by large companies than those owned by smaller companies (Swedish Government Offices 2011a). As a result of these developments, some suppliers have been accused of exploiting their monop-oly position and the growing criticism led to a governmental inquiry into third-party access to district heating networks in 2011 (NyTeknik 2013; Swedish Government Offices 2011b; Sveriges Radio 2010; SVT 2007). The inquiry proposed a similar structure to the electricity market with competitive gener-ation and retail, and a price regulated distribution. However, the Swedish gov-ernment has instead introduced a so-called “controlled access” to district heat-ing networks, allowheat-ing external suppliers to sell heat to district heatheat-ing net-works in cases where the heat supplier and the network owner fail to reach an agreement. The controlled access is expected to increase the penetration of industrial waste heat to district heating networks, but it does not open the retail end of district heating to competition (Swedish Government Offices 2014d).
1.1.3. Swedish buildings sector
In Sweden, the residential sector consisted of two million households in multi-dwelling buildings (blocks of flats) and two and a half million households in one- and two-dwelling buildings (villas) in 2014. Most flats in multi-dwelling buildings are rented from housing companies whereas private persons own a strong majority of the one- and two-dwelling buildings, as shown in Figure 4 (Statistics Sweden 2013b). Cooperative ownership is common in multi-dwell-ing buildmulti-dwell-ings, as also illustrated in Figure 4. A housmulti-dwell-ing cooperative is an eco-nomical association that is formed by the owners in a building to provide hous-ing on a non-profit basis.
The Swedish non-residential sector, on the other hand, consists of 70,000 buildings that are used by commercial organisations, schools, libraries, swim-ming pools and other establishments (Swedish Energy Agency 2014c). Ap-proximately 80% of the commercial spaces in Sweden are owned privately (Swedish Property Federation 2014).
Figure 4. Ownership in the Swedish residential sector. Data source: (Statistics
Sweden 2013b)
There are approximately 93,700 companies in the construction sector in Swe-den, ranging from multi-national construction companies to installation com-panies with a few employees (BI 2013). The housing sector, on the other hand, consists of approximately 76,400 companies, of which around 300 are munic-ipally owned housing companies (Swedish Property Federation 2015). There is strong tradition of public housing in Sweden, where municipalities provide public housing through municipal housing companies. In order to comply with the EU regulations on competition and state-aid, Sweden has introduced large changes to public housing in 2009 and required municipal housing companies to adopt a market approach while maintaining their public purpose (Swedish Government Offices 2010). The changes resulted in a clearer economic sepa-ration between municipalities and municipal housing companies, preventing municipalities from cross-subsidising public housing (Elsinga and Lind 2013; Pawson et al. 2012). However, municipalities maintain strong influence on the activities of their housing companies through owner’s directives.
1.1.4. Cooperation between stakeholders
The terms cooperation and collaboration are often used interchangeably in the literature for referring to cross-organisational alliances, despite the differences between the two terms. According to Malone et al. (1994) the term coopera-tion refers to shared goals among different actors, while collaboracoopera-tion implies working together on a task that requires intellectual efforts. In this thesis, the term cooperation is used for referring to a set of behaviours or activities be-tween organisations to achieve mutually beneficial outcomes or goals that can-not be reached alone (Wilson and Nielson 2001). The outcomes of cooperation can be in the form of increased profits, innovation, environmental or societal gains, among many others (Eriksson et al. 2008; Van Huijstee et al. 2007). There are several examples of cooperation between the energy and buildings sectors in Sweden that has resulted in innovation and reduced GHG emissions. Municipal energy and housing companies have been involved in the develop-ment and execution of municipal energy plans since the 1970’s. Climate plans have also accompanied energy plans since the 1990’s as a result of the grow-ing awareness of climate change. As an example, Eskilstuna municipality has set targets in its 2020 climate plan to reduce energy use by 25% in buildings owned by the municipality, including those used for residential purposes, and reach 20% share of renewable self-generation in the total electricity consump-tion through the involvement of the municipally owned energy and housing companies (Eskilstuna Municipality 2012). Stakeholders from the energy and buildings sectors have been involved in the development of Stockholm Royal Seaport, an urban development project, where smart grid technologies are be-ing tested (Swedish Energy Agency 2011). A similar project is under devel-opment in Hyllie, a district of Malmö (Hyllie 2014). Another example is the cooperation between the municipal housing and energy companies in the city of Västerås that resulted in a smart grid pilot project and the distribution of low-temperature district heating to low-energy buildings, also including dis-trict heating driven white goods (Mimer 2014; Mälarenergi 2010).
A common feature of the abovementioned initiatives is that they are led by municipalities, which often own the local energy and housing companies, or governmental organisations. It is vital, however, to shift the level of coopera-tion between the energy and buildings sectors from pilot projects to common practices by focusing on mutual benefits. Such shift may require a departure from current business methods, which can be challenging for stakeholders in the two sectors. In addition, there can be factors that create conflicts between the energy and buildings sectors and negatively impact inter-sectoral cooper-ation.