BATTERY ELECTRIC VEHICLES
The diffusion in Sweden and the impact on the local power grid in Västerås
DANIEL BOGDANOSKI & REBIN RASOOL
Akademin för ekonomi, samhälle och teknik Kurs: Examensarbete inom Energiteknik Kurskod: ERA402
Ämne: Energiteknik Högskolepoäng: 30 hp
Program: Civilingenjörsprogrammet i industriell ekonomi
Handledare: Fredrik Wallin & Jakub Juraz Examinator: Sebastian Schwede
Uppdragsgivare: Mälardalens Högskola Datum: 13-01-2020
E-post:
dbi13002@student.mdh.se rrl13003@student.mdh.se
ABSTRACT
There are many ways to address the growing concerns of rising greenhouse gas emissions which contribute to the global warming phenomenon. One of the most pivotal aspects would be to seek an electrification of the transportation system, to eliminate on-road emissions. Trend forecasts regarding the uptake of battery electric vehicles show a continuous and exponential growth. This indicates that momentum is building with each year that passes and a lot of that has to do with technological innovation. Specifically, we are seeing progress in battery development, with cheaper production and a significantly increasing supply. Auto-manufacturers are pledging BEVs to their vehicle line-ups and the consensus seems to be that the future of transport is electric.
Questions regarding impacts on power grids and distribution networks have been discussed extensively in the literature. Case studies have exemplified how an increased penetration of BEVs will affect the electricity consumption of a specific country or region. This paper aims to expand such research and investigate how a local power grid can experience challenges when the proliferation of BEVs makes up 30% and 50% of the total number of cars in traffic. To achieve this a power estimation model is proposed to calculate the electricity consumption of any given BEV and then see how peak hour electricity demand will be affected without any management of charging patterns.
The exemplification of this study occurs through an examination of two residential area in the city of Västerås in Sweden. These areas are comprised of individual housing and apartment complexes. Assumptions made, regarding daily driving distances and charging patterns, are supported by a literature study. From prior studies consisting of travel surveys and GPS data, conclusions could be made about how the BEV will be used on a daily basis. This knowledge was the foundation for the calculations conducted in our model. The construction of the modelling cases occurred in the Excel environment.
The achieved results show that uncontrolled charging, where individuals plug-in the BEV to the grid during peak hours of electricity demand, will significantly increase the peaks. Tests were also conducted for a more spread out charging pattern, where individuals charge the BEVs at different times during the day. These results yield a more manageable situation since even with a penetration level of 50% the distribution network could handle the extra load, without the need for expensive upgrades.
PREFACE
This document is a thesis project in Master of Science in Engineering, a 300 credits program at Mälardalen University. It represents the final stage in the quest for attaining the master’s degree. The study period was from January to October of 2019.
The investigation was conducted in relation to MDH and their supervision, we would therefore like to thank Eva Thorin for an expertly executed course and great guidance throughout the study period.
We would like to extend our utmost gratitude towards Anders Malmquist and Giorgios Foskolos for the invaluable insights into the inner workings of grid planning at Mälarenergi AB. Their assistance helped shape our research and all the provided data was crucial to the investigation we conducted.
We appreciate and thank our supervisors at Mälardalen University, Fredrik Wallin and Jakub Juraz. For the necessary guidance and knowledge which was essential to this report. Västerås, January 2020
CONTENTS
1 INTRODUCTION ...10
1.1 Background ...11
1.1.1 Swedish Electricity Production ...12
1.1.1.1. Mälarenergi – Local Electricity Provider in Västerås ...13
1.1.2 BEV’s Electricity Usage ...14
1.2 Purpose and Objective ...16
1.3 Deliverables and Research Questions ...16
1.4 Delimitation and Boundaries ...16
2 METHODOLOGY ...17
2.1 Data Sources ...17
2.2 Trendspotting and Backcasting ...18
2.3 Model Implementation ...19
3 FORECASTING THE EV EXPANSION IN SWEDEN ...20
3.1 Trend Signals for an Accelerated BEV Expansion ...22
3.1.1 Developments in Battery Technology ...22
3.1.2 Financial Mechanisms ...24
3.1.3 Social and Consumer Perception ...26
4 THE ELECTRICITY DEMAND OF BEVS ...27
4.1 Implications on Load Profiles in the Distribution Network ...27
4.1.1 Managing Electricity Loads: Peak Shaving ...29
4.1.1.1. Smart Grid...29
4.1.1.2. Demand-side Management (DSM) ...30
4.1.1.3. Temporal Price Differentiation ...30
4.1.1.4. Vehicle-to-Grid (V2G) ...30
4.1.1.5. Battery Energy Storage System ...31
5 ELECTRICITY CONSUMPTION ESTIMATION MODEL...33
5.1 Models for Electricity Consumption ...33
5.2 Engine Power to Overcome Driving Resistances...34
5.2.1 Power Estimation Model ...34
5.3 Behavioral Patterns of BEV Users ...37
5.3.1 Charging Patterns ...37
5.3.2 Travel Habits and Driving Cycles ...38
6 CURRENT STUDY ...41
6.1 The City of Västerås ...41
6.2 Scenario Creation ...42
6.2.1 The BEV Penetration Level ...42
6.2.2 The Probable Scenario with Distributed Charging Events ...43
6.2.3 The Extreme Scenario with Uncontrolled Charging Events ...43
6.2.4 The Load Profiles of Electricity Intense Days ...44
6.3 Selection of Residential Areas ...44
6.3.1 Gryta ...45
6.3.2 Öster Mälarstrand ...46
6.4 Data Acquisition and Modelling...47
6.4.1 Models of BEVs and Relevant Inputs ...47
6.4.2 Modelling ...48
6.4.3 Declaration of Conditions and Parameters ...49
7 RESULTS AND ANALYSIS ...51
7.1 The Base Model ...51
7.2 Comparing Average Load Profiles with Electricity Intense Days ...52
7.3 The Probable Scenario – Distributed Charging Events ...54
7.3.1 30% Penetration Level ...54
7.3.2 50% Penetration Level ...56
7.4 The Extreme Scenario – Uncontrolled Charging Events ...58
7.4.1 30% Penetration Level ...58
7.4.2 50% Penetration Level ...60
7.5 Analyzing the Model Through Parameter Variation ...62
8 DISCUSSION...63
8.1 The Modelling Outcome ...63
8.1.1 Benefits of Distributed Charging Compared to Uncontrolled Charging ...64
8.1.2 Comparative Analysis with Previous Research ...65
8.1.3 A Sustainable Grid Through Peak Shaving ...67
8.2 Sensitivity Analysis ...69 8.2.1 Strengths ...69 8.2.2 Weaknesses ...70 8.2.3 Opportunities ...70 8.2.4 Threats...71 9 CONCLUSION ...72 10 FUTURE WORK ...73 REFERENCES ...74
APPENDIX 1: BATTERY CHARGING PROFILES ...82
APPENDIX 2: ELECTRICITY MEASUREMENTS...83
LIST OF FIGURES
Figure 1 Percentage of market shares of new car sales (Power Circle, 2018) ... 11Figure 2 Sweden’s electricity production mix (Data: Svenska Kraftnät, 2019) ... 13
Figure 3 Overview of the Swedish electrical grid – Production to end consumer (Nordling, 2016) ... 13
Figure 4 Mälarenergi's electricity network area (Mälarenergi, 2019a) ... 14
Figure 5 The five adopter categories of diffusion of innovation theory (CFI, 2019) ... 20
Figure 6 The prognosis of EV ownership in Sweden (Power Circle, 2018)... 20
Figure 7 Outlook for electric cars in the Nordic countries to 2030 (IEA, 2018) ... 21
Figure 8 Lithium-ion battery price survey results: volume-weighted average (Goldie-Scot, 2019) ... 23
Figure 9 Lithium-ion battery price outlook (Goldie-Scot, 2019) ... 23
Figure 10 Increased market shares of EVs due to financial incentive programs (Mock & Yang, 2014)... 25
Figure 11 Typical household electricity use in Sweden per person (Swedish Energy Market Inspectorate, 2016) ... 28
Figure 12 Increased load with different levels of EV diffusion (Vassileva & Campillo, 2017) . 29 Figure 13 Illustration of peak shaving through BESS (ADB, 2018) ... 32
Figure 14 The characteristics of battery charging (Yong et al., 2015) ... 33
Figure 15 Estimated energy consumption compared to measured energy consumption (Wu et al., 2015) ... 35
Figure 16 Last arrival time of the day (Gustafsson & Thurin, 2015) ... 38
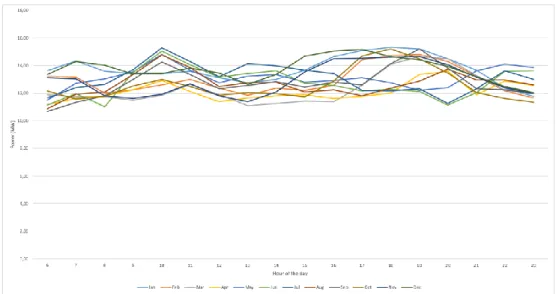
Figure 17 Daily average household electricity consumption for each month in Gryta... 46
Figure 18 Daily average household electricity consumption for each month in Öster Mälarstrand ... 47
Figure 20 Three of the most electricity intense days in Öster Mälarstrand ... 53
Figure 21 Daily average household electricity consumption for each month in Gryta based on distributed charging events. ... 54
Figure 22 Daily average household electricity consumption for each month in Öster Mälarstrand based on distributed charging events. ... 55
Figure 23 Daily average household electricity consumption for each month in Gryta based on distributed charging events. ... 56
Figure 24 Daily average household electricity consumption for each month in Öster Mälarstrand based on distributed charging events. ...57
Figure 25 Charging events at 5 p.m. – The new daily average household electricity consumption for each month in Gryta. ... 58
Figure 26 Charging events at 5 p.m. – The new daily average household electricity consumption for each month in Öster Mälarstrand. ... 59
Figure 27 Charging events at 5 p.m. – The new daily average household electricity consumption for each month in Gryta. ... 60
Figure 28 Charging events at 5 p.m. – The new daily average household electricity consumption for each month in Öster Mälarstrand. ... 61
Figure 29 Overview of SWOT-analysis of the base model ... 69
Figure 30 Nissan Leaf charging profile (Data: Foskolos, 2019) ... 82
Figure 31 Renault ZOE charging profile (Data: Foskolos, 2019) ... 82
Figure 32 BMW i3 charging profile (Data: Foskolos, 2019) ... 82
Figure 33 Location of the gathered electricity data in Gryta (Data: Mälarenergi) ... 83
Figure 34 Location of the gathered electricity data in Öster Mälarstrand (Data: Mälarenergi) ... 83
LIST OF TABLES
Table 1 Investment costs of BEVs and ICEVs in Sweden (Allt om elbil, 2019) ... 11Table 2 Market developments of EVs (Swedish Energy Agency, 2009) ... 21
Table 3 Announced battery manufacturing facilities (IEA, 2019) ... 24
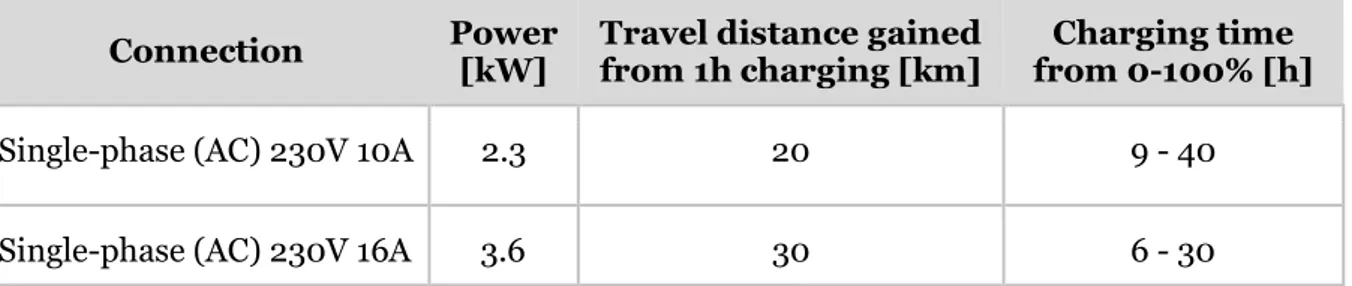
Table 4 Common alternatives for slow charging (Emobility, 2019) ... 37
Table 5 Summary of findings from studies regarding daily driving distances per person ... 50
Table 6 The base model for the electricity consumption of one BEV ... 51
Table 7 Summary of the model’s outcome when parameters were altered... 62
Table 8 Summary of the acquired results ... 64
DESIGNATIONS
Denomination Description Unit
F Tractive force Newton [N]
E Energy kWh
Denomination Description Unit
EC Energy consumption rate of BEV kWh/km
Fa Acceleration force Newton [N]
Fd Drag resistance Newton [N]
Ff Rolling resistance Newton [N]
Fs Grade resistance Newton [N]
ka Aerodynamic resistance constant
frl Rolling resistance constant
Cm Monthly coefficient
CD Drag coefficient
Af Frontal area of vehicle m2
m Mass kg
g Gravity m/s2
a Acceleration m/s2
v Velocity m/s
ρ Density kg/m3
θ Roadway grade Degrees
P Input power W p Output power W ηm Motor efficiency ηc Charging efficiency Ne Numer of BEVs D Distance km
ABBREVIATIONS
Abbreviation DescriptionBEV Battery electric vehicle
PHEV Plug-in hybrid electric vehicle ICEV Internal combustion engine vehicle
EV Electric vehicle
GHG Greenhouse gas
CO2 Carbondioxide
EU European Union
VAT Value added tax
Abbreviation Description
DSM Demand-side management
TPD Temporal price differentiation
V2G Vehicle-to-grid
GPS Global positioning system
FSSF Future signals sense-making framework BESS Battery Energy Storage System
DEFINITIONS
Definition Description
Battery electric vehicle A pure electric vehicle that uses chemical energy stored in rechargeable battery packs. BEVs use electric motors and motor controllers instead of internal combustion engines.
Plug-in hybrid electric
vehicle A hybrid electric vehicle whose battery can be recharged by plugging it into an external source of electric power as well by its on-board engine and generator.
Electric vehicle Terminology for both BEV and PHEV. Internal combustion
1
INTRODUCTION
Today most climate scientists agree that the main cause of the current global warming trend is human expansion of the “greenhouse effect”. This is the warming of the planet that occurs when the atmosphere traps heat radiating from Earth toward space. (Nasa, 2019) To counteract the global warming, which has been scientifically proven to be contributed by human activity, ambitious efforts have been undertaken by nations worldwide. On a national level, there’s an accepted responsibility to curb emissions and take initiatives to shift the electricity production from fossil fuels to renewable alternatives. (United Nations Climate Change, 2019)
In addition, climate and energy policies also strongly lean towards diversification of transportation fuels. The goal is to improve energy efficiency and reducing greenhouse gas emissions. (Haidar et al., 2014) One way of stimulating the introduction of less carbon intensive energy sources is through an extensive deployment of battery electric vehicles. Although BEVs have been around for as long as their fossil fueled counterparts, they only gained relevance in recent years. While this is the main reason for their comeback into the public eye, other aspects include industrialized countries dependency on fossil fuels and breakthroughs in the development of batteries. (Nykvist & Nilsson, 2015) Continual improvements made to the efficiency of BEVs paired with the decarbonization of electricity production will further contribute to a cleaner environment. (Buekers et al., 2014) Studies have found that BEVs will reduce the transportation sector’s environmental impacts. It is achieved by mitigation of CO2 emissions and producing nearly zero nitrogen oxides (NOx). (Yagcitekin
et al., 2017; Dhar et al., 2017)
However, it is argued that when innovation challenges existing dominant technological regime, there will be socio-economic-technical barriers counteracting the transition. This is extremely true in the case of BEVs, since they are niche product challenging the status quo in the transportation- and energy sector. (Berkeley et al., 2017); (Haddadian et al., 2015) Berkeley et al. (2017) states that today we are connected to a certain type of automotive ecosystem, this interacts with us environmentally, socially, economically and politically. The current automotive ecosystem is heavily dominated by ICEVs and they constitute the prevalent regime. For the past decade, BEVs have gained momentum and started penetrating the market and disrupting the existing regime. (Berkeley et al., 2017) In 2019 there are still quite few BEVs on the market and they are both significantly more expensive and offer worse performance compared to an ICEV.
In addition, the need for an extensive charging infrastructure cannot be understated. According to Power Circle (2018) the development of the charging infrastructure has increased, however, not at the same pace of the EV diffusion. Meaning that today there is barely one public charging locations per ten EVs in Sweden. Concerning this report, the main topic of the master thesis is to illustrate the increasing BEV diffusion and analyze its impact on the power grid in Västerås, by investigating two residential areas. Currently, there are no public charging locations in these residential areas, the only option for charging EVs is home charging. (Mälarenergi, 2019b)
1.1
Background
In 2019, a common BEV in Sweden has around 290 km of range and is equipped with a 41 kWh battery. Its top speed is 158 km/h and the power of the electric motor is 156 kW. Since BEVs do not utilize an internal combustion engine they instead rely on its electrical components to propel the vehicle forward. The positive by-product of this is zero on-road emissions of CO2.
(Power Circle, 2018) However, large batteries are a core component of BEVs and the deciding technology which influences manufacturing costs (Yong et al., 2015; Sakti et al., 2017). Because of this, there is quite a substantial price disparity between BEVs and ICEVs. Table 1 shows the investment costs of the most common BEVs in Sweden and their ICEV counterparts. Evidently, the BEVs require a larger initial investment, on average an additional cost of 167 240 SEK.
Table 1 Investment costs of BEVs and ICEVs in Sweden (Allt om elbil, 2019)
BEV Price [SEK] ICEV Price [SEK] Difference
Nissan Leaf
387 400
Nissan Micra147 100
240 300
KIA Soul EV
316 840
KIA Soul163 180
153 660
Peugeot iOn
269 900
Peugeot 108111 900
158 000
Renault ZOE
252 900
Renault Clio135 900
117 000
In 2018, BEVs took up merely 2% of the market share of new car sales. However, the market is expected to be dominated by EVs as early as 2026. Even though car manufacturers unanimously agree that the future is electric, there is an absence of different EV models with only 8% of car models being chargeable. That number is expected to increase to 34% by the year 2022. Today, about half of all car manufacturers that sell vehicles on the Swedish market have communicated a complete transfer to electrified vehicles. (Power Circle, 2018)
Figure 1 Percentage of market shares of new car sales (Power Circle, 2018)
Nykvist and Nilsson (2015) state that to achieve a compelling and affordable mass-market BEV, the most vital aspect to focus on is its relative cost. However, the innovation process is merely in its dawn, with unit production costs now exceeding those of ICEVs. Usually when innovation is introduced it is normal for customers to pay a premium to acquire it. Fridström and Östli (2017) argue that as time passes, with improvements to the technology, the combined costs of BEVs will gradually converge to those of ICEVs.
Also, a shift to zero emission cars will eventually yield a large energy savings in the future. Thus, entail a financial benefit for the individual. Nevertheless, because this benefit occurs much later into the ownership of the car, it is essential that policies such as fiscal incentives
M ar ket s h ar es [ % ] PHEV BEV Year
are implemented to counteract that. The policy itself must be long-term because converting to a zero-emission car fleet will require political perseverance over several decades. Sierzchula et al. (2014) confirmed this in their research, claiming that there is a significant relationship between fiscal incentives and EV adoption. In addition, Sierzchula et al. (2014) and Nilsson and Nykvist (2016), found a clear relationship between consumer adoption of EVs and them being produced by native firms. One native car manufacturer in Sweden is Volvo and they have a large market share; in fact, they continue to be the bestselling brand in Sweden. Volvo is a car manufacturer with an established identity and a sense of strong association with current norms in society regarding what an automobile is and how it ought to be used. Understandably, there is a reluctance to change an entire culture of car making. Hence, the absence of native manufacturers attributes to the currently low BEV adoption rates in Sweden. (Nykvist & Nilsson, 2015b)
1.1.1
Swedish Electricity Production
In Sweden, Hjalmarsson et al. (2011) state that the generated power is very reliable with few interruptions and it is independent from other nations electricity supply. This implies that an electrified transportation in Sweden will not be so sensitive to geopolitics.
In the Nordic region the electricity demand for electric cars only account for less than 1% of total electricity demand in the region. The power grid in these countries is resilient enough and designed to operate and meet demand across nations even with extreme winters. The minor share of power required for recharging EVs has not yet caused a significant issue for the electricity distribution networks. (IEA, 2018)
With zero-tailpipe emissions, the primary energy sources used for electricity generation largely determine the GHG intensity of electric vehicles. Since BEVs can be charged with electricity generated from energy sources that emit large amounts of GHGs, the emissions of air pollutants will increase at the site of the power plants, while the emissions of road pollutants will decrease. (Buekers et al., 2014; IEA, 2018) Thus, for BEVs to truly be a green alternative, a cleaner electricity production mix for charging BEVs is required. The health and environmental benefits are strongly correlated to the type of energy mix for electricity production that is present (Nykvist & Nilsson, 2015; Ayalon et al., 2013). Hawkins et al. (2013) argues that it would be counterproductive for the climate to promote BEVs in certain regions where the electricity is produced mainly from fossil fuels.
The climate footprint of increased electricity usage caused by BEV market uptake is a central issue. For instance, in Norway it was much easier to initiate the electrification of the car fleet since their energy production is virtually 100% renewable (hydropower-based electricity system). Also, in discussions regarding the expansion of BEVs, often the power market impact is claimed to be a strong barrier. However according to Fridström and Östli (2017) this issue should not be overstated, they state that only 6% of Norway’s domestic hydropower output would be enough to operate their entire passenger car fleet, if it was electrified. Naturally, in their case it is more favorable to electrify transportation since its impact won’t damage the environment because of their renewable grid energy source.
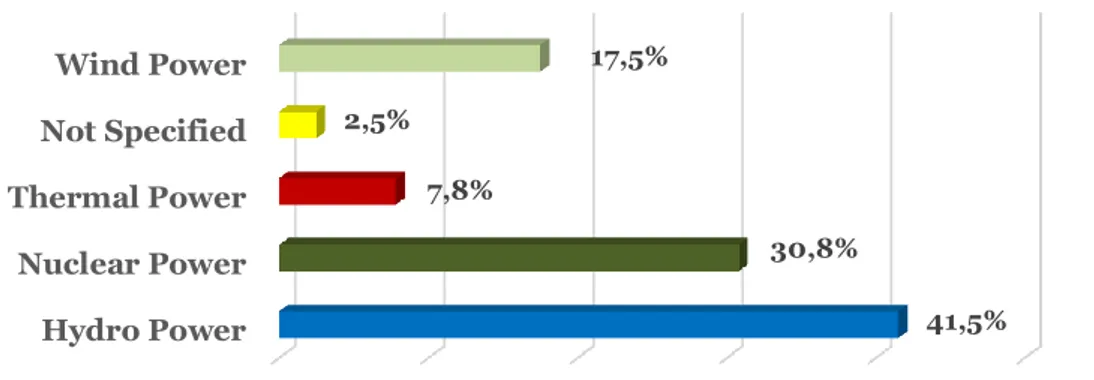
Today, Sweden’s electricity production mix serves as a potential driver for BEV uptake. The importance of fueling BEVs with electricity from clean energy sources is extremely important for the environment but also to the consumer. Figure 2 shows Sweden’s current electricity production mix which has the potential for quite a favorable situation for electrification of the car fleet. The high utilization of hydro- and nuclear power contributes to Sweden’s low fossil usage for electricity production (Svenska Kraftnät, 2019; Energimyndigheten, 2019).
Figure 2 Sweden’s electricity production mix (Data: Svenska Kraftnät, 2019)
According to Dushku and Ekholm (2019) the electric grids are often separated into transmission grids and distribution grids. In Sweden, the categories for electric grids are transmission grids, regional grids and local grids. Figure 3 shows how electricity is transferred from production to the end consumer. This thesis focuses on the local and low-voltage grid, since it distributes electricity to end consumers that are households.
Figure 3 Overview of the Swedish electrical grid – Production to end consumer (Nordling, 2016)
1.1.1.1.
Mälarenergi – Local Electricity Provider in Västerås
The city-owned electricity provider in Västerås is Mälarenergi which distributes roughly 1900 GWh electricity through its electricity network (Mälarenergi, 2019a). Their mission is to actively act upon and strengthen Västerås’ development. They achieve this by offering a variety of services from energy, water and communication (Mälarenergi, 2018a; Mälarenergi, 2019b). They have over time evolved from a supplier of energy and developer of infrastructure to an infraservice company. Figure 4 is a portrayal of Mälarenergi’s operational area, covering the Mälardalen region. From their annual report Mälarenergi (2018a) it is stated that the company produces electricity and district heating in the power plant in Västerås. In addition, they have production of district heating in Hallstahammar, Kungsör and Surahammar. Through a subsidiary called Mälarenergi Vattenkraft AB, they produce electricity from 41 hydropower stations (Mälarenergi, 2018a).
Hydro Power Nuclear Power Thermal Power Not Specified Wind Power 41,5% 30,8% 7,8% 2,5% 17,5%
Figure 4 Mälarenergi's electricity network area (Mälarenergi, 2019a)
According to an annual sustainability report released by Mälarenergi (2018b) they have outlined future goals for the year 2030. These targets consist of strengthening the infrastructure and adapting industries to make them more sustainable with more efficient resource management and several environmentally friendly technologies. Furthermore, they also aim to significantly reduce cities negative impacts on the environment by increasing the share of renewable energy sources. In the report Mälarenergi (2018b) they state that electricity will be an enabler for a reduction in climate influencing activities from transportation. It is identified that as society moves towards electrification, the demand for electricity and the risk of power shortages increases.
As of 2016, Mälarenergi started an initiative called ‘Laddregion Mälardalen’ which represents their efforts for a more developed charging infrastructure for EVs. This indicated the direction towards a greener future where the reduction of carbon emissions is a central issue. The initiative is co-financed by Klimatlivet. (Mälarenergi, 2019c) According to Naturvårdsverket (2018), Klimatlivet is categorized as an investment support for regional and local actions towards combating the carbon emissions which affect the climate. It supports 223 new climate investments which together stand for 256 million SEK. Most of these investments are for new charging stations for EVs. In total, Klimatlivet has contributed with 14 000 charging points (Naturvårdsverket, 2018).
1.1.2
BEV’s Electricity Usage
A large portion of the literature surrounding BEVs is comprised of research on overcoming technical barriers, Wu et al. (2015) state that focus has been placed on investigating battery technology limitations and charging infrastructure. Comparatively, there is a lack of studies regarding how to improve the efficiency of the EV transportation system. Wu et al. (2015) argues that one reason this has not been emphasized more is because the EV trend has not been correctly foreseen, instead its been quite underestimated. As the trend is escalating in momentum, measuring and estimating EV’s electricity usage is fundamental to improving energy efficiency (Wu et al., 2015).
A large BEV diffusion with rapid growth can be threatening and prove to be a challenge in electric energy generation. According to a simple example provided by Chang et al. (2014) a BEV driving 18 129 km/year consumes electricity equivalent to 74% of the total residential electricity usage per person in the US. Meaning, when 70% of passenger vehicles become BEVs there will be an additional 27% nationwide electricity generation needed to power the vehicles. By identifying the distinctive features of EVs and their drivers, Wu et al. (2015) claim it will allow for a better control of energy consumption and efficiency. Knowledge of this could potentially alter how EVs are utilized and enhance our understanding of people’s travel habits and driving behavior. The importance of this is underlined by Kraschl-Hirschmann and Fellendorf (2012) who imply that energy consumption is highly influenced by route choice. This report continues on previous research regarding energy consumption by applying an energy consumption model that aims to investigate to what degree a large diffusion of BEVs will impact the electricity grid, particularly in residential areas in Västerås Sweden.
1.2
Purpose and Objective
The objectives of the master thesis are:• Investigate trend forecasts for year 2030 regarding the diffusion of EVs.
• Determine the impact of BEVs on the local power grid in residential areas in Västerås. Specifically, identify the additional load on the power grid and show how it will affect the electricity demand during peak hours.
1.3
Deliverables and Research Questions
The deliverable of the master thesis consists of an outlining and answering to the following questions:
1. What are the driving forces for an accelerated expansion of EVs in Sweden?
2. How can you construct a model which is valid for any battery electric vehicle’s electricity consumption, in order to identify the required energy when driving a specific distance?
3. How will the additional electricity load of BEVs impact the load profile of households, in particular, during the peak hour of electricity demand in Västerås?
1.4
Delimitation and Boundaries
Due to the vastness of research which can be conducted when investigating BEVs and their impact, this master thesis outlines some boundaries to the research area.
• In the literature, prior studies are to a high degree considering both BEVs and PHEVs in their research. However, in this paper, no consideration will be made for the PHEVs, mainly because BEVs will require a much higher electricity demand and their diffusion is expected to surpass that of the PHEVs.
• Infrastructural improvement to the distribution network in Västerås might be necessary in the future, due to the increasing diffusion of BEVs. However, this degree project will not focus on the economic aspect of their impact on the local power grids, rather investigate the technical implications.
• While the report investigates BEVs impact on the local power grid in Västerås, focus has been placed on two residential areas and how BEV charging will affect their load profiles.
• The proposed model for estimating power and electricity consumption of BEVs will apply an analytic description of the relationship between power, velocity, acceleration and grade. In other words, the underlying theory of vehicle dynamics is applied to the calculations.
2
METHODOLOGY
This chapter reflects on the methods used to investigate BEV diffusion and its impact on local power grids. An important distinction, mentioned in the delimitations, needs to be made since the term EV, in the literature, can refer to plug-in hybrid electric vehicle (PHEV) and battery electric vehicle (BEV). This report will only model and test the challenges with BEVs. To achieve this, an extensive literature study was undertaken. The intent here was to provide an in-depth review of the available literature to capture the scope of the debate on BEV diffusion. Prior studies, regarding estimation models of the power input of an electrical engine and the resulting energy consumption, were reviewed and their results were compared to actual measured values. Here, a comparison is also made of the different ways one can achieve an implementable power estimation model. The modelling occurs in the Excel environment were equations supported by the literature were implemented and results could be compiled and illustrated in the form of graphs and tables. Excel is a software developed by Microsoft which utilizes spreadsheets, it features calculation, graphing tools, pivot tables and a macro programming language. The reason behind working in Excel rather than other computational environments like MATLAB lies in the stronger familiarity with the programming language applied in Excel. Compiling data and implementing equations proved to be easier and more manageable.
2.1
Data Sources
A lot of research has been done in the area of weak signals related to trends. The report by Hiltunen (2008) defines weak signals as everything and anything that is related to substantial or potential change in the future. Hiltunen (2008) focuses on the source of weak signals and aims to investigate which are deemed to be trustworthy and of good origin. One of the main findings suggest that ranking of good sources depend on the area of life you are looking at. The top sources of weak signals are according to the study:
• Scientist/researchers. • Futurists or colleagues.
• Academic and scientific journals. • Reports of research institutes.
Therefore, the exemplification of this master thesis’ research relies on a foundation of academic databases such as ScienceDirect, Google Scholar and Web of Science. In these databases a range of keywords were deployed to find information which closely matched our research problems. These included, battery electric vehicle, range anxiety, lithium-ion batteries, consumer perception, power grid, charging infrastructure, power models and electricity consumption.
Furthermore, consumer surveys from prior studies and research institutes were reviewed regarding travel habits and driving cycles of individuals. These travel surveys extend from the year 2009 to 2019 and investigate consumer behavior both locally in Västerås and in other
nations worldwide. It allowed for a fair estimation of how BEVs are driven (on a daily basis) and in what capacity their range capability is employed. A Swedish national travel survey answered many questions regarding the daily distance travelled per person. It strongly supported findings from other consumer surveys, which in turn represented the basis for assumptions implemented in the modelling case.
Additionally, through contact with project manager Giorgios Foskolos at Mälarenergi, it was possible to acquire electricity consumption data for the residential areas which are investigated. The measurement points of the electricity consumption data are shown in Appendix 2. Moreover, Giorgios Foskolos also provided battery charging profiles of the most common BEVs in Sweden today, found in Appendix 1. On two occasion a semi-structured interview was conducted with Mälarenergi grid planner Anders Malmquist. From this contact the complexity of the power grid in Västerås was discussed in detail and from the perspective of an expert in the field. However, the request of sensitive information from Mälarenergi regarding the network grid and power capacity in transmission lines was duly denied in accordance with their policies.
2.2
Trendspotting and Backcasting
In a study by Kuosa (2010) a framework is discussed concerning the separation and categorization of weak signals, drivers, trends and other types of information attained from trustworthy sources. The tool which allows this is called FSSF meaning ’future signals sense-making framework’. Its philosophy is based on the principles of environmental scanning and pattern management, which state that if there is a big transformation process on the way, then it will be reflected in numerous ways. The argument made by Kuosa (2010) is that pulling and pushing drivers, demands and seeds of change have been mixed together too frequently. Instead, all pieces of information relevant to the theme under research can be separated into various categories. The idea is, if you can place a piece of information to one or two of the categories, it means that the person has been successful in locating certain fundamental aspects of the theme. These groups of information give a clear distinction between what is a disruptor or promotor to change, which in turn allows for a deeper analysis of a trend in general, but also makes the forecasting much easier.
In future oriented studies, it is also possible to implement a predictive methodology. In this regard, forecasting is a powerful tool to investigate trends and their developments in the future. On the other hand, backcasting theory utilizes a more normative style of study. Its method can be explained as a development of scenarios for the exploration of the feasibility and implications of achieving specific end points (Robinson, 2003). The popularity of backcasting arose from energy studies by Amory Lovins in 1977, where the oil crisis increased the necessity for a new way of planning in regard to the energy demand and its calculation ahead in the future. The distinguishing characteristic of backcasting analysis, outlined by Robinson (1982), is not concerning as much with likely energy futures, rather how desirable futures can be attained.
According to Dreborg (1996), backcasting can be perfectly utilized as a planning method when the problem under investigation has the following characteristics:
• Highly complexity across multi levels in society.
• Necessity for major change, but current projections prove insufficient in achieving that. • Scenarios in which dominant trends are part of the issue.
• The problem in question is greatly affected by externalities not accounted for in the market. • Possibility for deliberate choice or action over a longer time horizon.
With this information in mind, this master thesis implements a framework of thinking which is closely aligned to both the FSSF philosophy and backcasting methodology. It has allowed for a deeper understanding of the identification of trend signals and the development of future scenarios. The forecasting of BEV diffusion was extensively covered in section three of the report.
2.3
Model Implementation
As mentioned, the modelling took place in the Excel environment. Through the application of knowledge and studies on vehicle and mechanical dynamics it was possible to construct a power estimation and electricity consumption model. It was found that power estimation is hugely related to three defining resistances, namely rolling, aerodynamic and grade resistances, respectively. These had a dependency on the vehicles frontal area and weight. In addition, these resistances were highly dependent on the acceleration and velocity of the vehicle. Therefore, since this thesis work does not utilize real time driving data from tracking tools such as GPS, we relied on reasonable assumptions found in prior studies. In reality, a driven trip should be separated into phases of a driving cycle, to properly investigate velocity and acceleration. However, it would require the vehicles being driven a specific route, which is an unreasonable assumption in the modelling case. Urban driving consists of multiple possible routes taken by individuals, because of this, acceleration and velocity were given average values.
Calculations also accounted for ambient temperature which affects the energy usage of BEVs. A study by Smedh (2017) used weather data for the city of Umeå in Sweden, to arrive at an average value for a monthly coefficient which related electricity consumption to ambient temperature. The modelling case in this thesis work utilized this monthly coefficient.
3
FORECASTING THE EV EXPANSION IN SWEDEN
The electrification of Sweden’s car fleet is in the early stages facing many barriers. Nykvist and Nilsson (2015b) argue that the dominant technological regime has a tight grip on the development of BEVs. Another way of understanding the expansion of BEVs in Sweden is through diffusion theory, popularized in 1962 by American sociologist Everett Rogers. As previously stated, Sweden is in the early stages of BEV adoption, the diffusion of innovation theory labels this phase ‘the early adopters’. In this phase people have let the innovators, whom are the risk-takers, introduce the product and give it some market acceptance in order for the early adopters to capitalize on this and push the innovation to achieve critical mass. (CFI, 2019; Safari, 2018)
Figure 5 The five adopter categories of diffusion of innovation theory (CFI, 2019)
In Sweden, it is expected that by 2024 the number of EVs in traffic will have risen to around 750 000 (Power Circle, 2018). Another scenario predicting the EV uptake suggest that approximately 10% of all driven kilometers in 2030 will be fueled by electricity. (Trafikverket, 2018)
Figure 6 The prognosis of EV ownership in Sweden (Power Circle, 2018)
According to the Swedish Energy Agency (2009) the number of EVs in traffic in Sweden is strongly correlated to the current incentive programs, developments in technology and charging infrastructure. They forecasted three different scenarios, Mid-Range, High-Range
Adoption rate
Time
PHEV
BEV
and Extreme-Range which are shown in Table 2. Currently, we are hovering around the Mid-range scenario if look at data provided by Power Circle (2018). While, the EV stock has been steadily increasing since 2010, it’s only in the last part of the decade where BEV expansion has gained momentum (IEA, 2019). Another study by the Swedish Energy Agency (2017) credits this to the gradually increasing public awareness of the technology. In the survey, they also found that 70% of respondents expressed a positive attitude towards electrification of transportation.
Table 2 Market developments of EVs (Swedish Energy Agency, 2009)
Number of EVs in the Swedish car fleet
Scenario
Year 2010 2020 Year 2030 YearMid-Range
Slow development in incentive programs. Driven eco-friendly force, the life cycle cost of ownership for EVs is on par with ICEVS by 2015.
800 125 000 650 000
High-Range
Charging infrastructure has been widely developed in cities, suburbs and smaller towns. The life cycle cost of ownership for EVs is on par
with ICEVS by 2015. Battery leasing is becoming a viable option.
800 240 000 1 780 000
Extreme-Range
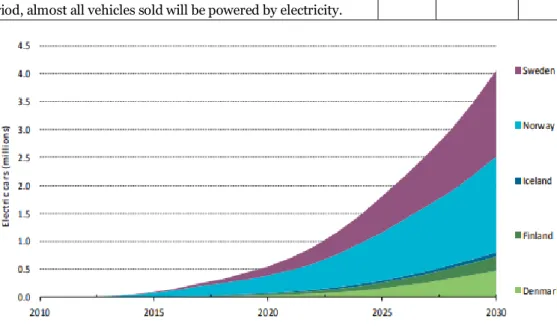
The demand for EVs has exploded and in the short-term is only limited due to lacking availability of vehicles. At the end of this period, almost all vehicles sold will be powered by electricity.
800 480 000 3 270 000
Figure 7 Outlook for electric cars in the Nordic countries to 2030 (IEA, 2018)
The IEA (2018) forecast a Nordic EV fleet of approximately four million until 2030, with Sweden having about 1.5 million EVs. It can be deduced that the most likely scenario for the EV expansion lies within the High-Range scenario, taking into account the existing decarbonization goals and climate ambitions, level of EV deployment and announced policies (IEA, 2018). As we start moving towards the High-Range scenario, it’s important to cover the factors influencing a potential faster growth, such as the one seen in the Extreme-Range scenario.
3.1
Trend Signals for an Accelerated BEV Expansion
The diffusion of BEVs is related to numerous factors, many of which can be promoted through policies and initiatives that put these vehicles into the public eye. This is necessary to increase awareness of the technology but also for educational purposes as well. (Berkeley et al., 2017) According to Wikstrom et al. (2016) great emphasis needs to be placed upon breaking down operational barriers, these are related to consumer’s lack of confidence in unfamiliar technology and poor education regarding range capabilities. Very limited exposure to BEVs contributes to slow proliferation of knowledge and awareness. Unfortunately, this further fuels misconceptions of what BEVs have to offer and how they can be utilized. (Berkeley et al., 2017) Strategic futures research is a tool applied in forecasting different trends. It is discussed by Ruff (2006) and stated that its application in the transportation sector has been valuable since it helped identifying opportunities and risks. Normally, any future-oriented business plan’s success is measured by how well it pays off in the future. In the automotive industry, this is especially the case, where units of vehicles sold dictates the success of the company. Ruff (2006) continues by arguing that the changes in transport and in vehicle markets are shaped by so called mega-currents, i.e. by political, economic, infrastructural, social and cultural conditions.
According to Vassileva and Campillo (2019) the level of BEV market uptake is strongly dependent on the consumer acceptance. This is tied to potential changes in travel behavior, governmental support and environmental and economic concerns. Furthermore, consumer perception also plays a vital role in the diffusion of innovation. Emerging technologies often face unfair barriers connected to the perceived value they offer. They are generally, quite poorly compared to existing dominant designs in criteria such as price and performance (Sierzchula et al., 2014)
Serradilla et al. (2017) supports this claim by stating that consumers perception of operational limitations such as range and the need for education about how and where to recharge certainly affects their investment decision. The best way to shatter biases and alter perceptions is through education. According to the study of Larson et al. (2014), consumers with experiences or some exposure to BEVs were more assertive in their purchase decision. In most cases these individuals even show a greater willingness to pay a premium for BEVs.
3.1.1
Developments in Battery Technology
Electric vehicles entered a new era when lithium-based batteries were introduced. The new technology had high energy- and power density, it was non-toxic and capable of accepting fast charge. Lithium-based batteries came to dominate new and modern BEVs such as Nissan Leaf and Tesla Model S. Now, to further ensure BEVs competitiveness it is crucial to continue improving technologies which will drive prices down and offer improved performance (Yong et al., 2015).
In a report published by Trigg and Telleen (2013), on behalf of the International Energy Agency, they estimated that BEVs would be on par with ICEVs when the cost of Li-ion battery
packs dropped to $300 per kWh. Other studies find similar target costs of $400 per kWh but are dependent on fuel prices being on a certain level. However, in these types of scenarios there are large uncertainties and empirical research has found no correlation between fuel prices and actual BEV uptake. (Nykvist & Nilsson, 2015; Sierzchula et al., 2014)
Furthermore, the commonly considered point at which BEVs become cost competitive with ICEVs, is when the cost of battery packs falls to between $125 and $150 per kWh (Nykvist & Nilsson, 2015; UCSUSA, 2018). Recent surveys show that we are well on our way of reaching that target, perhaps faster than what was initially anticipated. In fact, the volume weighted average battery pack dropped 85% in cost between 2010 and 2018. (Goldie-Scot, 2019)
Figure 8 Lithium-ion battery price survey results: volume-weighted average (Goldie-Scot, 2019) In 2010, battery packs cost an estimated $1 000 per kWh. Depending on car manufacturer the battery packs in 2018 cost between $190 per kWh and $205 per kWh (UCSUSA, 2018).
Figure 9 Lithium-ion battery price outlook (Goldie-Scot, 2019)
Future projections, based on the relationship between price and volume and the battery demand, suggest an expected price of the average battery pack to be below $100 per kWh by 2024 (Goldie-Scot, 2019).
In addition to dropping battery prices, there will be a massive increase to the supply. According to the IEA (2019), approximately 70 GWh of battery cells were produced in China in 2018 and accounted for over 50% of the global market share. Now, numerous producers have made announcements regarding an increase in manufacturing capacity. Approximately 358 GWh/year will be added to the global supply between 2020 and 2025. By 2023, eight plants with a capacity of more than 20 GWh/year will be in production. In the long term, even plants with a capacity of 100 GWh/year have been discussed. (IEA, 2019)
Table 3 Announced battery manufacturing facilities (IEA, 2019)
OEM Country Announcements Date
Panasonic United States 35 GWh/year Factory in 2020
CATL
China 24 GWh/year & 18 GWh Factories in 2020
EU 14 GWh/year Factory in 2021
98 GWh/year N/A
BYD
China 24 GWh/year Factory in 2019
20 GWh/year & 30 GWh/year Factories in 2023
10 GWh/year N/A
LG Chem EU 15 GWh/year Factory in 2022
China 32 GWh/year Factory in 2023
SK innovation
China 7.5 GWh/year Factory in 2020
EU 7.5 GWh/year Factory in 2021
United States 9.8 GWh/year Factory in 2022
LIBCOIN/BHEL India 30 GWh/year Factories in 2025, 2026 & 2027
Samsung SDI EU 1.65 GWh/year Factory in 2020
Northvolt EU 32 GWh/year Factory in 2023
Lithium Werks China 8 GWh/year Factory in 2021
Terra E EU 4 GWh/year Factory in 2020
3.1.2
Financial Mechanisms
Studies have supported the hypothesis that one major barrier to the uptake of BEVs is consumer concerns about the financial benefit (Dumortier et al., 2015; Berkeley et al., 2017). In fact, without subsidies there are few economically viable options (Letmathe & Suarez, 2017). It is well documented that in the Nordic countries, policy support has significantly influenced EV adoption. The most successful driver has commonly been measures that reduce the purchase price. In the early stages of EV market development it is crucial and indispensable to have policy support to enable market growth. That way it encourages uptake by making the vehicles more appealing for consumers and increasing consumer acceptance. (IEA, 2018) Bridging the cost gap between EVs and ICEVs plays a critical role in the development of electric mobility. It will be necessary for as long as it takes to make EVs cost competitive. Harryson et al. (2015) states that Sweden is one of the worst countries in Europe to create financial incentives to promote the purchase of BEVs and that it’s reflected in the sales figures. Figure 10 portrays the connection between EV density and fiscal incentives. In the case of Norway and the Netherlands regarding BEVs and PHEVs, respectively, massive changes where incentivized and it exhibits increased market shares.
Figure 10 Increased market shares of EVs due to financial incentive programs (Mock & Yang, 2014) In Norway, some of the advantages that BEV owners get is exemption from value added tax (VAT), vehicle purchase tax, exemptions from parking charges and fees for bridges and charging stations (Harryson et al., 2015; Fridström & Östli, 2017). In addition, another policy which had a severe impact on Norwegian car buyers was the introduction of the CO2 tax
component in 2007. Consequently, between 2006 and 2016, the mean type approval rate for CO2 emissions among new petrol and diesel cars registered in Norway dropped by 45 and 26
per cent, respectively (Fridström & Östli, 2017).
Comparatively, Sweden is not even close to the level of promotion which Norway has displayed. As of July 2018, the Swedish government decided upon the introduction of a so-called bonus malus-system. According to Transportstyrelsen (2019) cars with low emissions (up to 60 g/km) receive a maximum bonus of 60 000 SEK. This means that cars with zero emissions get the full bonus. In this new system, transportation vehicles are also eligible to receive the bonus. Furthermore, new gasoline and diesel-powered vehicles put into traffic from 2018 or later must pay an increased vehicle tax during the first three years. According to data from Power Circle (2018), when this new system took effect in July of 2018, there was a record increase of 2 171 rechargeable vehicles in traffic. Evidently, some form of financial incitement does yield desirable results, in fact the monthly average increase of electric vehicles has been higher since the implementation of the bonus-malus system (Power Circle, 2018).
However, a previous study by Vaghult (2019) found that the Bonus-malus system fell short of being a true cost-efficient and fair policy for emission reduction. While the fiscal support is an incentive which has proven to work to a small degree, it is not sufficiently encompassing and thus leads to dismal results. A strong standpoint made by Vaghult (2019) implies that the policy is too simplistic and fails to account for the lifecycle perspective and the importance of the used car market. This severely limits the Bonus-malus system’s possible beneficial effects. Furthermore, the author indicates that the findings and conclusions made in the study could have been identified prior to the implementation of the policy due to the significant amount of research being available at that time.
3.1.3
Social and Consumer Perception
Awareness of financial incentives is important and Haddadian et al. (2015) states that communicating these mechanisms to the consumers will increase their inclination to purchase EVs. Stated by Krause et al. (2013), many potential EV consumers are unaware of state or local incentive programs, meaning they miss out on opportunities which can be advantageous. Previously discussed innovative marketing strategies in Norway clearly affect adoption rates and by familiarizing consumers with EV technologies, their beneficial characteristics can influence people’s misconceptions.
It is understood by Haddadian et al. (2015) that societal obstacles serve as strong challenges in the diffusion of BEVs. These are critical to asses to achieve a widespread market success. Social skepticism is a barrier that must be overcome, and people’s attitudes need to be altered regarding what an automobile is and how it ought to be used. Haddadian et al. (2015) continues by arguing that the auto industry and governments can eliminate the perception gap by enforcing public education programs. Furthermore, the currently weak EV model diversity displays functionalities and features which are not suitable for all car owners. Over time there will be a larger pool of EVs to choose from which will excite all segments of potential consumers.
While Letmathe and Suares (2017) state that BEVs in their current format are mostly suitable for low mileage, occasional drivers. Egbue and Long (2012) argue that, generally, a greater range capability is more desirable. At the same time, there is a discrepancy between individual expectations of BEV’s range and reported daily driving distances. A misconception seems to be that all potential buyers need expensive and large batteries. In fact, short-range BEVs could very well suffice for a significant fraction of the population (Pearre et al., 2011). However, battery sizes not only constrain which trips BEVs can make but also raise “range anxiety”, both of which affect BEV adoption significantly (Egbue & Long, 2012). Range anxiety is prominent in the literature surrounding BEV expansion and it is often stated as one of the major barriers to adoption (Noel et al., 2019; Bonges et al., 2016). As the term suggest it is the fear of being stranded due to insufficient range to reach a desired destination (Egbue & Long, 2012). Today, Noel et al. (2019) argues that the BEV still suffers from technical limitations which contribute to the range anxiety. This is the technical component to the phenomenon which in turn reflects the BEVs shortcomings in performance. The psychological aspect can be translated to a fear, rather than a technical barrier. The best way to ease the feeling of anxiousness is to expose consumers to BEVs and educating them about their range capabilities. (Noel et al., 2019; Haddadian et al., 2015) Empirical research finds that the demand for public charging declines over time as confidence in BEV range increases with experience (Nilsson and Nykvist, 2016).
4
THE ELECTRICITY DEMAND OF BEVs
As BEV deployment increases, so does the concern about charging a vast electrified car fleet. The discussion is aimed towards the interconnection of BEV fleets to the power grid and the impacts that can be expected. The past decade, there have been studies conducted across the world that aim to investigate this problem. The research of Yong et al. (2015) contributes to the conclusion that BEV deployment will affect the load profile of power grids, since they function as additional loads. In a report by Van Essen and Kampman (2011), commissioned by the European Commission it is stated that the total increase in the electricity demand caused by an EV diffusion process in Europe will be relatively small. It is understood that a complete electrification of the transportation fleet would only result in an additional demand between 10-15%. Likely, this additional demand could be covered by the generated capacity, at least in the short to medium term. In 2019, the demand for electricity for all types of EVs was 74 TWh, by 2040, this number will have risen to 2 333 TWh (BloombergNEF., 2019).
Varying battery ranges of BEVs certainly impacts charging behaviors and electricity load profiles differently. It is vital to identify range needs at the individual level because it enhances our understanding of both the environmental and the electricity grid load impacts. Nevertheless, BEVs will require electricity for charging regardless of the battery size. Their energy use will be considerable, for instance, a BEV consuming 20 kWh per 100 km and with a mileage of 15 000 km per year consumes 3000 kWh per year (Langbroek et al., 2017). To put this into perspective, the total household (apartments) non-heating electricity consumption in Sweden is approximately 2500 kWh (E.ON., 2019).
The scenarios which aim to predict the uptake of BEVs in Sweden all point towards a successive introduction (Power Circle, 2019; Nilsson & Nykvist, 2016). It has been predicted that by the year 2030, an additional 2.7 TWh of electricity will be needed to charge all EVs. To put this into perspective, the total electricity demand for Sweden during 2017 was 141.7 TWh (Swedish Energy Agency, 2019). The increased electricity production is marginal to the Swedish power grid. However, on a regional or local level it could be of significance and there might be a need to strengthen the grid beforehand.
The consequences for electricity networks can be anticipated and alleviated. In most nations, the number of EVs are quite limited and so are the impacts on electrical grids, however, anticipating rising EV numbers combined with maintenance and replacement of aged infrastructure could be useful in the future. (IEA, 2018) It is even recommended to network companies to consider installations of cables and transformers with higher capacities to prepare for the inevitably increasing loads (IEA, 2018).
4.1
Implications on Load Profiles in the Distribution Network
Vassileva and Campillo (2017) state that a large penetration of EVs can have an impact on existing electricity consumption profiles, by mainly increasing the peak consumption during the time of day when EVs are being charged. A study by Hartmann and Özdemir (2011) triedto uncover these impacts of EV deployment in Germany. It was found that uncontrolled charging of one million EVs increased the peak load by 1.5% or 0.3 GW. However, if the entire German vehicle fleet was electrified (42 million vehicles) then the energy demand would increase to 38.4 GW, which is substantial compared to 20 GW without EV introduction. Evidently, one million EVs on the roads yields a low impact, however if they continued to increase in numbers then it would be necessary to shift the charging into hours of low national energy usage. (Hartmann & Özdemir, 2011)
Van Essen and Kampman (2011) claim that the large variances in the transmission and distribution grids could be problematic in terms of resilience to external pressures. In the case for uncontrolled charging it can severely impact the peak load and yield a high cost burden. According to Hartmann and Özdemir (2011), uncontrolled charging refers to a situation where the EV is charged when plugged into the grid. In addition, the vehicle will be fully charged with the capacity retained until it is plugged out of the grid. This is important to consider since BEVs will with high probability be charged during residential peak load periods. Van Essen and Kampman (2011) continue the discussion by arguing that countries with well-developed distribution grids are not in risk of experiencing power outages. However, it is on the local or regional level where the uncontrolled charging mostly will have implications on the power grids.
Langbroek et al. (2017) state that in a scenario where all EVs are charged during peak hours of electricity consumption, it would yield significantly higher peak loads. The electricity usage in a normal household is not spread equally throughout the day, instead it has peaks in the early morning and afternoon rush hour. Langbroek et al. (2017) also claim that in between these peaks the electricity consumption is quite low, it’s only after the afternoon rush hour in which the household electricity demand increases. These are the times when household members are at home but not sleeping.
Figure 11 Typical household electricity use in Sweden per person (Swedish Energy Market Inspectorate, 2016)
It is argued by Langbroek et al. (2017) that the dangers of electricity peak hours are the capacity issues which they cause for power plants. These are especially more impactful on local electricity distribution systems. When facing capacity issues, electricity companies are often forced to invest in more infrastructure.
In the study of Vassileva and Campillo (2017) it was chosen to create a simulation model for a residential distribution system. Where the simulation environment was the software known as Dymola/Modelica and the models received validation through measured data. Furthermore, they applied several adoption scenarios with different levels of EV penetration to determine the impact on the distribution grid. Vassileva and Campillo (2017) also introduced some assumptions to their research where they defined the initial state-of-charge of the vehicles to be 50% and that all charging would occur during nighttime. From the results of the study it was concluded that with uncoordinated charging there would be an increase in the peak electricity demand with penetration levels as low as 17%. It was observed that with EV penetration levels over 30%, voltage violations would occur, and distribution losses increased significantly. Another finding of Vassileva and Campillo (2017) was that scheduled charging would be necessary to allow for a large diffusion of EVs, without the need for upgrades to the existing infrastructure.
Figure 12 Increased load with different levels of EV diffusion (Vassileva & Campillo, 2017)
4.1.1
Managing Electricity Loads: Peak Shaving
The IEA (2018) established that in residential areas, the home chargers used for charging BEVs, will add a significant load to the electricity consumption of a household. Without proper management, the growing electricity demand can exceed the maximum power available (in the distribution grid). This becomes more problematic during peak hours and cold days when the grid utilization rate is closer to its capacity. Gann et al. (2018) argues that a higher energy demand brought forth by heating during winter times could lead to higher charging times. There are, however, some ways through which this can be mitigated, and peak loads can be managed.
4.1.1.1.
Smart Grid
Vassileva and Campillo (2017) discussed the impact of different penetration levels of EVs and found that as long as they are properly managed as active components of the whole power grid, they won’t affect the power transmission and distribution system. Therefore, the concept of smart grids has become an advantageous opportunity for optimization and modernization of the power grid. Its usefulness according to Ponce-Jara et al. (2017) comes from the application
of information and communication technologies which are supposed to connect and interact intelligently with all the involved parties in an electric network. It is possible to achieve this since Smart Grid allows for two-way communication between the power supplier and the different consumer types. Ponce-Jara et al. (2017) identifies a shift towards ‘pro-sumption’ because consumers will also be producers of energy and be able to optimize its profile of energy consumption. Combining Smart Grid with the idea of Smart Charging, discussed by Vassileva and Campillo (2017), the advantages increase. Since an EV which is connected to the grid for a recharging event can communicate with the network operator and in return get information regarding the amount of power which can be drawn at any given time. Furthermore, both Vassileva and Campillo (2017) and Ponce-Jara et al. (2017) state that Smart Charging and Smart Grid will stimulate large volumes of renewable energy source into the grid.
4.1.1.2.
Demand-side Management (DSM)
In the Nordic EV Outlook produced by the IEA (2018) the usefulness of demand-side management is discussed. It is identified as an important tool that can reduce the impact of EVs on electricity networks and entirely delay or eliminate the need to upgrade the grid. At the same time, stimulating the implementation of different renewable-based energy sources into the grid. IEA (2018) defines DSM as a combination of activities to manage bulk load shifting through market mechanisms and consumer response to price signals. These two activities are labeled explicit DSM and implicit DSM, respectively.
4.1.1.3.
Temporal Price Differentiation
Langbroek et al. (2017) outlines the usefulness of temporal price differentiation in which people are inspired to charge their vehicle during specific hours of the day to counteract the peak load on the electricity system. This tool will allow for lower prices during the day when there is no peak demand for electricity, while charging consumers who chose to recharge their car during peak hours. Through this application of price differentiation, a more spread-out distribution of daily electricity usage can be achieved. Similarly, it was concluded in research by Schmidt et al. (2014) that charging control systems would efficiently manage peak-shaving and save costs. However, it is important to distinguish the different ways pricing schemes can be applied. There is real-time price adjustments and fixed price differentiation. Langbroek et al. (2017) argues that fixed price differentiation has more advantages by allowing consumers to have more control, since a certain charging time is connected to a certain price, this way they can plan their charging patterns to minimize cost. With direct load control there is no predictability since the electricity is remotely controlled by the electricity company.
4.1.1.4.
Vehicle-to-Grid (V2G)
It is discussed by Noel et al. (2019) how BEVs can offer a benefit to the grid by using their battery as a means of storage. This concept is referred to in the literature as vehicle-to-grid. On average, in the US, the car is parked 95% of the time (Pearre et al., 2011). This means that most of the time there is no need for charging the vehicle. Thus, the vehicle’s electric system remains