Collective Efficacy, Neighborhood and Geographical Units of Analysis:
Findings From a Case Study of Swedish Residential Neighborhoods
1 Collective efficacy theory is based on the notion that residents of a neighborhood may share a common sense of trust and willingness to act for the common good (Sampson et al 1997). It is strongly negatively correlated to fear of crime, disorder and several types of violent crime and as such an important theoretical concept (Sampson et al 2002; Browning 2002; Gibson et al 2002; Ivert et al 2013). But do citizens really feel a common sense of trust and willingness to act within a neighborhood? If so, what is a neighborhood?The main aim of this paper is to develop a deeper understanding of where, and to a lesser extent how, collective efficacy is constructed in space. The present study is to identify the geographical units of analysis that best match resident perceptions of key dimensions of collective efficacy: trust and collective action or informal social control. The analysis is based on semi-structured focus group and key informant interviews with residents, property managers and active members of voluntary associations in four Swedish multi-family housing neighborhoods. Considering the use of qualitative data in relation to collective efficacy is somewhat unorthodox, the results from the qualitative analysis are compared to a more traditional measure of collective efficacy from a survey in the same four neighborhoods. The use of a qualitative approach enables exploratory analysis of the spatial dimension of collective efficacy as perceived by the residents, setting this study apart from the bulk of collective efficacy based studies where surveys are used to measure and analyze collective efficacy (i.e., Sampson et al 1997; Wikström et al 2012; Sutherland et al 2013; Morenoff et al 2001; Gibson et al 2002) or related concepts (Taylor 1997; Bellair 1997; for a discussion see Steenbeek 2011).
1 Parts of these results have previously been submitted in a report (in Swedish) to Länsförsäkringars
forskningsfond and printed in the Malmö University Publications on Urban Studies series (MAPIUS) no. 11. Some results have been published in the NSFK (Scandinavian Research Council for Criminology) seminar report 2012.
Based on a literature review of contemporary criminological studies, at least three different perspectives on the geography of collective efficacy have been identified, in this paper labeled neighborhood, micro-neighborhood and micro-place. We know relatively little about whether all three perspectives on the geography of collective efficacy are as valid from the viewpoint of
residents, and by analyzing open ended interview questions it might be possible to help fill this gap. This paper covers three research questions:
• Which type(s) of geographical unit of analysis matches resident perceptions on collective efficacy best?
• How does narratives of collective efficacy compare to survey data on collective efficacy? • How can differences between geographical units of analysis be explained in the studied
neighborhoods?
The first research question departs from the qualitative material to investigate the geography of collective efficacy, and in the second research question the interview material is compared to survey data on collective efficacy before the final research question is considered mainly in light of the qualitative material. In the following section a brief introduction to the concept of collective efficacy will be given before the spatial dimension of collective efficacy is discussed followed by presentation of research design and results.
Collective efficacy theory
A basic premise of collective efficacy theory is that a large part of the variability in crime between different areas of a city that is connected to concentrated disadvantage can be explained by residents’ “mutual trust and the willingness to intervene for the common good” (Sampson et al 1997: 918; Sampson 2006a). Collective efficacy then is made up of the two components trust (or social cohesion) and willingness to intervene (informal social control or collective action) (Sampson 2012: 152ff; Sampson et al 1997; Sampson 2006a; Sampson & Graif 2009). It is considered to be an important factor to explain neighborhood violent crime rates in the US (Sampson et al 1997: 919). In
a European context, the evidence of collective efficacy in explaining crime is mixed, with some studies showing a very small effect (Bruinsma et al 2013; Sutherland et al 2013) and others showing strong effects (Wikström et al 2012). In part such differences may be related to different sizes of the geographical unit of analysis as suggested by Sutherland et al (2013) and as discussed below. Collective efficacy has both long term effects on socialization and short term effects on informal social control with a high level of social organization through collective efficacy signaling an ability to monitor and intervene against unwanted behavior (Wikström et al 2012: 35; Wikström & Sampson 2003; Loeber & Wikström 2000; Kornhauser 1978: 38-40; Gatti & Tremblay 2007). The short term effect through informal social control affects crime rates through “variation in the abilities of local communities to regulate and control the behavior of their residents and visitors” (Bursik & Grasmick 1993: 24; see also Wikström et al 2012: 34).
Resident social networks are important for the creation of collective efficacy with repeated
interactions emphasized as important for the generation of cohesion among broader sections of the population than among close friends (Sampson 2006b; Sampson 2012). The interaction in turn can largely be explained through community routine activities (Sampson 2006b: 152; Bursik & Grasmick 1993: 89; Cohen & Felson 1979; Felson & Cohen 1980: 394 quoted in Loeber & Wikström
2000).Collective efficacy then is related to, but separate from, network ties. The separation of collective efficacy from the ties in themselves has been argued as important (Sampson 2012; et al 1997) in relation to the distinction made by Granovetter (1973) between weak and strong ties since strong ties are insufficient to achieve “shared expectations for social control and strategic
connections that yield action” (Sampson 2006b: 151). Similar to the distinction between weak and strong ties a distinction can be drawn between instrumental and expressive forms of organization, with instrumental organizations thought to be of greater importance in the context of collective action for the common good of the neighborhood (Swaroop & Morenoff 2006).
The concept of neighborhood
What a neighborhood is, how to define it and what it captures are issues that are widely discussed today and that have been discussed since the 1920’s (Weisburd et al 2009b: 13). At its simplest form an early definition of the concept was “a small homogenously geographical part of the city” (Park & Burgess 1925/1967: 190). In a more modern form Robert Sampson (2012: 54-55) discusses
neighborhoods as socially constructed spatial units of organization that are nested within larger units of organization. Sampson defines the concept as “a geographic section of a larger community or region (e.g., city) that usually contains residents or institutions and has socially distinctive characteristics” (ibid 56). Ideally then it should have some degree of homogeneity and/or reflect social boundaries in order to maintain such socially distinctive characteristics. In essence a neighborhood can be considered a community based on spatial proximity of residents.
Neighborhoods as units of analysis remain important, but recently the importance of the size of geographical units of analysis have been brought to the forefront of the agenda in geographical criminology (Weisburd et al 2009a; Andresen & Malleson 2011; Kennedy et al 2012) and it has been argued that smaller is better (Oberwittler & Wikström 2009; Sutherland et al 2013). Even more recent is the notion of Egohoods, overlapping neighborhoods based on spatial proximity, that have been argued to better represent social reality (Hipp & Boessen 2013: 4; Similar ideas discussed in Brantingham et al 2009: See also Lupton 2003 for a discussion).
Defining boundaries and size of the geographical units of analysis is a difficult problem related to the Modifiable Areal Unit Problem (MAUP) (Openshaw 1996; Tita & Radil 2010; Oberwittler & Wikström 2009; Lupton 2003; Hipp & Boessen 2013). MAUP consist of problems related to zonation, the placement of boundaries between units, and to scale, the size of units (Green & Flowerdew 1996; Oberwittler & Wikström 2009). In this paper the problem of scale is in focus as related to the spatial dimension of collective efficacy.
The spatial dimension of collective efficacy
Collective efficacy theory was developed in the Project for Human Development in Chicago
Neighborhoods (PHDCN) where the main unit of analysis was the neighborhood cluster, constructed by combining two to three census tracts, with an average of 8000 residents (Sampson 2012: 79; see also Loeber & Wikström 1993).2. Neighborhood clusters are created by taking into account
geographic boundaries and census data regarding “racial/ethnic mix, socioeconomic status, housing density, and family structure” (Sampson 2012: 79) to ensure relative homogeneity. On a smaller scale collective efficacy has been successfully applied to geographical units (neighborhoods) in the form of UK output areas with an average of just 300 citizens or 125 households arguing that “large area units cannot adequately represent settings, and therefore the environmental features that directly influence action” (Wikström et al 2012: 90). Similar to the attempts at creating homogenous neighborhoods in Sampson (et al 1997) output areas “are designed to minimize between-output area variation in size, geographical area, and population density, and within-area variation in key social characteristics” (Wikström et al 2012: 88-89). Yet it is noted that output areas are not
constructed to represent communities or neighborhoods. Rather the output area is the environment or activity field that along with other circumstances forms the setting of behavior (Wikström et al 2012: 70). Similarly, US research on collective efficacy, or the underlying mechanisms of cohesion and social control, based on street blocks with a very small population as geographical units of analysis have been performed (St Jean 2007: McPherson et al 1984; same data used in Taylor 1997). Large intra-neighborhood differences between are identified between micro-neighborhoods (street blocks) (St Jean 2007). Taylor (1997: 120) argues that the street block is an important unit of analysis since residents get to know not just each other but in addition each other’s routine activities
evolving shared norms over time. His conclusion is that street blocks are important as a “key
2 Note however that Sampson & Raudenbusch (1999; See also Sampson 2012) elsewhere uses census tracts to study disorder due to acknowledgement of a need for “smallest level of aggregation possible in measuring observed disorder, owing to considerable variability block-to-block within larger ecological units” (ibid: 619).
mediating structure linking neighborhood ecological change and individual and collective responses thereto” (Taylor 1997: 146; see also Hipp & Boessen 2013).
Finally, on an even smaller scale, collective efficacy has been discussed in relation to crime in micro-places, specific locations such as buildings, addresses or street segments, (Weisburd et al 20123; Weisburd et al 2010). Micro-places, or hot-spots of crime, have been the focus of a number of studies showing that crime tends to be clustered at very small geographical units of analysis (Weisburd et al 2010; Weisburd et al 2004; Sherman 1995). Hot-spots of crime tend to be stable over time, but there is often large intra-neighborhood variation in crime which has been argued to show a need to study smaller scales of geography (Weisburd et al 2010: 25; see also Sherman 1995: 46-47; Andresen & Malleson 2011). Although much attention has been given to land-use and to different types of locations in the study of hot-spots (Brantingham & Brantingham 1995; Weisburd et al 2009c; Block & Block 1995), and to crime prevention through hot-spot policing (for an overview see Braga 2007) the concepts of social organization and collective efficacy have been brought to the micro-place agenda as well (Weisburd et al 2012; Weisburd et al 2010). A large variance in collective efficacy between neighboring micro-places has been discussed, and micro-places are indeed
described as communities of key importance to at least the informal social control dimension of collective efficacy (Weisburd et al 2012: 178; Uchida et al 2014). As Uchida et al (2014) note it is however fairly rare for studies to examine intra-neighborhood differences in collective efficacy due to methodological decisions emphasizing inter-neighborhood differences bringing a need to study many neighborhoods rather than to have many respondents within neighborhoods. This has potential implications on our understanding of collective efficacy, but maybe most importantly on how collective efficacy research has been applied in policy discussions with a strong focus on neighborhood or community based interventions.
3 Note that Weisburd et al (2012) measure collective efficacy through voting participation, which could be argued to tap into other dimensions of social capital than collective efficacy.
In practice the boundaries between what constitutes a neighborhood and micro-neighborhood on one hand, and between micro-neighborhood and micro-place on the other hand are somewhat unclear. The micro-place in theory is a very small place, for instance an address or a building, but in practice usually takes the form of street segment. The micro-neighborhood meanwhile is
conceptually discussed as a small neighborhood, and usually operationalized as a street block. The neighborhood by implication is a geographical unit larger than a street block with some socially distinctive character. The operationalizations of these concepts in the present study will be discussed further in the research design section.
In sum then there are three different theoretical-methodological perspectives in which collective efficacy have been applied to space (Table 1), but whether all three are equally valid for the study of collective efficacy remain somewhat unclear. With repeated interactions highlighted as important (i.e., Sampson 2006a; Taylor 1997; Weisburd et al 2012) for the construction of collective efficacy it can be hypothesized that smaller type units should be of greater importance since “we are more likely to have contact with those who are closer to us in geographic location than those who are distant” (McPherson et al 2001: 429; See Logan 2012 for a discussion). Such a hypothesis may also be plausible in light of studies showing that a few micro-places may well be the decisive factor in crime rates for a whole neighborhood (i.e., Andresen & Malleson 2011; Weisburd et al 2012). With collective efficacy hypothesized to have a strong predictive power on neighborhood crime rates and neighborhood crime rates in turn (sometimes) strongly reliant on a few micro-places it would appear likely that collective efficacy operate at the micro-place level as well.
Table 1. Operational definitions of geographical unit of analysis in relation to collective efficacy or similar concepts. Some examples to illustrate differences in geographical unit of analysis.
Sampson et al 1997 Loeber & Wikström 1993 Wikström et al 2012
Taylor 1997 St Jean 2007 Weisburd et al 2012 Geographical concept Neighborhood cluster
Neighborhood Settings Behaviour settings Micro-Neighborhood Hot-spot (micro-place) Geographical operationalization 2-3 census tracts combined (US) Aggregates of census tracts Output Area (UK) Street block (US) Street block (US) Street segment Residents (average) 8000 4000 300 74-89 (McPherson et al 1984)4 57 16
In many neighborhood-based studies the operational definition of neighborhood rest on
administratively defined geographical units (Sampson et al 2002; for examples see Weisburd et al 2009b: 16; Mellgren 2011; Wikström et al 2012: 89-90). Which kinds of administrative units that are used depend in part on availability of data, but to some extent it also departs from theory with three possible theoretical viewpoints identified above, focusing on neighborhoods, micro-neighborhoods or micro-places respectively.
4 No exact number of average streetblocks/area is given, it is only stated that the average number of residents were 2242 with the average number of streetblocks 25-30.
Research design and data
In this paper perceptions of collective efficacy will be examined more closely through a case study of four city areas, an administrative geographical unit of analysis that has been used as operational definition of neighborhood in Swedish studies (see Mellgren 2011 for examples).5 The city areas covered are the multi-family housing areas of four neighborhoods in the Swedish city of Malmö: Kroksbäck, Holma, Bellevuegården and Södertorp (See Map 1). The neighborhoods were chosen based on similarities in their geographical location, clustered in the southern part of the city, and in their residential character with few commercial spaces, limited mixed land-use and large park areas which could have an impact on both collective efficacy (Cohen et al 2008) and on crime
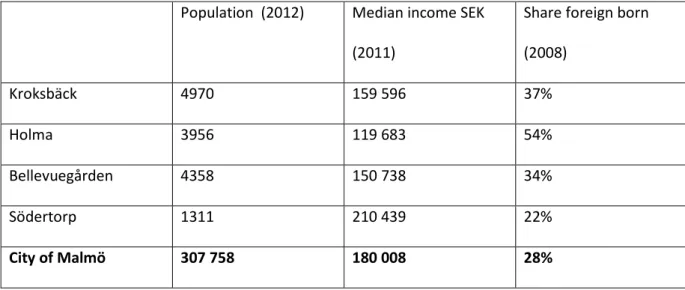
(Brantingham & Brantingham 1995). Three of the neighborhoods have lower income levels and a larger share of foreign born than the city as a whole (Table 2; See also footnote 6).
Table 2. Census data from the studied neighborhoods and the city. Population (2012) Median income SEK
(2011)
Share foreign born (2008) Kroksbäck 4970 159 596 37% Holma 3956 119 683 54% Bellevuegården 4358 150 738 34% Södertorp 1311 210 439 22% City of Malmö 307 758 180 008 28%
The focus of the study was on multi-family housing, and single family homes were not covered nor a retirement home. In practice this mean that a large part of one neighborhood was excluded and a small part of another neighborhood was excluded resulting in a larger degree of intra-neighborhood
5 In the city of Malmö city areas averaged about 2000 residents in the year 2008, or close to 3000 residents if only city areas with at least 500 residents are counted (Malmö stad 2009).
homogeneity. 6 The multi-family housing was all built during late 60s to early 70s and was designed to be free of cars, with entryways leading to parking lots outside of the residential spaces in the neighborhood. This is a significant characteristic in comparison with much of the neighborhood research in the US where streets and street blocks are common concepts (i.e., Sampson & Raudenbush 1999; Weisburd et al 2006; Chainey & Desyllas 2008) which have little meaning in a context of car-free environments. Within and around the neighborhoods there are large green spaces, with parks, playgrounds and sports grounds.
Neighborhoods were divided into smaller, more homogenous and more socially meaningful geographical units of analysis. These smaller units resemble how blocks were conceptualized as micro-neighborhoods in a study that made use of a similar methodology and will thus be considered micro-neighborhoods (St Jean 2007; See also Hipp 2010)7. They were constructed based on data over social boundaries retrieved from key informant interviews with residents, property managers and members of local associations while also taking the physical structure of the neighborhoods into account. The twelve micro-neighborhoods are easily identified on a map with clear lines of
demarcation between them in the form of roads or pedestrian walkways. They differ from US street blocks in that they are not defined by streets since these neighborhoods were designed to be car-free, and in that they are substantially larger in terms of population.
6 Bellevuegården in addition to the multi-family housing area has an area with 102 small houses and two large retirement homes with a total of 419 apartments that were excluded due to the focus on multi-family housing. Kroksbäck in addition has a large small house area with 625 small houses that was excluded. Note that the data in table 2 covers the whole neighborhoods, including single family housing and retirement homes which are excluded in the study. There is no census data available for just the studied parts of Kroksbäck and
Bellevuegården. In this paper when referring to neighborhoods Belleuegården and Kroksbäck it will unless otherwise stated mean the multi-family, non-retirement home areas of the neighborhoods.
7 Note however that the street blocks in St Jean (2007) had a considerably smaller average population, 57, than the micro-neighborhoods in this study. In Hipp (2010) a micro-neighborhood normally consists of 11
households.
Map 1.Top left: Studied neighborhoods, with micro-neighborhoods, streets and bicycle pathways marked out. Note that the map includes parts of the neighborhoods excluded in the study, i.e. retirement homes in the western part of Bellevuegården and small house areas in parts of Bellevuegården and Kroksbäck. Top right: Studied parts of the neighborhoods and micro-neighborhoods with type of property owner. Bottom Left: Micro-neighborhoods and buildings. Bottom right: Zoomed in section of the map showing buildings and yards (micro-places).
In a social perspective about half the boundaries between micro-neighborhoods are soft, signaling small social differences, and the other half hard, signaling larger social differences (Hipp & Boessen 2013). The hard boundaries are between different property manager organizations, i.e. between public and private housing, with attributable differences in SES and other variables attached (See Map 1). The shared property manager area of a neighborhood thus refers to one or two micro-neighborhoods. Any unit of analysis smaller than a micro-neighborhood will in this paper be
considered a micro-place. The most important micro-place unit here is the yard, defined as the common space between two8 or more residential buildings with entrances facing each other. Each micro-neighborhood consists of between three and seven yards, and as semi-public spaces
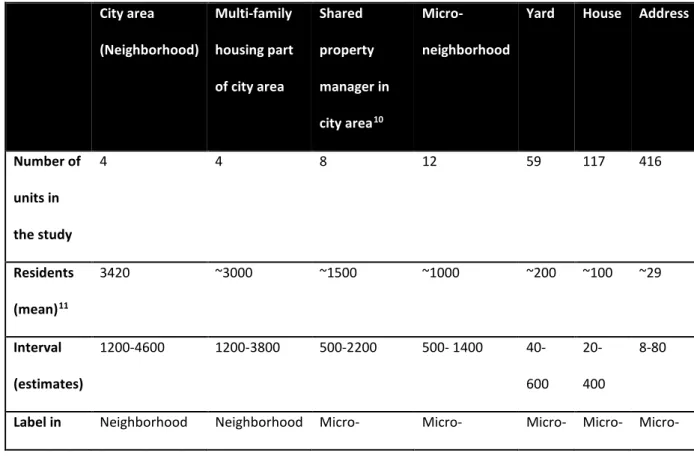
connected to private homes they were hypothesized to be an important socio-spatial construct for everyday interactions between residents. The house9 and street door finally are the smallest units, in a sense not representing a public place since it only comprise of private or semi-private spaces within a building. Most residential buildings studied have two or three stairways of apartments (addresses) and the number of floors varies between three and nine. For the purpose of analysis geographical codes were grouped into neighborhood, micro-neighborhood (micro-neighborhood and property manager) and micro-place (yard, house, and stairwell) as shown in Table 2.
Table 3. Geographical units of analysis in the present study.
City area (Neighborhood) Multi-family housing part of city area Shared property manager in city area10 Micro-neighborhood
Yard House Address
Number of units in the study 4 4 8 12 59 117 416 Residents (mean)11 3420 ~3000 ~1500 ~1000 ~200 ~100 ~29 Interval (estimates) 1200-4600 1200-3800 500-2200 500- 1400 40-600 20-400 8-80
Label in Neighborhood Neighborhood Micro- Micro-
Micro-8 In one case a yard is made up of the space outside the entrances to one building only.
9 Additional buildings may exist on some yards that didn’t fit the criteria of multi-family non-retirement home housing.
10 Referring to multi-family housing part of neighborhood
11 Total number of residents based on data from Malmö stad (2009). All other numbers are estimates since it is unknown exactly how many residents that live in the excluded small house and retirement home parts.
present article
neighborhood neighborhood place place place
Focus group and key informant interviews
Local organizations, both formal and more informal, in the four neighborhoods were identified and contacted to recruit respondents for the study. The majority of organizations are either instrumental organizations relating to housing or more expressive organizations related to a specific culture or language drawing members with foreign heritage. Five focus group interviews with a total of 19 participants drawn from residents based in local organizations, mainly instrumental organizations in the form of tenants associations or tenant-ownership associations were performed. In cases where focus groups interviews were inappropriate, or where the respondent was unwilling, unable or otherwise hindered to participate individual interviews were held. Individual interviews comprised seven residents from local organizations12, two non-residents in local organizations13, ten
representatives of property managers and two representatives of the local municipality. In total there were 40 participants with good knowledge of local social mechanisms (i.e., Pauwels & Hardyns 2009) in the interviews, 29 of which were tied to organizations on the micro-neighborhood or property manager level where most instrumental organizations exist in the studied neighborhoods14. A snowball selection was performed, but only four individuals not already pre-identified were mentioned, two of which were interviewed (included above). The interviews were semi-structured with themes relating to perceptions of the neighborhood, social capital and social networks. Respondents were prompted to elaborate their answers and to explain how they meant. Themes
12 Two from tenant-ownership associations, three from tenant associations, one from self-management, one from a youth center
13 One from a pensioners organization and one from a women’s organization
14 The 11 remaining consist of two representatives of tenant associations organized at roughly half a micro-neighborhood in size, two representatives of self management at a yard, one representative of a youth center, three representatives of pensioneers organizations with neighborhood or city part wide activities, one from a womens organization with city part wide activities and the two representatives of the municipality. The focus on instrumental organizations was in part deliberate in relation to research pointing towards such organizations being of higher importance (Swaroop & Morenoff 2006), but in part it was due to a lack of willingness among contacted representatives of expressive organizations, in the form of ethnic-cultural organizations, to participate in the research.
relevant to this paper involve questions on cohesion, collective action, and social control as well as to differences relating to space or place (See Appendix Table 3 for examples). The length of the interviews varied from about 15 minutes to 2 hours, with focus group interviews taking one to two hours and individual interviews 15-45 minutes. The interviews were recorded and transcribed preserving the original language for analysis. Analysis was performed using Nvivo 9 where all the transcripts were coded according to references made to different types of social capital and different types of geographical units15. For the purposes of this article three types of social capital have been used, cohesion, social control and collective action. Cohesion has been coded when respondents bring up feelings of community, belonging, trust or similar. Social control has been coded when respondents discuss keeping tabs of each other or visitors to the neighborhood, for example in a context of disorderly behavior. Collective action has been coded when respondents talk about organized activities or activities with a purpose of improving the situation for a collective of residents. Coding queries were performed in Nvivo 9 searching for content coded at one of the spatial units micro-place (stairwell/ house/ yard), micro-neighborhood (micro-neighborhood/ property manager) or neighborhood (neighborhood/ city part) including references to collective action, social control or cohesion to represent collective efficacy. Note that when coding the dimensions of collective efficacy as described above every reference to collective action, social control or cohesion was coded, even when the statement was negative or referring to a lack of the phenomenon in question. In order to adjust for references of absent or negative collective efficacy an additional query was performed with a check to remove negative statements on social capital.
Survey and statistical analysis
The survey data was collected in 2012 in participation with the municipality with multi-lingual interviewers knocking doors to perform the survey and non-responding households given a chance
15 In some cases respondents use the word “area” (“område”) which can be interpreted as neighborhood, property manager area or micro-neighborhood. When it is clear from the context in the interview which type of geographical unit that is meant it has been coded, but in most cases these references have been left out. Examples of when it is clear what type of geographical unit that is meant is when cohesion is discussed in relation to a tenant association, in which case the area of operations for the tenant association is the geographical unit.
to respond by mail. A random sample with one address (stairway with residential apartments) from each of the 59 yards in the micro-neighborhoods were drawn, and then an additional 28 addresses drawn randomly from the remaining 357 addresses for a total of 87. On each sampled address every household was included into the sample, and the survey was distributed to one representative of each sampled household. For one address no entrance was obtained and the sample used was therefore 86 out of the 416 addresses in the studied neighborhoods, comprising a total of 1255 households, with a 54,9% response rate (N=689).16 Respondents to the survey are much more likely to be over 60 years old, more likely not to have a foreign born parent, and more likely to be female compared to expected outcomes of respondents from census data for the neighborhoods (See Appendix Table 2). The only difference that is significant is that of age, and it should be noted then that the survey sample reflects the opinions of older sections of the population rather than of the younger residents. Differences in the same direction between census data and respondent
characteristics were recently noted in a large scale criminological survey for the whole city of Malmö (Ivert et al 2013).
The average number of respondents per micro-neighborhood is 56 with a minimum of 30 and a maximum of 106. Collective efficacy was operationalized similarly to Sampson & Wikström (2008)17 with two questions each for cohesion, Would you say people in this neighborhood are willing to help their neighbors? Do you think people living in your neighborhood can be trusted? (Cronbach alpha = .710) and expected social control, Do you think your neighborhoods would intervene if some kids would spray graffiti on a building in your neighborhood? Do you think your neighbors would
intervene if there was a fight in front of your house and someone gets beaten up or get threatened? (Cronbach alpha = .778) where possible responses were graded in likelihood (Always- Usually – Sometimes – Rarely – Never). The combined scale of collective efficacy has a Cronbach alpha score
16 Surveys that were collected by mail in many cases (n=48) lacked a specific address with respondents rather opting to state their micro-neighborhood or neighborhood. Effective response rate where address was obtained is 51,1%, for analysis on the micro-neighborhood level where an additional 41 responses were obtained the effective response rate was 54,3% and on the neighborhood level an additional 2 respondents result in effective responserate of 54.5%.
17 For a brief discussion see Sampson (2012: 163)
of .732 (Appendix Table 1).18 The data was analyzed relative to the three different levels of geography discussed in the present article through calculating ICC values, Aikaike Information Criteria (AIC) and ecological reliability (lambda) with HLM 6 in unconditional models showing how much of the variance that takes place at the different levels of geography, which models that achieve the highest model fit, and separately through comparing mean micro-neighborhood values to narratives of collective efficacy from the focus- and key informant interviews. The number of level 2 units for the neighborhood (N=4) is much lower than recommended (Johnson 2010; Hox 2002; Maas & Hox 2005), and results have to be interpreted with caution.19 They may however in combination with AIC model fit estimates serve to give some indication as to whether the survey data points in the same direction as the interview data.
Results
Which type(s) of geographical unit of analysis matches resident perceptions on collective efficacy best?
In order to explore which geographical units of analysis that best match residents perceptions of collective efficacy the relative and absolute frequencies of three types of geographical units in relation to dimensions of collective efficacy have been examined. The main outcome studied is the number of mentions made of collective efficacy at a specific scale, and the best match will thus be determined based on which type(s) of geography that has the highest frequency. As Table 4 shows the micro-neighborhood was the most referenced type of geographical unit. The neighborhood was mentioned as often as the micro-place in general, but in relation to dimensions of collective efficacy the micro-place was mentioned almost three times as much. On both the micro-neighborhood and the neighborhood level fairly large shares of the references were negative, thus pointing out a lack
18 A total of 600 values for collective efficacy was registered, but incomplete spatial data resulted in a total of 561 surveys including valid values for both collective efficacy and micro-place, 596 for the micro-neighborhood and 597 for the neighborhood. The neighborhood level values are reported in Appendix Table 1.
19 Although Hox (2002) discusses techniques for dealing with ICC-values in relation to a very small dataset with just 5 level 2 units, Maas & Hox (2005) show that level 2 variance components need more level 2 units to become stable.
of collective efficacy on those levels of geography. On the micro-place level however just one negative reference was made, pointing towards more mixed experiences of cohesion and collective action on the larger scales of geography than on the micro-level of geography. An important reason for the micro-neighborhood to be mentioned so often was that many of the key informants
represented organizations active at the micro-neighborhood level, representing formal social network ties (i.e., Hipp & Boessen 2013: 4). Although the organizational focus on
micro-neighborhoods do represent a meaningful social reality the results can be considered biased, and in the last row all references made to formal organizations or their activities have been removed. The remaining references thus deal with general statements about a place and its residents rather than to organizational features. In total 61 references to cohesion, collective action or social control that can be attributed to some type of spatial unit and that are not directly attributed to organizations remain. Only 2 out of those 61 references refer to a spatial unit defined as neighborhood.
Table 4. Interview data with dimensions of collective efficacy on three types of geographical unit of analysis. Frequency (share across all three geographical units).
Micro-place Micro-Neighborhood Neighborhood Total All references 76 (20.3%) 221 (59.1%) 77 (20.6%) 374 (100%) With collective efficacy 33 (21.4%) 109 (70.8%) 12 (7.8%) 154 (100%) Without negative collective efficacy 32 (26.0%) 81 (65.9%) 10 (8.1%) 123 (100%) Without formal organization 27 (44.3%) 32 (52.5%) 2 (3.3%) 61 (100%)
Both of the neighborhood level statements can be questioned in relation to a measurement of actual cohesion in the neighborhood. The first one refers to plans for the future to strengthen the cohesion of the neighborhood through a choir, but as such does not speak of cohesion present at the time of the interview, although it does imply some collective action20. The second one was included since the question mentioned the neighborhood, but it is possible that the respondent interpreted the question as meaning the part of the neighborhood with public housing where she used to live, and where the number of foreign born is higher than in the neighborhood as a whole.21 The quantification of material from focus group and key informant interviews then can be said to show little support for the notion of collective efficacy at the highest level of analysis. Micro-places or micro-neighborhoods are much more commonly referenced. In addition there are large
differences in how collective efficacy, or some dimension of it, is discussed by respondents on the different levels of geography. On the neighborhood level the remaining eight references recorded consist of either cooperation between property managers or agents thereof as examples of collective action (n=2) or of collective action as exemplified by mentions of organizations with members on a neighborhood or city part level (n=6). Furthermore seven of the eight are made by the two non-residents that were interviewed. In summary then there is very little evidence of residents in the studied neighborhoods discussing collective efficacy on a neighborhood wide scale. In contrast many of the references made to the yard or stairwell are very specific regarding
dimensions of collective efficacy present.
20”IP4: Then we thought of something, IP1 and I which we think is fun to strengthen the neighborhood and maybe some
cohesion and a bit of integration. It’s this about a singing choir, but we haven’t gotten there yet, but it is supposed to be like that.” (Focus group 110209)
21”M: What’s the best about living in Kroksbäck? IP: It is close.. There are a lot.. I dont feel like a stranger there, i feel like i
live in Iraq. Many people that say hello to me, that know me, that know my family” (Key informant 110209)
”IP1: Yes, on the floor [there is cohesion]. There are lots of old people that now are retired. We have, we keep tabs on each other to see if something happened or so. You ask, is there anyone that has seen that one, yes I have seen that one then or then. So we do have it [cohesion]. ” (Key informant 110215)
”IP1: But considering we’re [the tenant ownership association] spread out over 51 000 square meters, with 15 house bodies and different yards, on the yards there is a cohesion, but maybe not so much with the next yard on the other side. That yard does something and the next does something else. ” (Focus group 110221)
For the micro-neighborhoods there are some examples of such very specific instances of collective efficacy too:
”IP1: I have to pitch in now, I’ve heard so much about the gangs, the thing is we have a safety walk, and we’re out walking every night. Almost an hour, and we walk the whole area. How many are we now, eight people?” (Focus group 110209)
In other cases the micro-neighborhood examples are more hesitant, signaling there is some cohesion or collective action but that there are obstacles or problems, often related to a lack of people taking an interest.22
In general few of the narratives express strong feelings of cohesion at a micro-neighborhood level. Most of the narratives revolve around mixed experiences at the micro-neighborhood level but stronger experiences of cohesion or collective action at the micro-place level. It seems collective efficacy as described in the interviews mainly take place at a very local level at micro-places, with little evidence of collective efficacy on the neighborhood level.
How does narratives of collective efficacy compare to survey data on collective efficacy?
22 Examples: ”IP3: Yes, i have been thinking a bit over that question. I think, we try, there are a few of us. The tenant
association does quite a lot, one of many. We try, but we are just too few. There is a lack of will and interest. “ (Focus group 110126)
”M: Do you think there is a sense of cohesion or belonging in the area?
IP: Yes, we have that. We do. Unfortunately it is, I have to admit, a bit of a difficulty in reaching the young, those who are active in your age and work. It is difficult. “ (Key informant 110928)
In order to control the results from key informant and focus group interviews the data was compared to survey data on collective efficacy. The narratives of each micro-neighborhood was examined separately and divided into narratives on high and low collective efficacy. The label of high collective efficacy was applied for micro-neighborhoods where examples were given of collective efficacy and/or a sense of community either at the micro-place or micro-neighborhood level. The label of low collective efficacy was applied to neighborhoods where the narrative mainly dealt with problems and/or a lack of collective efficacy. The results were compared to survey data on collective efficacy as shown in Table 4 which also includes type of property manager since that is an important micro-neighborhood attribute.
Table 5. Micro-neighborhoods and collective efficacy. Narratives from focus group- and key informant interviews. Survey data with straight means divided into above and below mean. * = .5 micro-neighborhood standard deviations from mean. **=1 micro-neighborhood standard deviation from mean.
Micro-Neighborhood
Neighborhood Type of property manager
Narrative Survey (Above or below average) Stensjö Bellevuegården Public Low Low*
Delsjö Bellevuegården Public Low Low**
Hålsjö Bellevuegården Private rental High High*
Svansjö Bellevuegården Private rental High High**
Brf Kroksbäck Kroksbäck Tenant ownership High High
Norrbäck Kroksbäck Public Low Low
Sörbäck Kroksbäck Public Low Low*
Holma S Holma Public High Low*
Holma C Holma Public Low Low*
Södertorp Södertorp Tenant ownership High High*
Anneberg Södertorp Tenant ownership High High**
Averages from the survey were lowest in the six public housing micro-neighborhoods which largely correspond to expectations due to the lower SES in public housing.23 It should be noted however that most of the micro-neighborhoods were within a standard deviation from the mean. The narratives largely match the survey data, with the notable exception of the micro-neighborhood of Holma S where the narrative signaled high levels of collective efficacy but the survey showed low levels of collective efficacy which will be further discussed below. A general conclusion that can be drawn is that differences in type of property owner/manager appear to be more important than the neighborhood in itself. All public housing micro-neighborhoods irrespective of neighborhood were registered for below average levels of collective efficacy.
In order to get an alternative indication of the findings differences in collective efficacy was analyzed by calculating Intra Class Correlations (ICC) for the yard (place), the
micro-neighborhood and the micro-neighborhood using HLM 6 and following the example set by Oberwittler & Wikström (2009; See also Pauwels & Hardyns 2009). In empty models the yard and
micro-neighborhood24 recorded 7.7% and 9.2% of the variance at the level 2 unit respectively while the neighborhood had 3.7% of the variance at the level 2 unit (Table 5)25. Similarly the Aikaike Information Criterion (AIC) shows that the model fit is better with smaller level 2 units than with larger ones. The relatively low ICC-values compared to other studies (Oberwittler & Wikström 2009; Raudenbush & Sampson 1999) reflect the high degree of similarity between the studied
23 Although no sensus data or similar is available for micro-neighborhoods estimations based on map data in a 200*200 meter grid of income levels was used to get an approximation of SES in the micro-neigborhoods. The highest percentage of low income households was recorded in the public housing areas with most grids in the 40-60% low income bracket (data not shown).
24 Inclusion of a fixed lvl 2 effect of public housing reduces the ICC for the micro-neighborhood as level 2 to 1.8%, most of the micro-neighborhood variance is thus explained by housing type which includes large variations in SES.
25 Fixed-effect variance in non-hierarchical models with dummy-variables for each geographical unit of analysis yield r square of .162 for micro-places, .090 for micro-neighborhoods and .026 for neighborhoods separately.
neighborhoods, and conversely it would appear reasonable to conclude that the higher ICC-values on smaller scale units reflect a higher degree of internal homogeneity. It should be noted however that the ecological reliability for the yard was very low due to the low number of respondents (see Table 6; and footnote 26).
Table 6. Variance components in empty hierarchical 2 level models using HLM 6 (See appendix for descriptive data on collective efficacy). *** p = 0.000 ** p < 0.01
Units Min- max (mean) respondents Lvl 1 variance Lvl 2 variance ICC Ecological reliability (lambda) AIC Micro-place N=5826 1-35 (9.7) 0.60098 0.05018 *** 7.71% .379 1344 Micro-neighborhood27 N=12 30-88 (49.7) 0.60446 0.06100 *** 9.17% .820 1419 Neighborhood28 N=4 88-192 (149.2) 0.63676 0.02449 ** 3.70% .843 1438
In summary the survey data over collective efficacy give an indication pointing in the same direction as the results of the analysis based on the qualitative material, both in terms of where most of the
26 1 of the 59 yards had no valid value for collective efficacy. The low reliability is a function of the low number of respondents. Excluding level 2 units with less than 3 respondents result in n=52 level 2 units with a mean number of respondents of 10.6, ICC 7.76% and lambda 0.412. Excluding level 2 units with less than 5 respondents result in n=40 level 2 units, mean number of respondents 12.9, ICC of 8.53% and lambda 0.5. Excluding level 2 units with less than 7 respondents result in n=32 level 2 units with a mean number of respondents of 15, ICC of 7.94% and lambda 0.532
27 Excluding the survey responses which were not included for the micro-place level due to missing spatial data results in mean respondents 46.8, lvl1 variance 0.60398, lvl 2 variance 0.05857, ICC of 8.84% and lambda 0.805
28 Excluding the survey responses which were not included for the micro-place level due to missing spatial data results in mean respondents 140, lvl 1 variance 0.63517, lvl 2 variance 0.02933. ICC of 4.41% and lamba 0.856.
variation lies and in terms of micro-neighborhood levels of collective efficacy with the exception of one micro-neighborhood.
How can differences between geographical units of analysis be explained in the studied neighborhoods?
Based on the qualitative material an attempt has been made to understand what factors that may influence the creation of collective efficacy on different levels of geography. Drawing on
respondents’ descriptions on where and why they develop collective action or a sense of cohesion narratives have been examined to determine if there are any common denominators. A key finding is how the everyday life of residents, their routine activities, appears to be linked to the generation of collective efficacy. An example of how routine activities appear to have contributed to the generation of collective efficacy also helps explain the discrepancy between survey data and key informant narratives regarding collective efficacy in one micro-neighborhood that was discussed in the previous section. The discrepancy is explained through large differences in collective efficacy within the micro-neighborhood, and key informants from this micro-neighborhood simply happened to live on a yard where higher levels of collective efficacy were registered.29 The reason for the higher collective efficacy is explained by the presence of self-management groups on two of the yards. Self-management means that the tenants take care of the property themselves rather than the property manager representatives doing it, and as a collective effort to improve and maintain their common space it is in essence the very definition of collective efficacy. Respondents discuss how the daily life routines, or routine activities, along a spectrum from greeting each other to collectively working together for improvement of their yard are what have shaped their strong sense of cohesion and collective efficacy.
29 Survey respondents from the three yards on the northern half of the micro-neighborhood (n=26) are registered for an average collective efficacy that is more than a micro-neighborhood standard deviation lower than the three yards in the southern half of the micro-neighborhood (n=18 respondents).
”IP1: I have to add then that I think it is different. We have self-management up and running here and it creates a strong sense of cohesion for us. We talk to everyone here, so you don’t just walk by without talking and saying hello” (Focus
group110209)
Repeated interactions in the form of greeting and talking to each other as mentioned in the quote above is a recurring phenomenon in relation to respondents’ discussion of how or why cohesion is created. Repeated interactions within the micro-neighborhood in turn partly depend on the physical structure. With each micro-neighborhood having their own parking lot, access road and often bus stop repeated interactions are likely to take place within the micro-neighborhood as well.
”IP: Yeah yeah. On the street here. It was the same that one was over there when I moved here with the boys, you walked down the street, took the bus in the morning. Then it’s just been like that. I had a work colleague who used to come here a lot at night, but he too said that he lives on Sörbäck [neighboring micro-neighborhood] so then you’re there kind of. “(Key informant 110930)
Collective efficacy then is described as a phenomenon that is generated by the everyday life
interactions of respondents in the studied neighborhoods. A sense of cohesion as a common ground for the creation of collective action is built on who the respondents meet and interact with, which in turn largely is based on the social and physical structure of the neighborhoods at hand.
In summary collective efficacy as expressed by key informants in the studied neighborhoods is a very local phenomenon taking place at micro-places or micro-neighborhoods. The neighborhoods mainly appear to be relevant in relation to collective action in the form of formal organizations. Boundaries between different property managers with attached significance of differences in SES are important to explain intra-neighborhood differences, but there exist intra-micro-neighborhood differences attached to social organization as well. Differences between different units of analysis in the studied neighborhoods appear to largely be explained by repeated interactions as part of the routine
neighborhoods point to collective efficacy as more likely to appear on the scale of geography where people’s everyday lives generate interaction.
Discussion and conclusion
This is the first paper within the tradition of geographical criminology that based on a qualitative material explores the issue of geographical unit of analysis appropriate for the study of collective efficacy. The findings largely correspond to how Sampson (2012; et al 1997) present the theory of collective efficacy. Weak ties based on repeated interaction indeed seem to be key, however the implication is that collective efficacy is a very local phenomenon since repeated interactions based on spatial proximity take place in very small geographical units of analysis which are much smaller than how neighborhoods traditionally are operationalized (Also discussed in Uchida et al 2014). This lends support to the argument proposed by Wikström (et al 2012) that, at least in an action context, the units of analysis should be as small as possible. In relation to the questions posed in the
beginning of this paper then it could be argued that residents in the studied neighborhoods show little evidence of a common sense of trust and expectations to intervene for the common good in a neighborhood. If the geographical unit of analysis however is reduced in size, and neighborhood is interpreted as a much smaller space, residents do appear to harbor such feelings to some extent. Since this is a case study of the multi-family housing section of just four neighborhoods more research is needed to confirm whether this exploratory study can be replicated, and whether findings can be generalized to other types of housing, other countries or simply put to other places. From the viewpoint of respondents in the studied neighborhoods this study shows that out of three different types or sizes of the geographical unit of analysis proposed in relation to the concept of collective efficacy the medium sized one, the micro-neighborhood, is the most commonly referenced. In relation to references of non-organizational nature the smallest type of unit, the micro-place, is almost as common. In addition negative references to collective efficacy, such as respondents discussing a lack of cohesion, is much less common on the smallest scale of geography,
the micro-place, than on the micro-neighborhood or neighborhood level. There is little evidence of collective efficacy on the neighborhood level as originally suggested by Sampson (et al 1997). This suggests that collective efficacy is a social mechanism best understood on the smaller type
geographical units of analysis. On a neighborhood level it may be best to consider levels of collective efficacy as aggregates of smaller units of analysis which may serve as an approximation of the actual levels of collective efficacy on a smaller scale of aggregation30. With the terminology of Hipp & Boessen (2013) it is plausible to assume that there exist more latent potential for collective action in micro-places or micro-neighborhoods given the higher degree of repeated interaction at smaller units of geography. Indeed some of the micro-places, maybe even micro-neighborhoods (but not neighborhoods as a whole), mentioned in this study appear to be examples of how “if residents banded together with regularity, then the city social landscape would appear as a collection of such non overlapping groups forming for social action” (Hipp & Boessen 2013: 30). Collective efficacy appears not to primarily be a neighborhood level social mechanism in the studied neighborhoods, although the results cannot be generalized further based on an exploratory case study.
The findings in this paper point to a need within criminology to take even greater care in the definition of geographical units of analysis when applying the theory of collective efficacy. If collective efficacy primarily takes place at very small levels of geography then the effects of collective efficacy should ideally be studied at such small units too. When using larger units of geography it is important to be aware of potential pitfalls, especially if there is considerable intra-unit variation in collective efficacy or related variables. Specifically this may be of importance when studying contextual neighborhood effects of collective efficacy since this study shows that resident-perceived contexts of collective efficacy indeed exist, but not primarily on the neighborhood level. If the results of this study can be replicated and generalized to broader societal or spatial contexts it could help inform policy decisions pertaining for instance to crime prevention or community
30 What Weisburd and colleagues (2009b: 20) call averaging: “[…] in measuring higher order geographic units miss local area effects”
development. Interventions to strengthen collective efficacy should be directed towards small scales of geography rather than larger neighborhoods or communities. In Sweden and elsewhere there is a strong focus on interventions in- or development of neighborhoods and communities which, in this specific instance, may be considered somewhat misplaced. There are however neighborhood level processes of importance both to collective efficacy and in a broader sense to life in general. The argument put forward by Robert Sampson (2013: 8) that the perceptions or symbolic power of a neighborhood is of importance may be beyond the scope of this paper, but has elsewhere been addressed as an important construct in the studied neighborhoods (Gerell 2013; See also Lupton 2003). Reputation, stigma or other symbolic mechanisms may be important contextual mechanisms to study in themselves and in relation to their impact on collective efficacy but then independent data to measure those mechanisms need to be analyzed in order to identify contextual effects. There are several shortcomings in this study. In general results from a case study must be
interpreted with caution, and there is additional uncertainty in the results from the survey since the neighborhood level has too few units of analysis for reliable variance decomposition. An additional level of uncertainty is introduced from the relative lack of young persons and, to a lesser extent, of individuals with a foreign background and of males in the survey. That said the results from both data sets do point in the same direction, independently indicating that collective efficacy mainly take place at smaller geographical units. The present study only covers multi-family housing, and possibly social mechanisms work in a different way in single family housing. A more specific shortcoming of this study is that the four neighborhoods studied all have two areas with its own property manager organization resulting in a clear line of division, not least in terms of organizations with few
neighborhood based organizations but several micro-neighborhood level organizations. In addition there are large differences in SES tied to the different property managers and the physical structure of the neighborhoods with parking lots and access roads is centered on the micro-neighborhood. The combination of a single property manager organization for each micro-neighborhood and the physical structure of the neighborhoods revolving on the micro-neighborhood likely have an effect
on the construction of- and effects of collective efficacy, and these results therefore need to be considered in light of that. It may however also be noted that the neighborhoods discussed in this paper are fairly small, especially as compared to US operationalizations, and that they have been made more homogenous through the exclusion of small house and retirement home areas, which hypothetically could be expected to correspond to smaller intra-neighborhood differences and thus strengthening the plausibility of the results.
Acknowledgements
This paper is part of the project “Fire, vandalism, neighborhood and social capital”, funded by Länsförsäkringars forskningsfond and led by professor Per-Olof Hallin of the Urban studies
department at Malmö university. The author would like to thank professor Lieven Pauwels of Ghent University for invaluable comments and advice.
Appendix
Appendix 1. Trust and informal social control (two items each), collective efficacy mean of trust and informal social control. Low numbers imply high levels of trust, control or collective efficacy. Table includes all responses with valid values for both collective efficacy and neighborhood.
N Min-Max Mean Std deviation Cronbach
alpha Collective efficacy 597 1-5 2,7793 .80632 .735 Trust 636 1-5 2,5605 ,88506 .710 Informal social control 626 1-5 2,9992 1,05205 .782
Appendix 2. Descriptive survey data and comparison with census data (2011) for three of the
variables. Note that census data includes single family housing areas for two of the neighborhoods in addition to a retirement home in one of the neighborhoods. Chi square significance test of
difference between observed and expected values reported with *** = p <0.001, other values p>0.05
Variable Value Share Census data Chi2
comparison
Gender 1=Female 60% 52% X2= 2.57
Age group 4 1=61 years or older 47% 25% X2= 25.81***
Foreign background 1=Both parents foreign born
45% 58%31 X2= 3.38
Single 1=Single 55% n.a
Subjective poverty 1=Insufficient income
25% n.a
Appendix 3. Interview question examples pertaining to main themes of the paper.
Question Theme
Do you have a sense of belonging with others
living in this neighborhood? Cohesion
Is there a sense of what you can and cannot do
in this neighborhood? Cohesion
Are there any organizations that contribute to
cooperation within the neighborhood? Collective action Is there a feeling of cooperation in the
neighborhood, for instance to maintain order or to improve the neighborhood?
Collective action Who would you/your neighbors turn to in case
of trouble with youth fighting/problems with the property or outdoors environment?
Informal social control If there would be youth spraying graffiti outside Informal social control
31 Census data is based on foreign born or having both parents foreign born, while survey data is based only on parents birth place. In practice this should make little difference as people who are foreign born should tend to have foreign born parents as well.
your house, do you think your neighbors would say something to them?
Do you have a sense of belonging with others
living in your house – your yard – your block? Space/Place Is there a difference between different parts of
the neighborhood? (Exemplifying with micro-neighborhoods)
Space/Place Is there a difference in how you view those who
live in your neighborhood compared to other neighborhoods?
Space/Place
References
Andresen, MA. & Malleson, N. (2011). Testing the Stability of Crime Patterns: Implications for Theory and Policy. Journal of Research in Crime and Delinquency. Vol. 48, 58-82
Bellair. PE. (1997). Social interaction and community crime: Examining the importance of neighbor networks. Criminology Vol. 35, 677-703
Block, R. L. & Block, C. R. (1995). Space, place and crime: Hot spot areas and hot places of liquor-related crime. In Eck, J. & Weisburd, D. (Eds) (1995). Crime and place, 145-183
Braga, AA. (2007). Effects of hot spots policing on crime. A Campbell collaboration systematic review, Available online at
http://campbellcollaboration.org/lib/download/118/
accessed 13 May 2013Brantingham, P., & Brantingham, P. (1995). Criminality of place. European Journal on Criminal Policy and Research, 3:3, 5-26.
Brantingham, PL., Brantingham, PJ., Vajihollahi, M. & Wuschke, K. (2009). Crime Analysis at Multiple Scales of Aggregation: A Topological Approach. . In Weisburd, D., Bernasco, W. & Bruinsma, GJN. (2009). Putting Crime in its Place. Springer, New York.
Browning, CR. (2002). The Span of Collective Efficacy: Extending Social Disorganization Theory to Partner Violence, Journal of Marriage and Family, Vol. 64:4, 833-850
Bruinsma, G. J., Pauwels, L. J., Weerman, F. M., & Bernasco, W. (2013). Social Disorganization, Social Capital, Collective Efficacy and the Spatial Distribution of Crime and Offenders An Empirical Test of Six Neighbourhood Models for a Dutch City. British Journal of Criminology (Online advance access, published May 20, 2013)
Bursik, RJ. & Grasmick, HG. (1993). Neighborhoods and crime: The dimensions of effective community control. Lexington, New York.
Chainey, S & Desyllas, J. (2008) Modelling Pedestrian Movement to Measure On-Street Crime Risk, In Liu, L. & Eck, J. (Eds) (2008). Artificial Crime Analysis Systems: Using Computer Simulations and Geographic Information Systems, 71-91
Cohen, LE & Felson, M. (1979) Social Change and Crime Rate Trends: A Routine Activity Approach,
American Sociological Review
Vol. 44, No. 4, Aug., 1979
588-608Cohen, D. A., Inagami, S., & Finch, B. (2008). The built environment and collective efficacy. Health & place, 14(2), 198-208.
Felson, M. & Cohen, LE. (1980). Human Ecology and Crime: A Routine Activity Approach. Human Ecology, Vol. 8:4, 389-406
Gatti, U. & Tremblay, R. E. (2007). Social capital and aggressive behavior. European Journal on Criminal Policy and Research, 13(3-4), 235-249.
Gerell, M. 2013. Skadegörelse, bränder, grannskap och socialt kapital. Malmö University Publications in Urban Studies (MAPIUS), Malmö
Gibson, CL., Zhao, J., Lovrich, NP., Gaffney, MJ. (2002) Social integration, individual perceptions of collective efficacy, and fear of crime in three cities. Justice Quarterly, Vol. 19:3, 537-564
Granovetter, MS. (1973) The strength of weak ties. American journal of sociology, Vol. 78:6, 1360-1380.
Green, M., & Flowerdew, R. (1996). New evidence on the modifiable areal unit problem. Spatial analysis: Modelling in a GIS environment, 41-54.
Hipp JR. (2010) Micro-structure in micro-neighborhoods: a new social distance measure, and its effect on individual and aggregated perceptions of crime and disorder. Social Networks 32:148–159 Hipp, JR. & Boessen, A. (2013). Egohoods as Waves Washing Across the City: A New Measure of “Neighborhoods”. Criminology Vol. 51:2, 287-327
Hox, JJ. (2002). Multilevel analysis: Techniques and applications. Mahwah, NJ. Erlbaum. Ivert, AK. Chrysoulakis, A. Kronkvist, K. & Torstensson-Levander, M. (2013). Malmö
områdesundersökning 2012: Lokala problem, brott och trygghet. Rapport från institutionen för kriminologi, Malmö högskola.
Johnson, BD. (2010) Multilevel Analysis in the Study of Crime and Justice. In Piquero, AR. & Weisburd, D. Handbook of Quantitative Criminology. Springer, New York.
Kennedy, LW., Caplan, JM. & Piza, EL. (2012) A Primer on the Spatial Dynamics of Crime Emergence and Persistence. Rutgers center on Public Security, Newark.
Kornhauser, R. (1978) Social sources of delinquency: An Appraisal of Analytic Models. Chicago university press, Chicago.
Loeber, R. & Wikström, PO. (1993) Individual pathways to Crime in Different Types of
Neighborhoods. In Farrington, DP., Sampson, RJ. & Wikström, PO. (eds) (1993) Integrating Individual and Ecological Aspects of Crime, BRÅ Report 1993: 1, Stockholm: Swedish National Council for Crime Prevention
Loeber, R. & Wikström, PO. (2000) Do Disadvantaged Neighborhoods Cause Well-adjusted Children to Become Adolescent Delinquents? A study of Male Juvenile Serious Offending, Individual Risk and Protective Factors, and Neighborhood Context, Criminology, Vol. 38:4, 1109-1142
Logan, JR. (2012). Making a Place for Space: Spatial Thinking in Social Science. Annual review of sociology Vol. 38, 507-524
Lupton, R. (2003). ‘Neighborhood effects’: Can we measure them and does it matter? CASEpaper 73. London School of Economics, London.
Maas, C. J., & Hox, J. J. (2005). Sufficient Sample Sizes for Multilevel Modeling. Methodology: European Journal of Research Methods for the Behavioral and Social Sciences, 1(3), 86-92. Malmö Stad (2009) Områdesfakta Malmö, accessed through malmo.se June 10 2011
McPherson, M., Silloway, G. & Frey, DL. (1984) Crime, Fear and Control in Neighborhood Commercial Centres: An executive summary, NCJRS 94225
McPherson, M., Smith-Lovin, L., & Cook, J. M. (2001). Birds of a feather: Homophily in social networks. Annual review of sociology, 415-444.
Mellgren, C. (2011). What's neighbourhood got to do with it?: the influence of neighbourhood context on crime and reactions to crime. Faculty of Health and Society, Malmö University.
Morenoff, JD., Sampson, RJ., Raudenbusch, SW. (2001) Neighborhood Inequality, Collective Efficacy, and the Spatial Dynamics of Urban Violence. Criminology Vol. 39:3, 517-560
Pauwels, L., & Hardyns, W. (2009). Measuring community (dis) organizational processes through key informant analysis. European Journal of Criminology, 6(5), 401-417.
Park, RE. & Burgess, EW. (1925/1967) The City: Suggestions for the investigation of human behavior in the urban environment. University of Chicago Press, Chicago.
Oberwittler, D. & Wikström, POH. (2009) Why Small Is Better: Advancing the Study of the Role of Behavioral Contexts in Crime Causation. In Weisburd, D., Bernasco, W., Bruinsma, GJN. (Eds), (2009a). Putting crime in its Place: Units of analysis in Geographic criminology, Springer, New York Openshaw S (1996) Developing GIS-relevant zone-based spatial analysis methods. In: Longley P, Batty M (eds) Spatial analysis: modeling in a GIS environment. Wiley, New York, 55–73
Sampson, RJ. (2006a) How Does Community Context Matter? Social Mechanisms and the
Explanation of Crime. In Wikström, POH. & Sampson, RJ. (eds). The Explanation of Crime: Context, Mechanisms, and Development. 31-60New York and Cambridge: Cambridge University Press Sampson, RJ. (2006b) Collective efficacy theory: Lessons Learned and Directions for Future Inquiry. In Cullen, F., Wright, J. & Ilevins, K. Taking Stock: The Status of Criminological Theory, Volume 15 of
Advances in Criminological Theory, Transaction Publishers
Sampson, RJ. (2012) Great American City. Chicago and the Enduring Neighborhood Effect. University of Chicago press, Chicago.