Investigation of validity for the STarT Back
Screening Tool
A Systematic Review
Johan Gustavsson
Physiotherapy, master's level (60 credits) 2017
Luleå University of Technology Department of Health Sciences
Luleå Tekniska Universitet Institutionen för Hälsovetenskap Avdelning för hälsa och rehabilitering
Översikt av validitet för STarT Back Screening Tool
– En systematiskt litteraturöversikt
Investigation of validity for the STarT Back Screening Tool
– A Systematic Review
Author: Johan Gustavsson
Kurs: Examensarbete, magister i fysioterapi, S7028H Termin: VT 2017
Handledare: Katarina Mikaelsson, Universitetslektor Examinator: Lars Nyberg, Professor
Sammanfattning
Bakgrund: Ospecifik ländryggsmärta är ett växande problem i samhället. Ingen behandling har kunnat visa på tillfredställande resultat för att minska smärta eller förbättra funktion för patienter med ospecifik ländryggssmärta, och 1-18% av dessa patienter utvecklar kronisk ländryggssmärta. STarT Back Screening Tool (SBST) är ett instrument för att subgruppera patienter med ospecifik ländryggssmärta i låg, medium eller hög risk att utveckla kronisk ländryggssmärta för att sedan modifiera behandlingen efter patientens behov. Syftet med denna studie var att utföra en systematisk litteraturöversikt för att undersöka validiteten av SBST för att kunna rättfärdiga dess kliniska användande. Metod: En artikelsökning genomfördes i Pubmed, Cinahl och Medline i februari 2017 för att identifiera studier som undersökte innehållsvaliditet, begreppsvaliditet och kriterievaliditet av SBST. Författaren (JG) utförde bedömning av risk för bias samt extraherade relevanta data enligt riktlinjer av PRISMA-statement. Resultat: 15 artiklar indentifierades för inklusion i litteraturöversikten. 8 artiklar undersökte kriterievaliditeten, 11 artiklar undersökte begreppsvaliditeten och 1 artikel undersökte innehållsvaliditeten. Den prediktiva validiteten visade på heterogen statistisk analys och varierade resultat, en narrativ resultatbeskrivning gjordes vilken visade på
marginella fördelar för användandet av SBST för att förutse framtida utfall. Samtidig validitet visade i de olika artiklarna på resultat mellan 0.34-0.802 med Spearmans korrelations
koefficient. Diskriminativ validitet mättes i samtliga artiklar med Area under the curve analys till mellan 0.69-0.92. Konvergent validitet visade på en Pearsons korrelation mellan 0.708-0.811 och en Spearmans korrelation mellan 0.35-0.74. Konklusion: På grund av heterogena resultat var det inte möjligt att dra några konklusiva slutsatser, dock visade resultaten på begränsad kapacitet för SBST som prediktivt instrument för patienter med ospecifik ländryggssmärta.
Abstract
Background: Non-specific low back pain is a growing problem in society. No treatment have shown satisfying results to reduce pain or disability for patients with non-specific low back pain, and 1-18% of these patients develop chronic low back pain. STarT Back Screening Tool (SBST) is an instrument for sub grouping patients with non-specific low back pain into low, medium or high risk of developing chronic low back pain and then modifying the treatment after the different needs of every patient. The purpose of this study was to do a systematic review, investigating validation of the SBST to evaluate the justification of its use by
clinicians. Method: Pubmed, Cinahl and Medline was searched in February 2017 for studies investigating criterion validity, construct validity and content validity of the SBST. The author (JG) assessed risk of bias and extracted relevant data following the procedures of PRISMA-statement. Result: 15 articles were identified for inclusion in the review. 8 articles investigated criterion validity, 11 articles investigated construct validity and 1 article
investigated content validity. Predictive validity showed heterogeneous statistical analysis and varying results, a narrative result was presented that showed marginal benefits for the use of SBST for prediction of future outcome. Concurrent validity was measured with Spearman’s rank correlation coefficient in all investigated articles, showing results between 0.34-0.802. Discriminant validity was measured with Area under the curve analysis in all articles, scoring between 0.69-0.92. Convergent validity showed a Pearson’s correlation between 0.708-0.811 and a Spearman’s rank correlation between 0.35-0.74. Conclusion: Because of heterogeneity of the results it is not possible to draw conclusive conclusions. However, results tend to show limited evidence for the use of SBST as a predictive instrument for patients with non-specific low back pain.
Content Page no.
1. Intro………5
2. Background………5
3. Purpose of the study……….8
4. Objectives………...8 5. Research ethics………..8 6. Method………...9 6.1. Search strategy………...9 6.2. Eligibility criteria……….10 6.3. Exclusion criteria……….10
6.4. Risk of bias assessment………11
6.5. Data collection………..12
7. Results………..12
7.1. Study selection………..12
7.2. Risk of bias assessment………12
7.3. Criterion validity - Predictive validity………...13
7.4. Criterion validity – Concurrent validity………....14
7.5. Construct validity – Discriminant validity………....15
7.6. Construct validity – Convergent validity………...15
7.7. Face validity & Construct validity………..15
8. Discussion……….19
8.1. Method discussion………19
8.2. Result discussion………...19
9. Conclusion………21
5
1. Intro
Working in a hospital on an orthopedic ward, all personnel encounter patients experiencing non-specific low back pain almost daily. Some experience this pain for the first time and some have reoccurring issues. These patients will either meet a physiotherapist in the emergency room or later when they get admitted into the orthopedic ward. The patients that get admitted are those who are in too much pain and will not be able to handle their home situation. They get help with pain management and mobilization to be able to walk home on their own. Interest for these patients has grown as many patients return with reoccurring pain and many times also worsened pain. Further help for these people seem arbitrary and very unclear since non-specific low back pain is something that in itself is very unclear if you explore the evidence.
2. Background
Non-specific low back pain is a common problem and prevalence in the population show different numbers from different studies. A study from Sweden showed that 41% had non-specific low back pain, and of these 43% of the women and 37% of the men claimed they had this episode of non-specific low back pain for more than 6 months (Björck-van
Dijken, Fjellman-Wiklund, & Hildingsson, 2008). Further, approximately 80% of the entire population will experience back pain at some point in their life (Grooten, 2015). Of people experiencing non-specific low back pain, depending on age when they experience it, 1-18% will develop chronic low back pain with a clear tendency towards higher risk with higher age (Meucci, Fassa, & Faria, 2015). After this steady progression with age, incidence reaches a plateau after the age of 60, which could be related to people not working any more. But it has also been shown that non-specific low back pain is almost always present in the retired population (Wong, Karppinen, & Samartzis, 2017).
Non-specific low back pain is a subject is of interest because of raising numbers of patients experiencing long term back pain across western countries (Waddell, 1996; Leijon & Mulder, 2009; Freburger et al., 2009). Lots of research has been made trying to identify a treatment that has an effect on non-specific low back pain. Both manual treatment and other passive treatments (eg. acupuncture, massage, manipulation, etc.) show no more effect than other treatments (Assendelft, Morton, Yu, Suttorp & Shekelle, 2004; Rubenstein, van Middelkoop,
6
Assendelft, de Boer & van Tulder, 2011). More active treatments (eg. different types of exercise, yoga, etc.) tend to show similar results as passive treatments and several reviews on this subject show that no specific treatment seem superior to another (van Middelkoop et al., 2011; Hayden, van Tulder, Malmivaara & Koes, 2005; Artus, van der Windt, Jordan & Hay, 2010).
As a complement to passive and active treatment a biopsychosocial approach have started to emerge more and more in recent years and a paradigm shift have been recognized (Borkan et al., 2002), but even though this approach has come forward more and more the last fifteen years, it has been around for a long time. The biopsychosocial model was initiated by George Engel in 1978 (Engel, 1978). The biopsychosocial model follows general systems theory where all aspects of a person is taken into account, and all these aspects affect each other (Engel, 1978). The model consists of three components, biological, psychological and social. The components have equal value and have different treatment methods which have to be incorporated into one another (Pincus et al., 2013). Borkan et al. (2002) raised the issue of identifying patients at risk of getting chronic low back pain from their initial problems. Studies on low back pain have increased and studies on identifying patients at risk of chronicity have also emerged (Borkan et al., 2002).
Studies to subgroup and categorize patients with non-specific low back pain have been made, though focus have been biomechanical and motion-related subgroups (Karayannis, Jull, & Hodges, 2012). Studies looking at sub-grouping patients with non-specific low back pain tend to be of low scientific quality and with low power (Mistry, Patel, Hee, Stallard,
& Underwood, 2014; Gurung, Ellard, Mistry, Patel, & Underwood, 2015).
Subgroups for Targeted Treatment (STarT) Back Screening Tool (SBST) is an instrument developed to identify subgroups within a population of people with non-specific low back pain. There are three different sub groups, low risk of developing chronic pain, medium risk of developing chronic pain and high risk of developing chronic pain. After identifying different subgroups the aim is to channel the patients into different treatment modalities, where the rehabilitation has different intensities but all with a Biopsychosocial approach (Hill et al., 2008). The instrument consists of 9 items where the first eight are answered with either “agree” or “disagree”. For the last item a 5-point Likert scale is used. A psychosocial sub score is also used for items 5-9. The maximal score is 9 where 3 or less is considered “low
7
risk”, score >3 but with a psychosocial sub score is 3 or less patient is considered “medium risk”. Patients with a score of >3 and a sub score >4 is subsequently considered to be of “high risk” (Hill et al., 2008). SBST contains a clear set up for how each category of patients shall be treated, this is referred to as stratified care (Main, Sowden, Hill, Watson, & Hay, 2012).
Validity in research aims to assess if an instrument or way of measurement actually measures what the researcher intends to measure. There are several different parts of validity within quantitative research that assesses different variables of the intended instrument. Internal validity is a way of predicting causality between to variables, the aim is to determine cause and effect between two variables and also determine if there is other factors affecting the result. External validity on the other hand explores if there is a possibility to generalize results to a wider population or a different population. If the external validity is high one can assume that the results are applicable to other populations than the studied sample (Hassmén & Hassmén, 2008).
Three major categories of validity is used in research, content validity, criterion validity and construct validity. These categories are in turn divided into sub-categories which are intended to validate different aspects of the intended instrument or clinical test.
Content validity measures if a test is logic and relevant for the variable intended to test. This can be done by a group of experts judging the tool in question. Criterion validity which is divided into two categories, concurrent validity and predictive validity. Concurrent validity is a measure of a similar variable measured at the same time but completely undependable from the original variable, but it has to be in relation to the test needing validation. The other part of criterion validity is Predictive validity which in contrast to concurrent validity tries to predict a future result or behavior. The last variation of validity is construct validity which investigates if an instrument is in fact measuring the intended construct or concept.
Convergent validity, which is the first of two subcategories, measures whether two constructs are related. The second subcategory is discriminant validity which measures whether two construct whom are unrelated actually are unrelated (Hassmén & Hassmén, 2008).
8
3. Purpose of the study
Since non-specific low back pain have become a raising issue in healthcare as stated above, no treatment stand out to for either prevention or treatment of non-specific low back pain and patients develop chronic low back pain, there is a need for a different approach to treatment of non-specific low back pain (Pincus et al., 2013). STarT Back Screening Tool and other
similar instruments could give valuable information to practitioners about how to treat patients and who is in the most need of treatment. This systematic review will be one of few reviews investigating predictive abilities of the SBST and the only one to date giving a complete overview of research regarding validity (construct validity, content validity and criterion validity) for the SBST. The aim of this systematic review is to investigate if the validity of the SBST is of such dignity that clinical use, to sub group patients with non-specific low back pain, is justified.
4. Objectives
How can SBST assess patients with low back pain in contrast to similar instruments? To what extent can SBST subgroup patients with non-specific low back pain and
predict their outcome?
Is the predictive validity of SBST enough to warrant its use on patients with non-specific low back pain?
5. Research ethics
During the process of writing this review the author followed the general rules of research ethics stated by Gustafsson, Hermerén, & Petersson (2005) in their book:”Vad är god forskningssed?”. Their rules follow five guiding words that should inform all research; Honesty, transparency, orderliness, consideration and impartiality (Free translation by the author). These guiding words then make up the core of eight general rules to follow (Free translation by the author):
1. You shall tell the truth about your research.
2. You shall openly account for your methods and results. 3. You shall disclose all commercial interest or other bindings.
4. You shall consciously review and disclose all starting points of your studies. 5. You shall not steal research results from others.
9
6. You shall keep your research in good order.
7. You shall not conduct research in such way other people might come to harm. 8. You shall be fair in your assessment of other people’s research.
In conducting a systematic review, transparency is very important to show how all searches have been conducted and that no article have been left out due to the results not matching the bias of the author. It is important to follow ethical guidelines while writing articles and to complete the process with complete impartiality to make sure the bias of the author does not inflict in the results. All articles on the subject that meets eligibility must be included for honesty and transparency to have been met and to make sure a complete picture of the area of interest is portrayed (Hassmén & Hassmén, 2008). Throughout the entire research process the author have to make decisions in method, analysis and in presenting the results that does not contaminate the research and the way the results are described and discussed, the only aim of research for any author should be to contribute with new knowledge (Hassmén & Hassmén, 2008). No person will be exposed to any intervention, hence no ethical approval is needed to finish this article. All articles selected for review have acquired ethical approvals in an earlier stage.
6. Method
6.1 Search strategy
To secure the quality of this review the author chose to use ’Preferred Reporting Items for Systematic Reviews and Meta-Analyses’ (PRISMA) (Moher, Liberati, Tetzlaff,
Altman; PRISMA Group, 2010; Liberati et al., 2009). This is an instrument developed to up-hold a high quality of evidence while conducting reviews of scientific research (Willis & Quigley, 2011).
All searches were made between 170219 and 170228 by one assessor (author, JG). An initial search was made in Pubmed with terms used “Start back screening tool validity”. A
complementary search was made in Cinahl and Medline with the same keywords used for the search. Another complementary search was made in all three databases with the following keywords, “Start back screening tool”. On 170228 the same search was made for a second time and no additional studies were found. A complete search strategy can be found in table 1. Studies were initially screened according to inclusion and exclusion criteria by title and then
10
by abstract. Eligible articles were then read completely by the author for final screening. All articles had their reference lists screened for additional articles to use, but only duplicates were found.
6.2 Eligibility criteria
Studies on Criterion validity (Predictive- & concurrent validity), Content validity and Construct validity (Convergent- & Discriminant validity) of the STarT Back
Screening Tool.
Adults above the age of 18 with non-specific low back pain. Studies written in English.
Cohort studies, prospective studies and observational studies.
6.3 Exclusion criteria
Patients with spinal stenosis or who have undergone surgery for back pain. Studies not evaluating the full STarT Back Screening Tool.
Randomized controlled trials, case studies and review articles.
Table 1 – Search strategy
Data source Search Terms Hits Chosen articles after screening abstract
Numbers of articles after final screening (Summary in table 3)
PUBMED Start back screening
tool validity N=20
Hill et al, 2010; Beneciuk et al, 2013; Morsö et al, 2013; Matsudaira et al, 2016; Bruyère et al, 2014; Beneciuk et al, 2015; Aebischer et al, 2015; Luan et al, 2014; Karstens et al, 2014; Abedi et al, 2015; Morsö et al, 2011. N=11
N=10
MEDLINE Start back screening tool validity
N=15 Karran et al, 2017; Kongsted et al, 2016. N=2
N=2
CINAHL Start back screening tool validity
N=7 Betten et al, 2015. N=1
N=1
PUBMED Start back screening tool
N=61 Mehling et al, 2015; Hill et al, 2008; Fritz et al, 2011; Piironen et al, 2016.
N=4
11
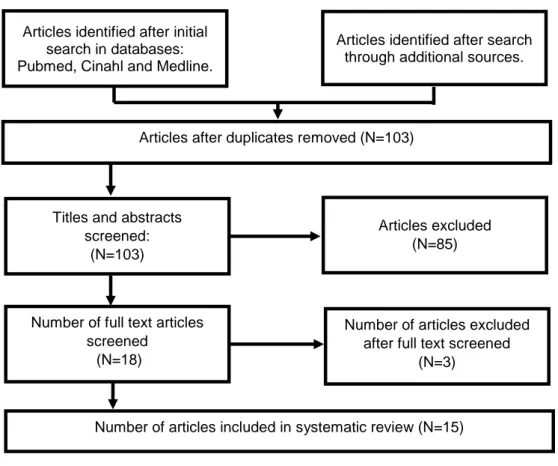
Figure 1. Flow chart of study selection.
6.4 Risk of bias assessment
Included studies were then assessed for risk of bias by one assessor (JG) due to lack of available assessors. Each study was assessed using the Quality In Prognosis Studies (QUIPS) assessment tool (Hayden, van der Windt, Cartwright, Côté & Bombardier, 2013). Each study is evaluated for six different bias domains, were each domain is rated with “low risk of bias”, “moderate risk of bias” and “high risk of bias”. To summarize the risk of bias assessment the author (JG) used the Grading of Recommendations Assessment, Development and Evaluation (GRADE) system according to the Scottish Intercollegiate Guidelines Network (SIGN) (Guyatt et al., 2008). The quality of evidence was first assessed for each article based on the assessment with QUIPS, grading the overall score of each article as ”high quality”, ”moderate quality”, ”low quality” and ”very low quality”. (Guyatt et al., 2008). After this process the result was synthesized according to GRADE. This way of grading evidence corresponds well with other articles (Wertli, Rasmussen-Barr, Weiser, Bachmann, & Brunner, 2014). In accordance with Wertli et al. (2014) author (JG) chose to grade the articles in three levels, compiling ”low quality” and ”very low quality” into one combined level. Full assessment of bias is shown in table 2.
Articles identified after search through additional sources. Articles identified after initial
search in databases: Pubmed, Cinahl and Medline.
Titles and abstracts screened:
(N=103)
Articles excluded (N=85)
Number of full text articles screened
(N=18)
Number of articles excluded after full text screened
(N=3) Articles after duplicates removed (N=103)
12 6.5 Data collection
Data was collected from each article by the author (JG). Data from each article was extracted and categorised according to form of validity examined. Extraction of data was made for Criterion validity, specifically predictive validity and concurrent validity, content validity and for convergent- and discriminant validity as subcategories of construct validity. Also number of participants, study design, outcome measurement and follow-up period was extracted. All this was organized in appendix 1. Further assessment of bias is described and organized in table 2. Because of heterogeneity of published results no meta-analysis was made but instead there is a narrative description of the results (Liberati et al., 2009).
7. Result
7.1 Study selection
Eighteen articles were reviewed in full text. After complete screening of the selected articles fifteen articles met the inclusion criteria (table 2). Three articles were excluded after final screening due to not making the inclusion criteria. One article was actually investigating another instrument (Mehling, Avins, Acree, Carey, & Hecht, 2015), one article was looking at length of treatment for each subgroup but had no outcome measure investigating validity (Fritz, Beneciuk, & George, 2011) and the last article excluded was not evaluating the complete SBST (Beneciuk, Robinson, & George, 2015). Of the selected studies, eight investigated criterion validity with five of these looking at predictive validity and three looking at concurrent validity. Seven studies investigated discriminant validity, three articles investigated convergent validity. Further, one article investigated construct validity without further description and one article investigated content validity (summary in table 3).
7.2 Risk of bias assessment
Three articles were of low quality with a majority of domains scoring moderate or high risk of bias (Matsudaira, Oka, Kikuchi, Haga, Sawada, & Tanaka, 2016; Bruyère et al., 2014; Morsø, Albert, Kent, Manniche, & Hill, 2011). Three articles were assessed as being of high quality with the majority of domains having low risk of bias (Betten, Sandell, Hill, & Gutke, 2015; Karstens et al., 2015; Luan et al., 2014). Remaining nine articles were of moderate quality according to a GRADE evaluation (Hill, Dunn, Main, & Hay, 2010; Hill et al., 2008; Karran et al., 2017; Kongsted, Andersen, Hansen, & Hestbaek, 2016; Beneciuk et al., 2013; Morsø et
13
al., 2013; Aebischer, Hill, Hilfiker, & Karstens, 2015; Abedi et al., 2015; Piironen et al., 2016). Full assessment is summarized in table 2.
Table 2. QUIPS, risk of bias assessment – GRADE, level of evidence
Bias domain Article
Investigated
validity SP SA PFM OM SC SAR GRADE
Karran et al, 2017 Predictive MRB LRB MRB LRB HRB MRB Moderate quality
Hill et al, 2008 Predictive* MRB MRB MRB LRB MRB LRB Moderate quality
Kongsted et al, 2016 Predictive LRB MRB LRB LRB MRB MRB Moderate quality
Beneciuk et al, 2013 Predictive LRB MRB MRB LRB MRB LRB Moderate quality
Morsø et al, 2013 Predictive MRB HRB LRB MRB MRB LRB Moderate quality
Betten et al, 2013 Concurrent LRB LRB LRB LRB MRB LRB High quality
Hill et al, 2010 Concurrent MRB MRB LRB LRB MRB LRB Moderate quality
Matsudaira et al, 2016 Concurrent* HRB LRB LRB MRB HRB LRB Low quality
Bruyère et al, 2014 Convergent HRB HRB MRB LRB MRB LRB Low quality
Aebischer et al, 2015 Convergent* MRB MRB LRB LRB HRB LRB Moderate quality
Abedi et al, 2015 Convergent* MRB MRB LRB LRB HRB LRB Moderate quality
Karstens et al 2015 Discriminant LRB LRB LRB MRB MRB LRB High quality
Morsø et al, 2011 Discriminant HRB HRB LRB LRB HRB LRB Low quality
Luan et al, 2014 Discriminant** MRB LRB LRB LRB MRB LRB High quality
Piironen et al, 2016 Construct MRB HRB LRB LRB MRB LRB Moderate quality
SP – Study participation, SA – Study attrition, PFM – Prognostic factor measurement, OM – Outcome measurement, SC – Study confounding, SAR – Statistical analysis and reporting, LRB – Low risk of bias, MRB – Moderate risk of bias, HRB – High risk of bias, LQ – Low quality, MQ – Moderate quality, HQ – High quality.
*Also investigating discriminant validity. **Also investigating face validity.
7.3 Criterion validity – Predictive validity
Predictive validity was evaluated in five articles (Kongsted et al., 2016; Karran et al., 2017; Beneciuk et al., 2013; Hill et al., 2008; & Morsø et al., 2013), all of moderate quality, found marginal benefits of using SBST for prediction of future low back pain and disability. The method of analysis in the articles were heterogeneous, all five articles analysed the data with different methods and had follow up periods between three to twelve months. Because of this no synthesis of the results were possible.
Karran et al. (2017) is using a regression model to calculate net benefit within certain cut-off points. Conclusion was that the benefit from using SBST or the other evaluated instruments
14
was not clinically valuable. Though SBST showed better results than the other instruments tested. Beneciuk et al. (2013) also used a regression model to evaluate the predictive validity of SBST, but a multiple regression model was used comparing five different questionnaires including SBST. Outcome measures were a Numerical Pain Rating Scale (NPRS) and Oswestry Disability Questionnaire and these instruments were the strongest predictors of outcome at six months but SBST did add value to the prediction of disability but not to pain. Kongsted et al. (2016) is using likelihood ratios (LR) and Area Under the Curve (AUC) to evaluate predictive validity of SBST compared to clinical prediction of outcome. SBST showed similar predictive abilities as the clinicians, but both had low ability to predict outcome and in each subgroup outcomes varied widely. Hill et al. (2008) calculated
specificity, sensitivity and positive and negative likelihood ratios. Positive LR is higher in the study from Hill et al. than for Kongsted et al. and negative LR is lower in Hill et al. In
similarity with other articles results of persons with poor outcome at follow up are varying widely between all three subgroups (Hill et al. 2008; Kongsted et al. 2016; Morsø et al. 2013). The final article evaluating predictive validity of SBST were Morsø et al. (2013). Statistical analysis is made with odds ratio (OR) for poor clinical outcome at 3 months. Specificity and sensitivity was also calculated for three different outcomes with AUC. Results were similar to those of Hill et al. (2008), and as stated above results varied in the different subgroups with 24% in the “low-risk” group, 57% in the “medium-risk” group and 64% in the “high-risk” group having a poor outcome at follow up.
7.4 Criterion validity – Concurrent validity
Three articles investigated concurrent validity, one article were of low quality (Matsudaira et al., 2016), one were of moderate quality (Hill et al., 2010) and one article were of high quality (Betten et al., 2015). All three articles used Spearman’s rank correlation coefficient for
statistical analysis. Two articles tested concurrent validity against Örebro Musculoskeletal Pain Screening Scale (ÖMPSQ), Spearman’s rank correlation scored 0.61 and 0.802 (Betten et al., 2015; Hill, Dunn, Main, & Hay, 2010). One article tested concurrent validity against several different questionnaires and scored between 0.34-0.59 with Spearman’s rank correlation depending on questionnaire (Matsudaira et al., 2016). 0.3-0.5 is considered moderate correlation and >0.5 Spearman’s rank correlation is considered high correlation (Cohen, 1988).
15 7.5 Construct validity – Discriminant validity
Eight articles evaluated discriminant validity of SBST against several different reference standard questionnaires. All articles used Receiver Operating Characteristics (ROC) analysis and Area Under the Curve (AUC) to measure discriminative validity of SBST. For AUC 0.5 – No discrimination, 0.7-0.8 – Acceptable discrimination, 0.8-0.9 – excellent discrimination, >0.9 – Outstanding discrimination (Hosmer, & Lemeshow, 2000).
Four articles were of moderate quality in risk of bias assessment (Karran et al., 2017; Hill et al., 2008; Aebischer et al., 2015; & Abedi et al., 2015), two were of low quality (Matsudaira et al., 2016; & Morsø et al., 2011) and two were of high quality (Karstens et al., 2015; & Luan et al., 2014). AUC for all articles ranged from 0.69-0.92 with only one result, AUC 0.69, being considered low discrimination with all other AUC results being of acceptable discrimination or better.
7.6 Construct validity – Convergent validity
Three articles investigated convergent validity, two of these were considered to be of moderate quality and one of low quality. One of the articles used Pearson’s correlation coefficient for statistical analysis and two used Spearman’s rank correlation coefficient. Convergent validity with Pearson’s correlation was 0.708-0.811 depending on investigated questionnaire and >0.4 is considered satisfactory correlation (Abedi et al., 2015). With
Spearman’s rank correlation one article showed results between 0.35-0.56, this article were of moderate quality (Aebischer et al., 2015). The other article were of low quality and had a Spearman’s rank correlation of 0.74 for both questionnaires investigated (Bruyère et al., 2014). 0.3-0.5 is considered moderate correlation and >0.5 Spearman’s rank correlation is considered high correlation (Cohen, 1988).
7.7 Face validity & construct validity
One article evaluated face validity for the SBST. 30 Chinese patients and experts evaluated a translated version of SBST and found no uncertainty in comprehension of the different items or instructions (Luan et al., 2014). One study investigated construct validity without defining whether it was discriminant validity or convergent validity that was assessed (Piironen et al., 2016). Correlation between SBST and several other questionnaires were conducted and analysed with Spearman’s rank correlation coefficient scoring between 0.31-0.45 which is considered low correlation (Cohen, 1988).
16 Table 3 – Results Article Grading of evidence Investigated validity Method Result
Karran, E. L., Traeger, A. C., McAuley, J. H., Hillier, S. L., Yau, Y., & Moseley, G. L. (2017). The value of prognostic screening for patients with low back pain in secondary care. The Journal Of Pain:
Official Journal Of The American Pain Society,
http://doi:10.1016/j.jpain.2016.12.020 GRADE score – Moderate quality Predictive validity,
Prospective longitudinal cohort study.
18-75 years of age. N=195. 4 month follow up. Predictive validity – Measured with Nagelkerke R2 Discrimination of prediction measured with AUC.
Predictive validity – Between cuf off (20%-50%) there is a slight advatage in using SBST for predictning risk of poor outcome.
Nagelkerke % R2 – 0.12 in Poor Outcome group. Nagelkerke % R2 – 0.26 in High Pain group. AUC 0.69 for the ”poor outcome” group. 0.75 for the ”high pain” group.
Kongsted, A., Andersen, C. H., Hansen, M. M., & Hestbaek, L. (2016). Original article: Prediction of outcome in patients with low back pain – A prospective cohort study comparing clinicians' predictions with those of the Start Back Tool.
Manual Therapy, 21120-127. http://doi:10.1016/j.math.2015.06.008 GRADE score – Moderate quality Predictive validity
Cohortstudy. Adults 18-65 years of age. N=859. 3 & 12 month follow up.
Predictive validity – 3 different questionnaires at baseline-12 months.
Statistical analisis with positive and negative likelihood ratio.
Positive predicitve value for expected outcome.
Predictive validity:
Pain at 12 months for high risk group:
SBST likelihood Ratio – positive 1.2, negative 0.99. Disability at 12 months for high risk group: SBST likelihood Ratio – positive 2.0, negative 0.94. Similar numbers for all risk groups, at all 3 follow ups. AUC at 12 months between 0.50-0.61 depending on outcome measurment and follow up.
Beneciuk, J. M., Bishop, M. D., Fritz, J. M., Robinson, M. E., Asal, N. R., Nisenzon, A. N., & George, S. Z. (2013). The STarT Back Screening Tool and Individual Psychological Measures: Evaluation of Prognostic Capabilities for Low Back Pain Clinical Outcomes in Outpatient Physical Therapy Settings. Physical Therapy, 93(3), 321– 333. http://doi.org/10.2522/ptj.20120207 GRADE score – Moderate quality Predictive validity
Observational prospective cohort study. 18-65 years of age.
N=146.
Measuring disability and pain with a 6 month follow up. Evaluating the predictive validity comparing baseline SBST score with outcome mesures of NPRS and Oswestry Disability Questionnaire (ODQ).
Multiple regression models. Pain - NRS:
Multiple regression % R2 = 18.2
Disability – Oswestry Disability Questionnaire: Multiple regression % R2 = 38.3
Morsø, L., Kent, P., Albert, H. B., Hill, J. C., Kongsted, A., & Manniche, C. (2013). The predictive and external validity of the STarT Back Tool in Danish primary care. European Spine
Journal, 22(8), 1859–1867. http://doi.org/10.1007/s00586-013-2690-z GRADE score – Moderate quality Predictive validity Cohort study, N=344
Predictive ability measured with Odds Ratio (OR) for poor outcome on activity limitation at 3 months. Discriminant ability at 3 months measured with AUC for 3 different outcomes.
Predictive validity:
OR SBST medium risk group – 4.24
OR SBST high risk group – 5.57 after adjustment 15.7. AUC – 0.7-0.79 depending on outcome.
17
Hill, J. C., Dunn, K. M., Lewis, M., Mullis, R., Main, C. J., Foster, N. E., & Hay, E. M. (2008). A primary care back pain screening tool: Identifying patient subgroups for initial treatment. Arthritis &
Rheumatism, 59(5), 632-641. http://doi:10.1002/art.23563 GRADE score – Moderate quality Predictive validity Discriminant validity
Cohort study group N=500 was used to determin predictive validity.
Follow up at 12 months.
Cohort study, N=131 was used to determine Discriminant validity – Measured with AUC.
Predictive validity: Sensitivity – 80.1% Specificity – 65.4% Pos. LH – 2.32 Neg. LH – 0.3 Discriminant validity:
Measured with AUC ranging from 0.73-0.92 for referred leg pain and disability respectively.
Betten, C., Sandell, C., Hill, J. C., & Gutke, A. (2015). Cross-cultural adaptation and validation of the Swedish STarT Back Screening Tool.
European Journal Of Physiotherapy, 17(1), 29-36.
http://doi:10.3109/21679169.2014.1003962 GRADE score – High quality Concurrent validity
Observational cohort study, N=62 Patients attending physiotherapy in primary health care.
Correlation between Örebro musculoskeletal Pain Screening Questionnaire (ÖMPSQ) and SBST measured with spearman’s rank correlation coefficient.
Concurrent validity:
Correlation between SBST and ÖMPSQ spearman’s rank 0.61.
Hill, J. C., Dunn, K. M., Main, C. J., & Hay, E. M. (2010). Subgrouping low back pain: A comparison of the STarT Back Tool with the Örebro
Musculoskeletal Pain Screening
Questionnaire. European Journal of Pain (London,
England), 14(1), 83–89. http://doi.org/10.1016/j.ejpain.2009.01.003 GRADE score – Moderate quality Concurrent validity
Prospective cohort study, N=131.
Testing concurrent validity compared to ÖMPSQ. Spearmans rank correlation was used for statistical analysis.
Spearmans rank correlation between the 2 instruments were 0.802, this correlation is considered as ’large’ (Cohen, 1998).
Agreement between the instruments for subgrouping was ’moderate’ with a Weighted Cohens Kappa 0.57.
Matsudaira, K., Oka, H., Kikuchi, N., Haga, Y., Sawada, T., & Tanaka, S. (2016). Psychometric Properties of the Japanese Version of the STarT Back Tool in Patients with Low Back Pain. PLoS
ONE, 11(3), e0152019. http://doi.org/10.1371/journal.pone.0152019 GRADE score – Low quality Concurrent validity Discriminant validity Cohort study, N=2000.
Online surveys conducted at baseline, 4 weeks and 24 weeks.
Concurrent validity measured with Spearmans Correlation Coefficient between SBST and 6 different questionnaires.
Discriminant validity measured with AUC.
Concurrent validity:
Spearmans Correlation Coefficient ranging between 0.34-0.59 depending on compared questionnaire. Discriminant validity:
AUC ranging between 0.69-0.83 depending on questionnaire.
Bruyère, O., Demoulin, M., Beaudart, C., Hill, J.C., Maquet, D., Genevay, S., Mahieu,
G., Reginster, J.Y., Crielaard, J.M., & Demoulin, C. (2014) Validity and reliability of the French version of the STarT Back screening tool for patients with low back pain. Spine, 39(2), 123-128.
http://doi:10.1097/BRS.0000000000000062 GRADE score – Low quality Convergent validity
Observational prospective study. N=108. >18 years with non specific low back pain. 75% had pain >6 months at baseline.
Convergent validity:
Spearman’s Correlation Coefficient VAS – 0.66
RMDQ – 0.74 ÖMPSQ – 0.74
Aebischer, B., Hill, J. C., Hilfiker, R., & Karstens, S. (2015). German Translation and Cross-Cultural Adaptation of the STarT Back Screening
Tool. PLoS ONE, 10(7), e0132068.
http://doi.org/10.1371/journal.pone.0132068 GRADE score – Moderate quality Convergent validity Discriminant validity
Cross-sectional cohort study, N=50. Comparison between SBST and 5 different questionnaires. Convergent validity measured with Spearmans Correlation Coefficient.
Discriminant validity measured with AUC.
Convergent Validity:
Spearmans Correlation Coefficient ranging from 0.35-0.56.
Discriminant validity: AUC 0.79-0.91.
18
Abedi, M., Manshadi, F.D., Khalkhali, M., Mousavi, S.J., Baghban, A.A., Montazeri, A., & Parnianpour, M. (2015) Translation and validation of the Persian version of the STarT Back Screening Tool in patients with nonspecific low back pain. Manual
Therapy, 20(6), 850-854. http://doi:10.1016/j.math.2015.04.006 GRADE score – Moderate quality Convergent validity Discriminant validity
Observational Cohort study, N=295. Comparison between SBST and 4 other questionnaires, difference measured with Pearson’s correlation coefficient. Discriminant validity measures with AUC.
Convergent validity:
Pearson’s correlation coefficient between 0.708-0.811 depending on outcome measured.
Discriminant validity: AUC range from 0.73-0.86
Karstens, S., Krug, K., Hill, J. C., Stock, C., Steinhaeuser, J., Szecsenyi, J., & Joos, S. (2015). Validation of the German version of the STarT-Back Tool (STarT-G): a cohort study with patients from primary care practices. BMC Musculoskeletal
Disorders, 16, 346. http://doi.org/10.1186/s12891-015-0806-9 GRADE score – High quality Discriminant validity Cohort study, N=228
Comparison between SBST and 4 other
questionnaires. Discriminant validity measured with AUC.
Discriminant validity:
AUC – 0.7-0.77 depending on compared questionnaire.
Morsø, L., Albert, H., Kent, P., Manniche, C., & Hill, J. (2011) Translation and discriminative validation of the STarT Back Screening Tool into Danish. European Spine Journal, 20(12), 2166-2173. http://doi:10.1007/s00586-011-1911-6 GRADE score – Low quality Discriminant validity
Cohort study, N=311. Questionnaires sent by mail. Measuring discriminant validity by comparing SBST with 4 other questionnaires.
Discriminant validity:
AUC – range from 0.735-0.855.
The study compared each question with the different reference questionnaires and with the english version of SBST.
Luan, S., Min, Y., Li, G., Lin, C., Li, X., Wu, S., Ma, C., & Hill, J.C. (2014) Cross-cultural adaptation, reliability, and validity of the Chinese version of the STarT Back Screening Tool in patients with low back pain. Spine, 39(16), 974-979.
http://doi:10.1097/BRS.0000000000000413 GRADE score – High quality Discriminant validity Face validity
Observational Prospective study, N=307. Comparison between SBST and 4 other questionnaires.
Discriminant validity measured with AUC.
Discriminant validity:
AUC for SBST 0.751-0.893 depending on outcome measured.
Piironen, S., Paananen, M., Haapea, M., Hupli, M., Zitting, P., Ryynänen, K., … Karppinen, J. (2016) Transcultural adaption and psychometric properties of
the STarT Back Screening Tool among Finnish low back pain patients. European Spine Journal, 25(1), 287-295. http://doi:10.1007/s00586-015-3804-6 GRADE score – Moderate quality Construct validity
Observational Cohort study, N=116. Paitents recruited in outpaitent clinics.
Comparison between 3 different questinnaires, LBP and intensity of leg pain.
Construct validity:
19
8. Discussion
8.1 Method discussion
This systematic review followed the guidelines of the PRISMA-statement throughout the process (Liberati et al., 2009). One limitation in accordance with this was that only one assessor have made all screening and selecting of articles, further the author (JG) have assessed risk of bias without a second assessor to reach consensus which in turn makes the risk of bias for this review higher. The PRISMA-statement is written with a focus on
Randomised Controlled Trials (RCT) and according to their instructions some modification of the guidelines have been made to better suit a review of observational studies (Liberati et al., 2009). SBST is a fairly new instrument, this gives a limited selection of articles on the subject. A majority of the articles on the subject have been screened and further, a large part of these studies have also been reviewed in this article, though for each variable of validation only a few articles have been available for selection. One earlier review has been published in January 2017 by Karran et al. which investigated the predictive qualities of several instrument including SBST. The systematic review by Karran et al. (2017) includes three articles that have also been selected for this review. One article used in that review was excluded at abstract screening due to investigating the intervention rather than the actual initial prediction of SBST (Newell, Field, & Pollard, 2015).
8.2 Result discussion
SBST showed acceptable to outstanding discriminant validity throughout all studies investigated, only one article of low quality (Matsudaira et al., 2016) had AUC for
discriminant validity below 0.7 which is considered acceptable (Hill et al., 2008). Convergent validity showed varying results in the three studies, all results were considered of moderate or high correlation with other relevant questionnaires (Bruyère et al., 2014; Aebischer et al., 2015; & Abedi et al., 2015). Concurrent validity also showed moderate to high correlation in the three investigating studies (Betten et al., 2015; Hill et al., 2010; & Matsudaira et al., 2016). With these results in mind SBST seem to have similar ability as other questionnaires to assess patients with non-specific low back pain. The SBST also tend to have similar capability as other reference questionnaires at subgrouping patients into risk-groups, although SBST tended to discriminate better within the low- and medium risk group than in the high risk group (Piironen et al., 2016; Hill et al., 2010).
20
The results of concurrent- convergent- and discriminant validity show good results which draws the conclusion that SBST is in fact investigating relevant factors, however, SBST is first and foremost a predictive tool and therefor the predictive validity is what is important to investigate. The other investigated forms of validity serves as a first determent if the
instrument is actually relevant for this group of patients. The results for concurrent-
convergent- and discriminant validity do not, however indicate if SBST does in fact perform what it is said to perform which is to predict future outcome for patients with non-specific low back pain.
For predictive validity, which is main focus of the SBST, only five articles were included (Karran et al., 2017; Hill et al., 2008; Kongsted et al., 2016; Beneciuk et al., 2013; & Morsø et al., 2013). All five studies were considered to be of moderate quality and with conflicting results and heterogeneity of statistical analysis. According to Steyerberg et al. (2013) AUC is the statistical analysis of choice for most articles investigating predictive validity. The articles chosen for this review mostly used other methods of analysis, hence the author would have been forced to re-calculate results to get homogenous results to analyse. Difference in the reporting of statistical analysis for each article demand a high level of knowledge in statistical analysis to be able to draw conclusion of the predictive ability of SBST, the author have not been able to conduct such calculation.
Looking at the results of the individual studies investigating predictive validity there are several things to consider. Kongsted et al. (2016) showed that the predictive ability was equally low for clinicians and SBST, for example only 10% of patients considered by SBST to be of low risk where pain free after two weeks. Hill et al. (2008) showed similar results with 16.7% of the low risk group had poor outcome at six months and Morsø et al. (2013), as stated above, showed that 24% of the low risk group had poor outcome at follow up. Also Kongsted et al. (2016) showed that only 60% of patients in the high risk group actually had poor outcome at twelve month follow up. These numbers among the other results paint a picture of an instrument with acceptable predictive discrimination but with many patients risking poor outcome even though they are considered low risk. In a recent review on this subject Karran et al. (2017) did a substantial calculation of results on predictive ability of SBST and showed that the predictive instruments they evaluated, including SBST, would correctly predict patient outcome 60-70% of the time. Since the review of Karran et al. (2017) a few more articles investigating SBST have been published and also added to this review,
21
however more studies are needed with homogenous outcomes to promote a meta-analysis of the results.
Another way of using SBST was investigated by Beneciuk et al. (2013), they investigated the change of outcome measures over a four week period and this change over time were
predictive of the outcome at six month follow up. Most guidelines for treatment of
non-specific low back pain recognize psychosocial factors as a predictor for future problems (Koes et al., 2010), however for the studies investigating psychosocial sub scores in this review the results tended to be of similar standard as the results of the total SBST score (Karran et al., 2017; Hill et al., 2008; Beneciuk et al., 2013; & Piironen et al., 2016).
SBST is intended as a predictive tool but has also always been intended to be used together with stratified care of the patients (Hill et al., 2008; Hay et al., 2008). This approach has showed good results in several studies (Hill et al., 2011; Foster et al., 2014), which indicates that SBST might have value in the care of patients with non-specific low back pain but not solely as a predictive instrument. The discrepancy in prediction versus outcome would perhaps decrease if treatment of patients were standardized.
9. Conclusion
STarT Back Screening Tool show acceptable results for concurrent, convergent and
discriminant validity. Due to heterogeneity of statistical analysis in the studies investigating predictive validity it is difficult to draw conclusions from the presented results. There may however be a clinical use of the STarT Back Screening Tool, together with stratified care proposed by Hill et al. (2008) the instrument have shown results which could justify its use (Hay et al., 2008). Further studies on this subject should focus on predictive validity of SBST where selection of articles is low. Also, studies of high quality on the stratified care according to sub grouping with SBST is of interest for future research.
Physiotherapists working with patients with non-specific low back pain must recognize that an instrument like SBST or any other instrument will not give a complete picture of a patient and how they will react to their condition. It might give an indication to how the patient will respond to treatment but there will also be many other factors affecting the outcome which the physiotherapist has to take into account. To date there is no consensus around what is the best
22
treatment for non-specific low back pain but information seem to be key. With more research around the stratified care of SBST perhaps there can be shown that information and a
biopsychosocial approach towards all patients will lead the profession in the right direction. In the end each individual practitioner will have to make a decision on how to treat each patient according to the evidence available, SBST could give some information but it will not give all the information and evidence to date do not warrant treatment of a patient with non-specific low back pain to be different based only on the result of SBST.
23
10. References
Abedi, M., Manshadi, F.D., Khalkhali, M., Mousavi, S.J., Baghban, A.A., Montazeri, A., & Parnianpour, M. (2015) Translation and validation of the Persian version of
the STarT Back Screening Tool in patients with nonspecific low back pain. Manual Therapy, 20(6), 850-854. http://doi:10.1016/j.math.2015.04.006
Aebischer, B., Hill, J. C., Hilfiker, R., & Karstens, S. (2015). German Translation and Cross-Cultural Adaptation of the STarT Back Screening Tool. PLoS ONE, 10(7), e0132068. http://doi.org/10.1371/journal.pone.0132068
Artus, M., van der Windt, D.A., Jordan, K.P., & Hay, E.M. (2010) Low back pain symptoms show a similar pattern of improvement following a wide range of primary care treatments: a systematic review of randomized clinical trials. Rheumatology, (Oxford, 49(12), 2346-2356. http://doi:10.1093/rheumatology/keq245
Beneciuk, J. M., Bishop, M. D., Fritz, J. M., Robinson, M. E., Asal, N. R., Nisenzon, A. N., & George, S. Z. (2013). The STarT Back Screening Tool and Individual Psychological
Measures: Evaluation of Prognostic Capabilities for Low Back Pain Clinical Outcomes in Outpatient Physical Therapy Settings. Physical Therapy, 93(3), 321–333.
http://doi.org/10.2522/ptj.20120207
Beneciuk, J. M., Robinson, M. E., & George, S. Z. (2015). Subgrouping For Patients With Low Back Pain: A Multidimensional Approach Incorporating Cluster Analysis & The STarT Back Screening Tool. The Journal of Pain : Official Journal of the American Pain
Society, 16(1), 19–30. http://doi.org/10.1016/j.jpain.2014.10.004
Betten, C., Sandell, C., Hill, J. C., & Gutke, A. (2015). Cross-cultural adaptation and
validation of the Swedish STarT Back Screening Tool. European Journal Of Physiotherapy,
17(1), 29-36. http://doi:10.3109/21679169.2014.1003962
Björck-van Dijken, C., Fjellman-Wiklund, A., & Hildingsson, C. (2008) Low back pain, lifestyle factors and physical activity: a population based-study. Journal of Rehabilitation
Medicine, 40(10), 864-869. http://doi:10.2340/16501977-0273
Borkan, J., Van Tulder, M., Reis, S., Schoene, M.L., Croft, P., & Hermoni, D. (2002)
Advances in the field of low back pain in primary care: a report from the fourth international forum. Spine, 27(5), 128-132.
Bruyère, O., Demoulin, M., Beaudart, C., Hill, J.C., Maquet, D., Genevay, S., Mahieu, G., Reginster, J.Y., Crielaard, J.M., & Demoulin, C. (2014) Validity and reliability of the French version of the STarT Back screening tool for patients with low back pain. Spine, 39(2), 123-128. http://doi:10.1097/BRS.0000000000000062
Cohen, J. (1988) Statistical power analysis for the behavioural sciences (2nd ed.). Hillsdale, N.J.: Lawrence Erlbaum Associates.
Engel, G.L. (1978) The biopsychosocial model and the education of health professionals.
Annals of the New York Academy of Sciences, 310, 169-187.
24
Foster, N. E., Mullis, R., Hill, J. C., Lewis, M., Whitehurst, D. G. T., Doyle, C., … Hay, E. M. (2014). Effect of Stratified Care for Low Back Pain in Family Practice (IMPaCT Back): A Prospective Population-Based Sequential Comparison. Annals of Family Medicine, 12(2), 102–111. http://doi.org/10.1370/afm.1625
Freburger, J. K., Holmes, G. M., Agans, R. P., Jackman, A. M., Darter, J. D., Wallace, A. S., … Carey, T. S. (2009). The Rising Prevalence of Chronic Low Back Pain. Archives of
Internal Medicine, 169(3), 251–258. http://doi.org/10.1001/archinternmed.2008.543
Fritz, J. M., Beneciuk, J. M., & George, S. Z. (2011). Relationship between categorization with the STarT Back Screening Tool and prognosis for people receiving physical therapy for low back pain. Physical Therapy, 91(5), 722-732. http://doi:10.2522/ptj.20100109
Grooten, W. (red.) (2015) Fysisk aktivitet i sjukdomsprevention och sjukdomsbehandling. (2nd ed.) Stockholm: Wordpress.
Gurung, T., Ellard, D.R., Mistry, D., Patel, S., & Underwood, M, (2015) Identifying potential moderators for response to treatment in low back pain: A systematic review. Physiotherapy, 101(3), 243 – 251. http://doi:10.1016/j.physio.2015.01.006
Gustafsson, B., Hermerén, G., & Petersson, B. Vad är god forskningssed?: synpunkter,
riktlinjer och exempel. Stockholm: Vetenskapsrådet; 2005.
Guyatt, G. H., Oxman, A. D., Vist, G. E., Kunz, R., Falck-Ytter, Y., Alonso-Coello, P., & Schünemann, H. J. (2008). GRADE: an emerging consensus on rating quality of evidence and strength of recommendations. BMJ : British Medical Journal, 336(7650), 924–926.
http://doi.org.proxy.lib.ltu.se/10.1136/bmj.39489.470347.AD
Hassmén, N., & Hassmén, P. (2008) Idrottsvetenskapliga forskningsmetoder (1. ed.) Stockholm: SISU idrottsböcker.
Hay, E. M., Dunn, K. M., Hill, J. C., Lewis, M., Mason, E. E., Konstantinou, K., … Main, C. J. (2008). A randomised clinical trial of subgrouping and targeted treatment for low back pain compared with best current care. The STarT Back Trial Study Protocol. BMC Musculoskeletal
Disorders, 9, 58. http://doi.org/10.1186/1471-2474-9-58
Hayden, J.A., van der Windt, D.A., Cartwright, J.L., Côté, P., & Bombardier, C. (2013) Assessing bias in studies of prognostic factors. Annals of Internal Medicine, 158(4), 280-286. http://doi:10.7326/0003-4819-158-4-201302190-00009
Hayden, J., van Tulder, M.W., Malmivaara, A., & Koes, B.W. (2005) Exercise therapy for treatment of non-specific low back pain. Cochrane Database of Systematic Reviews, 3, Art. No.: CD000335. doi:10.1002/14651858.CD000335.pub2
Hill, J.C., Dunn, K.M., Lewis, M., Mullis, R., Main, C.J., Foster, N.E., & Hay, E.M. (2008) A primary care back pain screening tool: identifying patient subgroups for initial treatment.
25
Hill, J. C., Dunn, K. M., Main, C. J., & Hay, E. M. (2010). Subgrouping low back pain: A comparison of the STarT Back Tool with the Örebro Musculoskeletal Pain Screening Questionnaire. European Journal of Pain (London, England), 14(1), 83–89.
http://doi.org/10.1016/j.ejpain.2009.01.003
Hill, J. C., Whitehurst, D. G., Lewis, M., Bryan, S., Dunn, K. M., Foster, N. E., … Hay, E. M. (2011). Comparison of stratified primary care management for low back pain with current best practice (STarT Back): a randomised controlled trial. Lancet, 378(9802), 1560–1571. http://doi.org/10.1016/S0140-6736(11)60937-9
Hosmer, D.W., & Lemeshow, S. (2000) Applied logistic regression. Wiley series in
probability and statistics (2. Ed) New York: Wiley.
Karayannis, N. V., Jull, G. A., & Hodges, P. W. (2012). Physiotherapy movement based classification approaches to low back pain: comparison of subgroups through review and developer/expert survey. BMC Musculoskeletal Disorders, 13, 24.
http://doi.org/10.1186/1471-2474-13-24
Karran, E. L., McAuley, J. H., Traeger, A. C., Hillier, S. L., Grabherr, L., Russek, L. N., & Moseley, G. L. (2017). Can screening instruments accurately determine poor outcome risk in adults with recent onset low back pain? A systematic review and meta-analysis. BMC
Medicine, 15, 13. http://doi.org/10.1186/s12916-016-0774-4
Karran, E. L., Traeger, A. C., McAuley, J. H., Hillier, S. L., Yau, Y., & Moseley, G. L. (2017). The value of prognostic screening for patients with low back pain in secondary care.
The Journal Of Pain: Official Journal Of The American Pain Society,
http://doi:10.1016/j.jpain.2016.12.020
Karstens, S., Krug, K., Hill, J. C., Stock, C., Steinhaeuser, J., Szecsenyi, J., & Joos, S. (2015). Validation of the German version of the STarT-Back Tool (STarT-G): a cohort study with patients from primary care practices. BMC Musculoskeletal Disorders, 16, 346.
http://doi.org/10.1186/s12891-015-0806-9
Koes, B. W., van Tulder, M., Lin, C.-W. C., Macedo, L. G., McAuley, J., & Maher, C. (2010). An updated overview of clinical guidelines for the management of non-specific low back pain in primary care. European Spine Journal, 19(12), 2075–2094.
http://doi.org/10.1007/s00586-010-1502-y
Kongsted, A., Andersen, C. H., Hansen, M. M., & Hestbaek, L. (2016). Original article: Prediction of outcome in patients with low back pain – A prospective cohort study comparing clinicians' predictions with those of the Start Back Tool. Manual Therapy, 21120-127.
http://doi:10.1016/j.math.2015.06.008
Leijon, O., & Mulder, M. (2009) Prevalence of low back pain and concurrent psychological distress over a 16-year period. Occupational and Environmental Medicine, 66(2), 137-139. http://doi:10.1136/oem.2008.040337
Liberati, A., Altman, D. G., Tetzlaff, J., Mulrow, C., Gøtzsche, P. C., Ioannidis, J. P. A., … Moher, D. (2009). The PRISMA Statement for Reporting Systematic Reviews and
Meta-26
Analyses of Studies That Evaluate Health Care Interventions: Explanation and
Elaboration. PLoS Medicine, 6(7), e1000100. http://doi.org/10.1371/journal.pmed.1000100
Luan, S., Min, Y., Li, G., Lin, C., Li, X., Wu, S., Ma, C., & Hill, J.C. (2014) Cross-cultural adaptation, reliability, and validity of the Chinese version of the STarT Back Screening Tool in patients with low back pain. Spine, 39(16), 974-979.
http://doi:10.1097/BRS.0000000000000413
Macedo, L.G., Elkins, M.R., Maher, C.G., Moseley, A.M., Herbert, R.D., & Sherrington C. (2010) There was evidence of convergent and construct validity of Physiotherapy Evidence Database quality scale for physiotherapy trials, Journal of Clinical Epidemiology, 63(8), 920 – 925. http://doi:10.1016/j.jclinepi.2009.10.005
Main, C.J., Sowden, G., Hill, J.C., Watson, P.J., & Hay, E.M. (2012) Integrating physical and psychological approaches to treatment in low back pain: the development and content of the STarT Back trial's 'high-risk' intervention (StarT Back; ISRCTN 37113406).
Physiotherapy, 98(2), 110-116. http://doi:10.1016/j.physio.2011.03.003
Matsudaira, K., Oka, H., Kikuchi, N., Haga, Y., Sawada, T., & Tanaka, S. (2016).
Psychometric Properties of the Japanese Version of the STarT Back Tool in Patients with Low Back Pain. PLoS ONE, 11(3), e0152019. http://doi.org/10.1371/journal.pone.0152019
Mehling, W. E., Avins, A. L., Acree, M. C., Carey, T. S., & Hecht, F. M. (2015). Can a back pain screening tool help classify patients with acute pain into risk levels for chronic
pain? European Journal of Pain, 19(3), 439–446. http://doi.org/10.1002/ejp.615
Meucci, M.D., Fassa, A.G. & Faria, N.M. (2015) Prevalence of chronic low back pain: systematic review. Revista de Saude Publica. 49: 1.
van Middelkoop, M., Rubinstein, S. M., Kuijpers, T., Verhagen, A. P., Ostelo, R., Koes, B. W., & van Tulder, M. W. (2011). A systematic review on the effectiveness of physical and rehabilitation interventions for chronic non-specific low back pain. European Spine
Journal, 20(1), 19–39. http://doi.org/10.1007/s00586-010-1518-3
Mistry, D., Patel, S., Hee, S.W., Stallard, N., & Underwood, M. (2014) Evaluating the quality of subgroup analyses in randomized controlled trials of therapist-delivered interventions for nonspecific low back pain: a systematic review. Spine, 39(7), 618-629.
http://doi:10.1097/BRS.0000000000000231
Moher, D., Liberati, A., Tetzlaff, J., Altman, D.G.; PRISMA Group. (2010) Preferred reporting items for systematic reviews and meta-analyses: the PRISMA statement.
International Journal of Surgery (London, England), 8(5), 336-341.
http://doi:10.1016/j.ijsu.2010.02.007
Morsø, L., Albert, H., Kent, P., Manniche, C., & Hill, J. (2011) Translation and discriminative validation of the STarT Back Screening Tool into Danish. European Spine Journal, 20(12), 2166-2173. http://doi:10.1007/s00586-011-1911-6
27
Morsø, L., Kent, P., Albert, H. B., Hill, J. C., Kongsted, A., & Manniche, C. (2013). The predictive and external validity of the STarT Back Tool in Danish primary care. European
Spine Journal, 22(8), 1859–1867. http://doi.org/10.1007/s00586-013-2690-z
Newell, D., Field, J., & Pollard, D. (2015) Using the STarT Back Tool: Does timing of
stratification matter? Manual Therapy, 20(4), 533-539. http://doi:10.1016/j.math.2014.08.001
Piironen, S., Paananen, M., Haapea, M., Hupli, M., Zitting, P., Ryynänen, K., … Karppinen, J. (2016) Transcultural adaption and psychometric properties of
the STarT Back Screening Tool among Finnish low back pain patients. European Spine
Journal, 25(1), 287-295. http://doi:10.1007/s00586-015-3804-6
Pincus, T., Kent, P., Bronfort, G., Loisel, P., Pransky, G., & Hartvigsen, J. (2013) Twenty-five years with the biopsychosocial model of low back pain-is it time to celebrate? A report from the twelfth international forum for primary care research on low back pain. Spine, 38(24), 2118-2123. http://doi:10.1097/BRS.0b013e3182a8c5d6
Steyerberg, E. W., Moons, K. G. M., van der Windt, D. A., Hayden, J. A., Perel, P., Schroter, S., … for the PROGRESS Group. (2013). Prognosis Research Strategy (PROGRESS) 3: Prognostic Model Research. PLoS Medicine, 10(2), e1001381.
http://doi.org/10.1371/journal.pmed.1001381
Waddell, G. (1996) Low back pain: a twentieth century health care enigma. Spine, 21(24), 2820-2825.
Wertli, M.M., Rasmussen-Barr, E., Weiser, S., Bachmann, L.M., & Brunner, F. (2014) The role of fear avoidance beliefs as prognostic factor for outcome in patients with nonspecific low back pain: a systematic review. Spine journal: official journal of the North American
Spine Society, 14(5), 816-836. http://doi:10.1016/j.spinee.2013.09.036
Willis, B. H., & Quigley, M. (2011). The assessment of the quality of reporting of meta-analyses in diagnostic research: a systematic review. BMC Medical Research
Methodology, 11, 163. http://doi.org/10.1186/1471-2288-11-163
Wong, A. Y., Karppinen, J., & Samartzis, D. (2017). Low back pain in older adults: risk factors, management options and future directions. Scoliosis and Spinal Disorders, 12, 14.
28