THESIS 30 HP School of Sustainable Development of Society
And Technology (HST)
FEASIBILITY STUDY OF USING WIND
POWER DRIVEN HEAT PUMP TO SUPPLY
HEAT FOR A SINGLE HOUSE
Degree project at Mälardalen University
Student:
Sara Berretta
Examiners:
Prof. Yan Jinyue
Dr. Hailong Li
Supervisors:
Dr. Hailong Li
i
ABSTRACT
A part of the primary energy resources is consumed in space heating and domestic hot water. The goal of energy utilization reduction set by Sweden is reducing 20% of the energy demand in buildings sector by 2020.
The heat pump system driven by wind power is an attractive solution to produce thermal energy, better than solar power especially in Nordic countries where the thermal energy demand for space heating and hot water is mainly in winter time in which the sunshine hour is quite low; moreover, the capacity factor of wind power is higher than the solar power. Wind energy is a free, renewable resource, so no matter how much is used today, there will still be the same supply in the future. Wind energy is also a source of clean, non-polluting, electricity. Unlike conventional power plants, wind plants emit no air pollutants or greenhouse gases.
What about the possibility to use wind energy to supply the energy demand of a detached house? The objective of this master thesis is to evaluate the energy demand of a detached house, in Stockholm, in winter for the warming up and the domestic hot water and the possibility to cover this demand with a wind turbine.
Moreover, considering the whole year, the energy demand also for the cooling has been analyzed and the simulation results have been compared to the energy demand of the same house located in Milan, Italy. To reach the goal some simulations have been run changing some house parameters to figure out the influence of these in the energy demand.
Finally economic analysis have been done through the calculation of the payback period of the system considering different wind turbines, 18m and 24m poles and the system with ( scenario 1) and without ( scenario 2) a battery bank.
Results showed that the winter energy demand of a 153 m2 detached house in Stockholm, if heating and DHW were considered, was 4547 kWh and that an 8kW wind turbine with an 18m pole met the house needs in scenario 1 and the Pay Back Period (PBP) is 71 years while referring to scenario 2 the PBP is 50 years considering a battery of 0,5 Days of Autonomy (DA).
ii
TABLE OF CONTENTS
1 INTRODUCTION ... 1 1.1 Background info ... 1 1.2 Literature review ... 2 1.2.1 Energy in Sweden ... 21.2.2 Energy use in the detached house ... 4
1.2.3 Wind energy ... 6
1.3 Knowledge gaps and research questions ... 11
1.4 Objective of the thesis ... 13
2 SYSTEM DESCRIPTION AND METHODOLOGY ... 15
2.1 Studied system ... 15
2.2 Methodology ... 17
3 THE HEAT DEMAND OF A DETACHED HOUSE ... 18
3.1 Model description ... 18
3.1.1 IDA ICE model ... 20
3.1.2 Assumptions and input ... 21
3.2 Simulation results about the heat demand ... 33
3.2.1 Run A: base case VS concrete case ... 35
3.2.2 Run B: base case VS empty case ... 37
3.2.3 Run C: base case VS with obstacles case ... 38
3.2.4 Run D: base case VS north-facing case and east-facing case ... 40
3.2.5 Run E: base case VS less windows case... 41
3.2.6 Run F: base case VS 1 and 2 glazed windows case ... 42
3.2.7 Run G: base case VS no thermal bridges case ... 44
3.2.8 Run H: base case VS tilted ceiling case ... 46
3.2.9 Run I: base case VS different percentages of internal gains cases ... 47
3.2.10 Run L: base case VS different set points cases ... 48
3.2.11 Run M: base case VS different locations cases ... 50
3.2.12 Simulations for whole year: Stockholm and Milan ... 52
3.3 Sensitivity study ... 54
4 FEASIBILITY STUDY OF THE WIND POWER DRIVEN HEAT PUMP ... 56
iii
4.1.1 Model description ... 57
4.1.2 Model validation ... 58
4.2 System design ... 59
4.3 Economic analysis... 61
4.3.1 Wind turbines – capacity factor, wind energy factor and producibility factors ... 61
4.3.2 Scenario 1: grid connected ... 62
4.3.3 Scenario 2: grid connected with battery storage... 67
5 CONCLUSIONS ... 72
6 ACKNOWLEDGEMENT ... 73
7 REFERENCES ... 73
8 FIGURES ... 75
1
1
INTRODUCTION
1.1 Background info
The objective of this master thesis is to investigate and calculate the energy demand for the heating and the domestic hot water (DHW) in winter months of a detached house in Stockholm and to find the possibility to cover this demand by a wind turbine driven heat pump, considering a grid connected system without a battery storage. The tasted period is defined as the months from October to March.
The single-family house model was built by SketchUp software then imported in IDA ICE software and it is based on a typical design currently being constructed in Sweden. Buildings have to respond to local climate and site conditions to maximize building users comfort and health while minimizing energy use. To carry out the analyses, the detailed building simulation program IDA ICE was used, which allows variation of many parameters in the building model. Many energy comparisons have been made looking for the best design parameters for the detached house in Stockholm and other comparisons have been made considering the dwelling in different locations around the globe.
Afterwards, the energy demand for the same detached house, considering the whole year instead of the winter season, has been treated and the predicted demand was compared with the results obtained for the same house located in Milan; in this case also the cooling demand has been considered.
After the energy demand evaluation, the possibility to fulfill it with the wind power has been investigated. Different Wind Turbines (WTs) have been considered and TRNSYS software has been used to determine the power output of a specifically WT. For the validation of the obtained results by the computer program, simulation data of the 1kW WT were compared to site measurements. Subsequently the energy demand was compared with the obtained wind power data and for the seasonal period it was noticed that only a nominal rate WT of 7kW, or more, can be used to cover the demand, while for the monthly analysis the one of 7kW is not sufficient. Afterwards the Capacity Factor, the Wind Energy Factor and Efficiency Factors have been evaluated to investigate the WTs potentiality.
Finally, economic analyses for the whole year have been made, considering different wind turbines, different WTs poles and the detached house located in Stockholm and in Milan. After that, considering the heat pump system driven by an 8 kW grid connected wind turbine with battery storage, the PBP has been calculated and afterwards a PBP comparison with the system without the battery storage has been made.
2
Outdoor climate data were obtained by the computer program Meteonorm, which simulates climate data worldwide.
1.2 Literature review
1.2.1 Energy in Sweden
World energy use has increased enormously over the last century, driven by a rising population, industrialization and economic growth. Nevertheless, there are major differences in energy use between countries: per capita energy use in China, for example, is three times greater than that in Kenya. A Swede, in turn, uses almost three times as much energy as does a Chinese: 16,000 kWh per person per year. Only a few countries have higher electricity consumption.
Up until the end of the 1970s, Sweden was dependent to a large extent on oil and afterwards the oil crisis; it has invested heavily in the search for alternative energy sources. Its phase-out of oil has proceeded smoothly. In 1970, oil accounted for over 75 percent of Swedish energy supply; by 2009, the figure was just 32 percent, chiefly due to the declining use of residential heating oil [2]. Today, a big percent of Sweden’s energy supply (electricity, district heating and fuel) comes from renewable energy, more than in most EU countries. The reason for this is the large share of hydropower and biofuels in the energy system. Since early 2009, there has been an EU directive to promote the development of renewable energy sources. Based on the directive, Sweden has set a target to increase its share of renewable energy to 50 percent by 2020 [2].
The Renewables Directive (2009/28/EC) requires 20 % of all energy used in the EU to be supplied from renewable sources by 2020. The Directive also sets out targets for country by country achievement of this target which, for Sweden, requires the country to be meeting 49% of its energy requirement from renewable sources. Sweden has further raised this target to providing at least 50% of its final energy use from renewable sources.
In 1990, 33% of Sweden’s energy was coming from renewable sources, in 1995 36%, in 2000 38%, in 2005 41% and has since then increased to 48% in 2010 [3]. Much of this increase is due to greater use of biofuels, particularly for the production of electricity and heat, and by the forest industry. Recent years have also seen an increase in the use of heat pumps, in turn contributing to a greater proportion of energy from renewable sources.
Sweden consumes a substantial amount of electricity per capita, only a few countries have higher electricity consumption, yet Swedish carbon emissions are low compared to other countries. The average Swede releases 5.3 tons of carbon dioxide per year into the atmosphere, compared with the EU average of 8.1 tons and the US average of 19.0 tons.
The reason for this low emission rate is that about 85 percent of electricity in Sweden comes from nuclear power and hydroelectric power, neither of which generates carbon emissions.
3
Figure 1. Proportion of energy use in Sweden from renewable sources, 1990–2012.
Cogeneration, or combined heat and power (CHP), plants account for a further 12 percent of the electricity output in Sweden, and these are mainly powered by biofuels. The remaining portion of electricity, about two percent, comes from wind power [2].
Figure 2. Sweden’s electricity production, 2009 (TWh) [2].
Nuclear power has been controversial in Sweden for decades. Following the oil crisis, Sweden had a rapid expansion of nuclear power to reduce its dependence on oil. The expansion of the nuclear industry started with the construction of Sweden’s first reactor Oskars-hamn 1 in 1972. Since then, 12 more reactors have been constructed. However, the Three Mile Island accident triggered the 1980 referendum on nuclear power and on basis of the referendum, the Swedish Parliament decided in 1980 to aim for a shut-down of all reactors by 2010. Decommissioning of nuclear power would require new sources of energy; it was this replacement of nuclear power that was the rationale behind renewable energy programs in Sweden [4].
0 10 20 30 40 50 60 70 80 90 100 1990 1995 2000 2005 2012 Ener gy f rom renew ab le sour ces [% ]
4
In 2003, green electricity certificates were introduced in Sweden to encourage the use of renewable energy. To be certified green, the electricity has to come from wind power, wave power, solar energy, geothermal energy, biofuels or small hydroelectric plants.
The goal is to boost renewable electricity by 25 TWh from 2002 to 2020. Between 2002 and 2009, renewable electricity increased by 8.2 TWh under the scope of the electricity certificate system, with biofuels representing about 67 percent of this and wind power 24 percent.
Wind power has been the fastest-growing source of renewable energy in recent years [2].
1.2.2 Energy use in the detached house
The building sector consumes a considerable part of the total energy consumption that is approximately one third of the world’s energy consumption. Population growth, increasing demands for building services, higher comfort requirements and increasing indoor activities are reasons that contribute to a raising energy demand in the future.
Sweden's national goal is to reduce the consumption of energy in buildings by 20% up to 2020, and by 50% up to 2050, in comparison with the levels for 1995. Energy efficiency in buildings can be reached by minimizing transmission and ventilation heat losses by using high insulation building envelope with good air tightness or by using energy saving equipment like heat pumps or heat recovery ventilation [10].
Almost 60% of energy use in the sector is used for space heating and domestic hot water production. As this is affected by temperature conditions, there can be relatively substantial variations in energy demand from year to year. A cold winter increases the energy demand for heating, and vice versa.
5
The use of electricity for heating in the sector increased from 5 TWh in 1970 to 29 TWh in 1990, reaching a peak at the beginning of the 1990s, and then falling. In 2010, 20 TWh of electricity were used for heating. Important reasons for the fall in the use of electric heating are the relatively high prices of electricity, together with the availability of conversion grants, which have given strong incentives to convert to alternatives in the forms of heat pumps, district heating or pellets.
Residential buildings and commercial premises used a total of 85 TWh for space heating and domestic hot water production in 2010; of this, 42% was used in detached houses, 32% in apartment buildings and 26% in commercial premises. Electricity is the commonest form of energy carrier for space heating and domestic hot water production in detached houses, delivering a total of 16 TWh in 2010. The number of detached houses for which heat pumps were being installed increased steadily during the 1990s, so that by 2010 some form of heat pump was in use in 46% of the country’s detached houses [1].
Moreover reducing CO2 emitting combustion of fossil fuels as much as possible is effective to prevent global warming. From this point of view, heat pumps have a great advantage of no burning fuels at places of use of heat. Furthermore, heat pumps efficiently utilize clean and inexhaustible unused energy such as “heat in air” and “heat in the ground”, which exist everywhere. As heat pumps make unnecessary to burn fossil fuels, they significantly reduce CO2 emission in large quantity, and are very effective as a measure to prevent global warming [11].
Generally, the heat pump produces 3kWh of thermal energy using 1kWh of electricity.
Heat spontaneously flows from warmer places to colder spaces. A heat pump can absorb heat from a cold space and release it to a warmer one, and vice-versa. Reversible heat pumps work in either thermal direction to provide heating or cooling to the internal space [13].
In heating mode, the outdoor coil is an evaporator, while the indoor is a condenser. The refrigerant flowing from the evaporator (outdoor coil) carries the thermal energy from outside air (or soil) indoors, after the fluid's temperature has been augmented by compressing it. The indoor coil then transfers thermal energy (including energy from the compression) to the indoor air, which is then moved around the inside of the building by an air handler. Alternatively, thermal energy is transferred to water, which is then used to heat the building via radiators or under floor heating. The heated water may even be used for domestic hot water consumption. The refrigerant is then allowed to expand, cool, and absorb heat to reheat to the outdoor temperature in the outside evaporator, and the cycle repeats. This is a standard refrigeration cycle, save that the "cold" side of the refrigerator (the evaporator coil) is positioned so it is outdoors where the environment is colder [13].
In cooling mode the cycle is similar, but the outdoor coil is now the condenser and the indoor coil (which reaches a lower temperature) is the evaporator. This is the familiar mode in which air conditioners operate [13].
6
1.2.3 Wind energy
Wind energy is the kinetic energy of air in motion. Total wind energy flowing through an imaginary area A during the time t is:
Formula 1.
Where ρ is the density of air; v is the wind speed; Avt is the volume of air passing through A (which is considered perpendicular to the direction of the wind); Avtρ is therefore the mass m passing per unit time. Note that ½ ρv2 is the kinetic energy of the moving air per unit volume. Power is energy per unit time, so the wind power incident on A (for example equal to the rotor area of a wind turbine) is:
Formula 2.
Wind power in an open air stream is thus proportional to the third power of the wind speed; the available power increases eightfold when the wind speed doubles. Wind is the movement of air across the surface of the Earth, affected by areas of high pressure and of low pressure. The surface of the Earth is heated unevenly by the Sun, depending on factors such as the angle of incidence of the sun's rays at the surface (which differs with latitude and time of day) and whether the land is open or covered with vegetation. Also, large bodies of water, such as the oceans, heat up and cooling slower than the land. The heat energy absorbed at the Earth's surface is transferred to the air directly above it and, as warmer air is less dense than cooler air, it rises above the cool air to form areas of high pressure and thus pressure differentials. The rotation of the Earth drags the atmosphere around with it causing turbulence. These effects combine to cause a constantly varying pattern of winds across the surface of the Earth [3].
Wind energy is the fastest growing renewable electricity resource in Sweden. In May 2001 there were 534 wind power units. The number of wind power plants has steadily increased and there were a total of 620 wind power plants at the end of 2002. The contribution of wind power to the electrical energy generated in 2002 was 0.6 TWh, an increase of 20% on 2001, and accounted for 0.4% of the total electricity generation in 2002. Figure 4 shows the steady increase of energy generation by wind power in recent years [4].
Despite of the fact that Sweden has rich water resources; future expansion of hydropower is, however, limited due to the legislated protection of the few remaining large rivers.
Biomass and wind power are clearly the most important renewable sources of energy in Sweden so far in terms of resources, policy efforts and impact.
7
Figure 4. Electricity generation by energy source in Sweden in 1990, 1996-2001 and forecast for 2010, TWh [4].
Wind power is one of the main options for renewable electricity production for Sweden. In recent years there has been more focus on identifying concrete sites for onshore and offshore wind power [4].
Wind power is the conversion of wind energy into a useful form of energy, such as using wind turbines to make electrical power, windmills for mechanical power, wind pumps for water pumping or drainage, or sails to propel ships.
Large wind farms consist of hundreds of individual wind turbines which are connected to the electric power transmission network. Offshore wind is steadier and stronger than on land, and offshore farms have less visual impact, but construction and maintenance costs are considerably higher.
Figure 5 displays the development of offshore wind power capacity in Europe since 1998 and onwards. The growth in installed capacity has been high during this period, albeit from very low levels at the end of the 1990s. At the end of 2009, total installed European offshore wind power capacity amounted to 2056 MW, representing about 2 percent of total wind power capacity in Europe. Globally Europe is a dominant player in the offshore wind sector and the associated production of turbines; as late as in 2007 European producers supplied turbines to all offshore wind power projects worldwide [18].
8
Figure 5. Cumulative and annual offshore wind installations (MW), 1993-2012 [30].
The 293 turbines installed in 2012 represent 1,165 MW, an increase of 33% compared to 2011 installations of 874 MW. This brings total offshore wind energy capacity to 4,995 MW. Overall, the UK remains the leader with nearly 60% of Europe's total offshore capacity, followed by Denmark (18%), Belgium (8%) and Germany (6%); in 2012 Sweden accounted for about 3 percent of total European capacity installed [23].
Figure 6. Offshore wind power installations by country, 2012 [30].
Wind power, as an alternative to fossil fuels, is plentiful, renewable, widely distributed, clean, produces no greenhouse gas emissions during operation and uses little land. The effects on the environment are generally less problematic than those from other power sources. Wind power is very consistent from year to year but has significant variation over shorter time scales.
Wind power accounted for approximately 2.4% of the electricity use in Sweden in 2010 that has wind power potential of 510 TWh/a at land and 46 TWh/a at sea [3].
Today, the most popular wind generators, have become an integral part of our landscape; the smallest turbines are used for applications such as battery charging or auxiliary power on boats; while large grid-connected arrays of turbines are becoming an increasingly important source of wind power-produced commercial electricity.
9
Nowadays, wind turbines are manufactured in a wide range of vertical and horizontal axis types; when the wind spins the blades of the wind turbine, a rotor captures the kinetic energy of the wind and converts it into rotary motion to drive the generator. Most turbines have automatic over speed-governing systems to keep the rotor from spinning out of control in very high winds.
Figure 7. Wind turbine configurations [31].
Horizontal axis wind turbines (HAWT) have their axis of rotation horizontal to the ground and almost parallel to the wind stream. Horizontal axis machines have some distinct advantages such as low cut-in wind speed and easy furling. In general, they show relatively high power coefficient. However, the generator and gearbox of these turbines are to be placed over the tower which makes its design more complex and expensive. Another disadvantage is the need for the tail or yaw drive to orient the turbine towards wind.
Depending on the number of blades, horizontal axis wind turbines are further classified as single bladed, two bladed, three bladed and multi bladed. Single bladed turbines are cheaper due to savings on blade materials.
The drag losses are also minimum for these turbines. However, to balance the blade, a counter weight has to be placed opposite to the hub. Single bladed designs are not very popular due to problems in balancing and visual acceptability. Two bladed rotors also have these drawbacks, but to a lesser extent. Most of the present commercial turbines used for electricity generation have three blades [20].
10
Figure 8. Single bladed, two bladed, three bladed and multi bladed turbines [20].
The axis of rotation of vertical axis wind turbine (VAWT) is vertical to the ground and almost perpendicular to the wind direction. The VAWT can receive wind from any direction. Hence complicated yaw devices can be eliminated. The generator and the gearbox of such systems can be housed at the ground level, which makes the tower design simple and more economical. The major disadvantage of some VAWT is that they are usually not self starting. Additional mechanisms may be required to ‘push’ and start the turbine, once it is stopped.
Human intervention of any nature has its on environmental consequences. Wind energy is not an exception. Although wind is one of the cleanest sources of energy and does not pollute the environment with harmful gases during its energy conversion process, wind energy systems pose some environmental problems [20].
The major environmental consequences of wind energy conversion are: - risk to avian species
- noise emission - visual impacts
All wind turbines with horizontal axis, beyond the size (micro, mini or large) and models, have three basic components:
The rotor component, which includes the blades for converting to low speed rotational energy. The blades are basically the sails of the system; in their simplest form, they act as barriers to the wind. When the wind forces the blades to move, it has transferred some of its energy to the rotor.
The nacelle, which houses a generator and gearbox. The spinning blades are attached to the generator through a series of gears. As the generator spins, electricity is produced. Generators can be either variable or fixed speed.
The structural support component which includes the base, the tower and rotor yaw mechanism. The most common tower design is a white steel cylinder, about 150 to 200 feet tall and 10 feet in diameter. Bases are made of concrete reinforced with steel bars [21].
11
Figure 9. Wind turbine parts [21].
The productivity of a wind turbine is referred to as the capacity factor. The capacity factor is the amount of power produced in a given time period compared to what the generator could produce if it ran at full capacity for that time period. If a generator ran full out all the time, it would have a capacity factor of 100 percent, but no power plant runs all the time [21].
1.3 Knowledge gaps and research questions
In this study a system composed by a wind turbine grid connected driven heat pump to supply the energy demand for the heating and the domestic hot water during the winter period of a 153 m2 detached house in Stockholm has been investigated. The assumed household is a south-facing family-house, composed by two floors.
The dwelling is equipped with a heat pump, which utilizes wind electricity production. The main purpose of this study was to evaluate the energy performance of the house during the winter period in which the energy demand is more than in the rest of the year due to the cold Swedish climate. The energy demand during the tested period was compared between results from the base case and other cases where input data such as internal heat gains, materials, locations etc. have been changed. The energy demand is determined by a wide range of factors and in this thesis some of those have been analyzed.
The thermal energy demand was calculated by IDA ICE, a building energy simulation (BES) program and for the selected winter months predicted, the request was 4547kWh. The energy demand depends on indoor temperature, outdoor temperature, speed and direction of wind, thermal properties of building envelopes, type of ventilation system as well as tightness and orientation of buildings.
12
Supply heat depends on active and passive heating, that is internal heat (released by people based on activity level, by lightening, and by equipment) and external heat (released by solar radiation through windows). Many simulations have been made looking for the best design parameters for the detached house and other simulations have been made in different locations like Kallax, Beijing, Stavanger, New York and Milan whose climate data were obtained from the computer program Meteonorm, which simulates outdoor climate data for the entire world. The assessment period is from October to March.
The possibility to cover the energy demand of the house during the winter period using wind power considering 1, 3, 5,6,7,8, and 10kW wind turbines has been analyzed. It has been shown that only the last three turbines can cover the energy demand for the whole period, and after a monthly analysis that only four months can be covered by the 7kW wind turbine and only three by the one of 6kW. Afterwards a comparison between the annual energy demand for heating, cooling and DHW in Stockholm and in Milan has been made.
Moreover the 8kW wind turbine system with battery storage has been analyzed.
Site measurements in Köping have been made for the validation of wind turbines simulation results. Finally the payback period (PBP) has been calculated and compared considering the 7 and 8 kW WTs in Stockholm and in Milan and 18m and 24m poles WTs. In addiction a system composed by an 8kW wind turbine and a battery bank has been treated and varying the battery type, costs and benefits comparisons have been done between the system with and without battery storage. Unlike from Italy, in Sweden there is no possibility to sell the energy but despite this, also that case has been studied for the system without battery.
13
1.4 Objective of the thesis
The objective of this thesis was to evaluate the energy demand for the heating and the DHW in winter for a detached house in Stockholm and to find a possibility to cover the request by a grid connected wind turbine.
The goal was achieved by the 7, 8 and 10kW WTs in a seasonal analysis and by the 8 and 10 kW WTs on a monthly one.
The steps followed to reach the goal were:
• making comparisons about the energy demand between the base case and the same household where some input parameters have been changed for each case. The cases analyzed are listed in the Table 1.
Table 1. Seasonal comparisons carried out.
RUN A: base case VS concrete case RUN B: base case VS empty case
RUN C: base case VS with obstacles case
RUN D: base case VS north facing case and east-facing case RUN E: base case VS less windows case
RUN F: base case VS 1 and 2 glazed windows cases RUN G: base case VS no thermal bridges case RUN H: base case VS tilted ceiling case
RUN I: base case VS different percentages of internal gains cases RUN L: base case VS different set points cases
RUN M: base case VS different locations cases
• comparing different wind turbines production (1,3,5,6,7,8,10 kW) to the base case energy demand;
• validating the wind turbines simulations results obtained by TRNSYS with site measurements.
14
Afterwards, looking for the best economic choice the following steps have been treated:
• the household energy demand for the heating, the DHW and for the cooling in Stockholm and Milan for the whole year.
• the wind turbines Capacity Factor (CF), Wind Energy Factor (WEF), producibility and maximum producibility Factors;
• economic analyses through the PBP evaluation for the systems listed in the following Table.
Table 2. Systems for which a PBP evaluation has been done.
7 and 8kW WTs (18m pole) grid connected without battery located in Milan 7 and 8kW WTs (18m pole) grid connected without battery located in Stockholm
7 and 8kW WTs (18m pole) grid connected without battery with the possibility to sell the electricity located in Stockholm
7 and 8kW WTs (24m pole) grid connected without battery located in Milan 7 and 8kW WTs (24m pole) grid connected without battery located in Stockholm
7 and 8kW WTs (24m pole) grid connected without battery with the possibility to sell the electricity located in Stockholm
8kW WT (18m pole) grid connected with battery (DA=0,5) located in Stockholm 8kW WT (18m pole) grid connected with battery (DA=1) located in Stockholm 8kW WT (18m pole) grid connected with battery (DA=2) located in Stockholm
15
2
SYSTEM DESCRIPTION AND METHODOLOGY
2.1 Studied system
Renewable energy power generation systems (PV systems, wind turbines, biogas power generation systems) are usually built at locations close to the end users to fulfill their own electricity needs, or supplement part of their electricity needs. Renewable energy power generation systems can be designed either as standalone systems or grid-connected systems [5].
For a standalone system, storage batteries are often required, in particular for renewable energy types which are intermittent in nature, such as solar energy or wind energy. When energy level is deficient, the stand-alone wind power system can not ensure the balance between produced powers and powers required by the load. Otherwise, when power developed by the wind generator exceeds the load consumption, the excess power will be dissipated [6].
In remote locations, stand-alone systems can be more cost-effective than extending a power line to the electricity grid; but these systems are also used by people who live near or on the grid. Successful stand-alone systems generally take advantage of a combination of techniques and technologies to generate reliable power, reduce costs, and minimize inconvenience. Some of these strategies include using fossil fuel or renewable hybrid systems and reducing the amount of electricity required to meet the needs [7].
Figure 10. Off-Grid Wind Turbine System composed by: wind turbine on a tower, wind turbine charge controlling system, battery bank to store a reserve of energy to be used by the home, inverter to convert
battery electric to household power [29].
A grid-connected system allows powering a home with renewable energy during those periods when the sun is shining, the water is running, or the wind is blowing. Any excess electricity produced is fed back into the grid. When renewable resources are unavailable, electricity from the grid supplies the needs [8].
16
Figure 11. On Grid Wind Turbine System composed by: wind turbine on tower, grid-tie inverter, and utility meter to track how much energy is fed into the electric grid [29].
In this thesis a grid connected system without battery has been considered (scenario1) for the building hot water, heating and cooling loads, but for one of the economic analysis battery storage has been added to the system (scenario2).
Renewable energy utilizations for buildings are important ways toward zero energy consumption and zero emission buildings. As common renewable energy, wind can be used especially in the Nordic countries where wind energy is richer than the solar energy. Therefore, wind utilization for building heating and cooling is a promising technology for sustainable development. As another common technology for energy saving, heat pumps can be coupled with renewable energy to improve the system efficiency [34]. The wind turbine which drives a heat pump to supply the energy demand is connected to an inverter which converts the produced direct current into alternating current electricity. Afterwards this is conducted to the grid or to the house. In Figure 12 are schematized the two systems considered.
The wind power subsystem provides electricity for the heat pump. If the heat pump power demand exceeds the wind power generation, the excess heat power is satisfied by grid power. If the wind power generation exceeds the heat pump power, the excess wind power can’t supply electricity for other domestic appliances but it’s fed back into the grid. Therefore, the system, can provide hot water, heating and cooling but not electricity [34].
17
Figure 12. Systems scheme.
Heat pumps use electricity to move heat from a cool space to a warm space, making the cool space cooler and the warm space warmer. During the heating season, heat pumps move heat from the cool outdoors into your warm house and during the cooling season, heat pumps move heat from your cool house into the warm outdoors. Because they move heat rather than generate heat, heat pumps can provide up to 4 times the amount of energy they consume [8].
2.2 Methodology
• The background information have been gathered by literature review especially using internet, scientific articles and books;
• the 3D building modeling has been done by the use of SketchUp and IDA Indoor Climate and Energy (IDA ICE);
• simulations have been carried out by IDA ICE;
• the weather files reference have been extrapolated by Meteonorm;
• TRNSYS has been used to simulate wind power (1,3,5,6,7,8,10 kW WTs), grid energy and state of charge (SOC) of the batteries;
18
3
THE HEAT DEMAND OF A DETACHED HOUSE
3.1 Model description
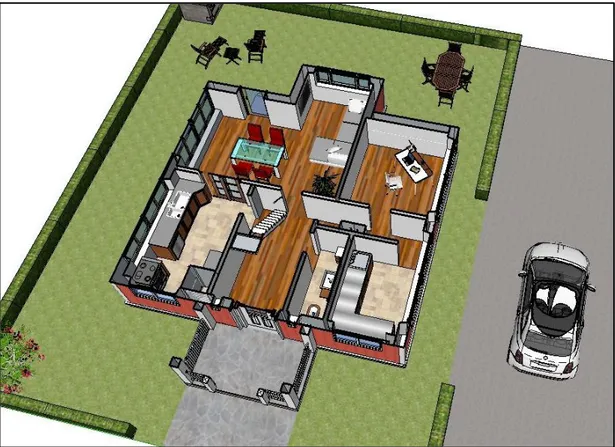
In this study a system composed by a wind turbine driven heat pump to supply the energy demand of a 153 m2 detached house in Stockholm was investigated. The model is a Swedish south-facing household composed by two floors and assumed for 4 people. The considered heating season begins on October and ends on March.
An accurate observation of typical Swedish houses was conducted to create the dwelling in a realistic way by using SketchUp software.
Figure 13. Detached house 3D representation, SketchUp.
The house chosen includes one living room, one kitchen, one laundry, two bathrooms, one office, two kid’s rooms, one double bedroom, one hall way and one relax room. Figures 14 and 15 present the house floor plants.
19
Figure 14. Detached house ground floor representation, SketchUp.
20
3.1.1 IDA ICE model
Based on SketchUp design the IDA ICE model has been built starting from the geometry definitions.
Figure 16. Ground floor plan, IDA ICE.
21
3.1.2 Assumptions and input
The mean door of the house has a size of 2.2m x 1.5m and the back door that is in the opposite side of the main one is 2.1m x 1m; both are marked as never open because of a very short time of opening every day. Doors inside the house have a size of 0.7m x 2m, unless the one between the living room and the kitchen that is 1.4m x 2m and marked as always open.
Lighting with a power of 50W was chosen for each unit, and the house has two units in each zone unless in the kitchen and in the living room where there are 3 units, in the relax zone where there are 5 units and in the laundry where there is only one unit.
Triple glazed windows were chosen with different sizes that are shown in the Table 3.
Table 3. Windows dimensions and location.
Bedroom1 1.45m x 1.247m (n. 19)
1.45m x 0.623m (n. 10)
Bedroom2 two of 1.45m x 1.247m (n. 17-18)
Double room two of 1.45m x 1.247m (n. 14-15)
Bathroom2 1.45m x 1.247m (n. 13) 1.45m x 0.623m (n. 12) Relax zone 2.6m x 1.2m (n. 11) 2m x 1.247m (n. 16) Kitchen 1.45m x 1.247 (n. 1) 2.9m x 1.247m (n. 9) Living room 2.9m x 1.247m (n. 8) 2m x 1.247m (n. 7) Office 2.9m x 1.247m (n. 6) Laundry two of 1.45m x 1.247m (n.4-5) Bathroom 0.25m x 0.96m (n. 3) Hall way 0.25m x 0.96m (n. 2)
22
All the house characteristic parameters have been defined in the “general section”.
The base case detached house location is Stockholm and the relating climate data were provided by Meteonorm software.
Figure 19. General table, IDA ICE.
In Defaults section, the envelope of the house, including the walls, the slabs and the roof has been
defined. These different elements with their materials, thickness and U-value (thermal resistance) in W/ (m²K) are shown in Figure 20.
Regarding the different U-values, the wall and the roof have the best performance in comparison with the floor. Lower U-values for the building envelope, lower heating energy demand is required. To have low U-values of a building envelope, thicker insulation or insulation material with lower thermal conductivity should be used.
23
Table 4. Basic data of the detached house.
Total floor area 153m2
Total external wall area 142.6 m2 Total windows area 38.9 m2 Total heated volume 374.8 m3 Ceiling height, ground floor 2.5 m Ceiling height, upper floor 2.4 m Average U-value 0.5028 W/m2 K
Window SHGC 0.68, U-value 1.9 W/m2 K Air tightness 0.5 ACH
An ideal heater for each room has been chosen. The ideal heater is a room unit that heats the zone when no detailed information about an actual room unit, such as a radiator or convector, is available or this amount of detail is unmotivated. They have no given physical location on any room surface and are not connected to the plant of the building. Physically, think of it as a standalone fuel or electric heater with fixed performance parameters and no flue gas emissions [16].
Building orientation and definition of separate shading objects, like trees, hills and neighboring buildings are defined in Site shading and orientation; the base case is south-facing and no objects have been considered around it.
24
Figure 20. House envelope materials, IDA ICE.
In the Thermal bridges section typical values provided by the software have been chosen. Even if each construction (wall, floor, roof, etc) is well insulated, so-called thermal bridges increasing the heat transfer. They are a part of building envelope which conduct more heat than the surrounding details. In order to achieve proper U-values of the building envelope thermal bridges should be avoided in all parts of the envelope to reach very low energy consumption. Usually thermal bridges can be found in the places where different parts of building envelope meet each other. Another reason why thermal bridges should be avoided is the low local temperatures in the internal surfaces. These low temperatures can be the reason for the mould growth or the condensation of moisture and worsening of the indoor air quality.
25
Figure 21. Thermal bridges section, IDA ICE.
Afterwards, default efficiencies for heating, cooling and domestic hot water COP generation were chosen equal to one to evaluate, in the following chapter, the electric energy demand values in a dynamic way. In Ground properties section are defined model and parameters for temperature conditions below the building. The ground was modeled according to ISO-13370 for determining the heat transfer between building and ground. In ISO-13370 1 m layer of earth and 0.1 m layer of insulation were assumed beneath the ground level floor of the buildings, and together with a constant ground temperature of 6.8 °C when no whole-year climate file has been selected.
Figure 22. Ground properties section, IDA ICE.
In Infiltration section, method and parameters for building air leakage are shown as can be seen in the following screenshot.
26
Figure 23. Infiltration section, IDA ICE.
An airtight building envelope is a requirement for efficient house. The guide on energy-efficient ventilation, published by the IEA Air Infiltration and Ventilation Centre, indicates that at a pressurization/depressurization of 50 Pa, an air change rate below 3 ach (air change per hour) is recommended; but in Sweden as in Switzerland, even below 1.0 ach is recommended or required [14]. In Pressure coefficients, the coefficients for calculation of wind pressure on external surfaces of the building are written and in Extra energy and losses, losses from HVAC distribution systems, hot water and other energy use items.
Figure 24. Extra energy and losses section, IDA ICE.
The water consummation is 50 liters per person per day, to ensure the basic needs for drinking, cooking and cleaning.
In the simulation model, the heating set point is 21 °C and the cooling one is 25 °C, but in the base case the house does not contain a cooling system.
27
Living conditions, especially temperature, humidity, noise level, dust etc. are very important factors affecting not only the perception of the local environment, but influencing also the residents operability and their health. Already Fanger's Model from 1972 pointed out that indoor conditions such as air temperature, air velocity, mean radiant temperature, and relative humidity as well as personal clothing insulation and activity level directly influence the comfort level. According to ANSI/ASHREA standard 55-1992 a comfort zone lies between 20 and 26 °C temperature and between 30 and 60% relative humidity. Lower temperatures cause blood capillaries to constrict slowing down the blood circulation. This not only makes the skin colder, but also reduces the efficiency of the respiratory system in protecting us against bacteria. It is known that lower temperatures occur in poorly insulated buildings or around thermal bridges where intensive heat flow is detected.
The contribution of each person to internal heat gain depends on the activity level; that for each room has been defined, consequently the number of people, according to the average values of 0.7 for sleeping, 1 for seating and 1.8 for cooking.
Table 5. Activity levels chosen.
Kitchen 1.8 Laundry 1.4 Bathroom 1.2 Office 1 Living room 1.4 Bedroom1 1.0 Bedroom2 1.0 Double room 1.0 Hall way 2.0 Bathroom2 1.0 Relax zone 1.4
In order to do a good simulation, it is very important to define realistic and believable schedules for occupants, equipment and lighting, that could be very different from family to family corresponding to the lifestyle of townspeople.
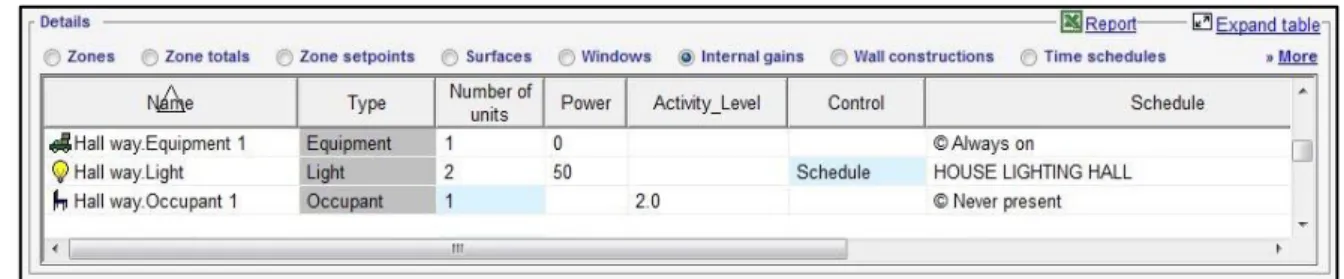
It was assumed that in each room the lights are almost always on when the room is occupied; moreover some equipment runs full-time, others part-time. The percentage of internal gains considered for the simulations is 10% that is actually too low but it’s a safe value for a winter period.
28 KITCHEN:
Figure 25. Kitchen internal gains.
Figure 26.Kitchen, occupant and lighting schedules.
LAUNDRY:
Figure 27. Laundry internal gains
29 BATHROOMS:
Figure 29. Bathrooms internal gains.
Figure 30. Ground floor bathroom, occupant and lighting schedules.
30 OFFICE:
Figure 32. Office internal gains.
Figure 33. Office, occupant and lighting schedules.
LIVINGROOM:
Figure 34. Living room internal gains.
31 KIDS BEDROOMS:
Figure 36. Kids Bedrooms internal gains.
Figure 37. Kids bedrooms occupant and lighting schedules.
DOUBLE ROOM:
Figure 38. Double room internal gains.
32 HALL WAY:
Figure 40. Hall way internal gains.
Figure 41. Hall way, occupant and lighting schedules.
RELAX ZONE:
Figure 42. Relax zone internal gains.
33
3.2 Simulation results about the heat demand
The goal of this project was to investigate the heating and hot water energy demand of the household designed.
Figure 44. Detached house 3D representation, IDA ICE.
The simulation of cooling load was not important here since in northern countries, the most part of one-family house does not have a cooling system. For the heating load the simulations results are given month per month by the software and the obtained values of the base case are shown in the Table 6. Assessments and comparisons have been based on heating and DHW results.
Table 6. Base case energy demand [kWh].
Month Lighting Cooling HVAC aux Heating Domestic hot
water Equipment (kWh) (kWh) (kWh) (kWh) (kWh) (kWh) October 13,5 0 59,9 970,6 417,5 11,8 November 13,1 0 57,7 1715 404 11,4 December 13,9 0 59,4 2171 417,5 12,1 January 13,4 0 59,2 2325 417,5 11,7 February 12,3 0 53,5 1881 377,1 10,7 March 14 0 59,3 1267 416,9 12,1 Total 80,2 0 348,9 10329,6 2450,5 69,7
34
Figure 45. Base case energy demand.
Extrapolating the hourly values from IDA ICE simulation results, the heating and DHW hourly trends have been plotted.
Figure 46. Heating and DHW energy demand hourly data.
The total heating and DHW energy demand obtained for the base case was 12780 thermal kWh that is in agreement with the Swedish average value [26].
To reach the prearranged goal and in order to evaluate their influence in the energy demand, the building's orientation, some constructive parameters, the location and the internal heat gains were changed one at a time while other parameters were kept the same; 11 simulation runs have been performed. 0 500 1000 1500 2000 2500 3000
OCT NOV DEC JAN FEB MAR
Ene rgy de m a n d [k W h ] Lighting Cooling
HVAC aux Heating
Domestic Hot Water Equipment
0 1000 2000 3000 4000 5000 6000 0 1000 2000 3000 4000 Ene rgy de m a n d [W h ] Time [h]
35
3.2.1 Run A: base case VS concrete case
A typical Swedish wood house model has been used, but what about the energy demand if the envelope materials are changed into concrete? The change has been made to see the impact that it can create in the energy balance of the house. Indeed, wood was replaced by concrete default constructions for external /internal walls, external/internal floors and roof by loading them from the database.
Figure 47. Concrete case envelope description.
36
Table 7. Heating and DHW energy demand; base case vs concrete case, [kWh].
HEATING + DHW
BASE CASE CONCRETE October 1388,1 1908,5 November 2119 2824 December 2588,5 3429,5 January 2742,5 3641,5 February 2258,1 3052,1 March 1683,9 2399,9 Total 12780,1 17255,5
Figure 48. Heating and DHW energy demand, base case vs concrete case.
The wood house is more efficient than the house made of concrete. The total demand changes by 35% for the whole period. Moreover there are many benefits of using wood in buildings. To tackle climate change, carbon from the atmosphere has to be removed as well as new carbon emissions into the atmosphere has to be reduced and wood manages to achieve both of these. Furthermore, trees and wood products have a unique ability to store carbon. As trees grow, they take carbon out of the atmosphere. When the trees are harvested and used to make wood products, the carbon remains stored in the wood for the life of the product; 50% of the dry weight of wood is carbon. The production and processing of wood is also highly energy efficient, giving wood products a very low carbon footprint. Moreover wood itself is a natural insulator due to air pockets within its cellular structure and as an insulator wood is 15 times better than masonry, 400 times better than steel, and 1,770 times better than aluminum.
0 500 1000 1500 2000 2500 3000 3500 4000
OCT NOV DEC JAN FEB MAR
Ene rgy de m a n d [k W h ]
37
Lastly, wood construction is fast and efficient and comparative studies of the economics of different wall framing systems indicate that, in terms of direct building expenses, timber frames are consistently the most cost-effective solution [15].
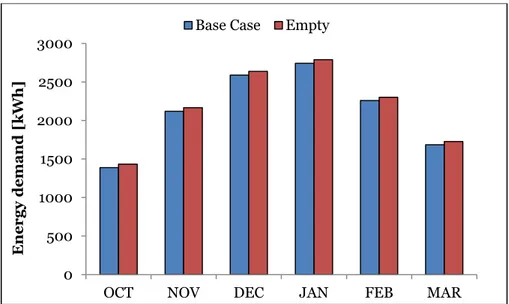
3.2.2 Run B: base case VS empty case
Internal heat gain comes from the collection of heat given off by sources inside the building. People and electrical equipment in buildings give off heat. These internal heat gains must be included in energy balances on the building to determine the net heating or cooling load. The most common sources of internal heat gain are: occupants, equipments and lighting. If the house is considered without those, the energy demand grows up than the base case because of the internal heat gains lack.
Table 8. Heating and DHW energy demand; base case vs empty case, [kWh].
HEATING + DHW BASE CASE EMPTY
October 1388,1 1432,5 November 2119 2165 December 2588,5 2637,5 January 2742,5 2788,5 February 2258,1 2301,1 March 1683,9 1727,9 Total 12780,1 13052,5
Figure 49. Heating and DHW energy demand, base case vs empty case.
0 500 1000 1500 2000 2500 3000
OCT NOV DEC JAN FEB MAR
Ene rgy de m a n d [k W h ]
38
An empty house is obviously less efficient than a house with lights, equipments and occupants and the energy demand is more than the base case because there is not the passive heating contribution. But in this case the demand difference is not so big (2%). The energy consumption is almost the same due to the low heating internal gains contribution considered in the base case (10%) and on the number of occupants, the kind and the number of lights chosen, the equipment considered and of course on the schedules of each internal gain treated.
3.2.3 Run C: base case VS with obstacles case
Many factors influence the energy consumption of buildings, particularly those related to their design and use. Other factors, such orientation and the environmental surroundings also have an influence, but these are often ignored. The energy demand changes if the dwelling is surrounded from obstacles such as buildings, trees or hills.
In this simulation obstacles of 6m height have been considered, not so far from the house.
Figure 50. Detached house with obstacles, IDA ICE.
Table 9. Heating and DHW energy demand; base case vs with obstacles case, [kWh].
HEATING + DHW
BASE CASE OBSTACLES WITH
October 1388,1 1477,5 November 2119 2142 December 2588,5 2601,5 January 2742,5 2761,5 February 2258,1 2311,1 March 1683,9 1858,9 Total 12780,1 13152,5
39
Figure 51. Heating and DHW energy demand, base case vs with obstacles case
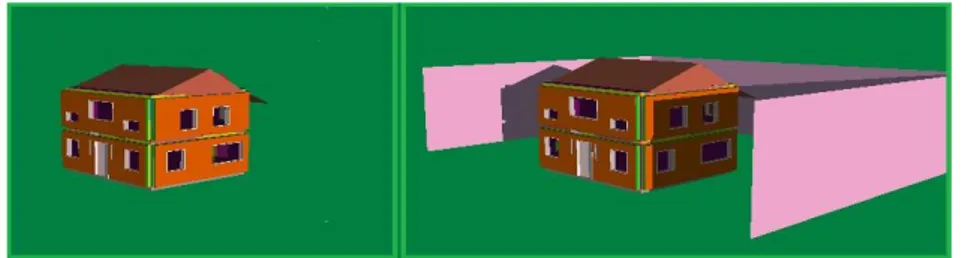
Obstacles cut down the wind speed and reduce the heat transfer from the building surface but the shading effect of obstacles increase the energy demand during the winter by blocking the passive solar gain, indeed the biggest difference between two cases is on March. The picture below is a screenshot of the two cases at 8.00 a.m.
Figure 52. Base case and with obstacles case at 8.00 a.m., IDA ICE.
The total demand changes by 3% for the whole period. It is concluded that there is an increase in heating energy demand if the house is surrounded by obstacles like those chosen.
0 500 1000 1500 2000 2500 3000
OCT NOV DEC JAN FEB MAR
Ene rgy de m a n d [k W h ]
40
3.2.4 Run D: base case VS north-facing case and east-facing case
The orientation of the building influences several aspects related to the energy performance, in particular day lighting and solar gains. In cold climate, heat from the sun has to be captured as much as possible counting that the sun rises in the southeast and sets in the southwest. Simulations were carried out on a south-facing model and in the base case there is more window area exposes to sun direction so more solar heat gain and less energy demand than the north-facing case where the building gets less direct sunshine. The best place for windows is the south side of the house, so the winter sun can reach deep into the living space and warm it up.
The best choice is not south-facing for this dwelling but east-facing because more sun can enter in the house.
Table 10. Heating and DHW energy demand; base case vs north-facing and east-facing cases, [kWh].
HEATING + DHW
BASE CASE NORTH-FACING FACING EAST-October 1388,1 1457,5 1350,8 November 2119 2148 2094 December 2588,5 2610,5 2558,5 January 2742,5 2771,5 2703,5 February 2258,1 2313,1 2218,1 March 1683,9 1801,9 1663,9 Total 12780,1 13102,5 12588,8
Figure 53. Heating and DHW energy demand, base case vs north-facing and east-facing cases.
0 500 1000 1500 2000 2500 3000
OCT NOV DEC JAN FEB MAR
Ene rgy de m a n d [k W h ]
41
The energy demand, for the whole period, changes by over 3% for the north-facing case and under 4% for the east-facing. The difference between these cases is not really high because the glass surface south-facing is 9 m2 in the base case, 8, 6 m2 in the north-facing and 12, 2 m2 for the other one. The best configuration is when the facade with the most significant glazing area is oriented towards the south to increase solar gains during the winter. So by placing windows in an optimal orientation of the dwelling (windows facing south) maximal advantage can be achieved from passive solar gains. In addition, the annual purchased energy can be lower if the windows are oriented in a proper way, because solar energy becomes more significant in spring and in autumn, when the outdoor temperatures are still low, but there are much more solar gains.
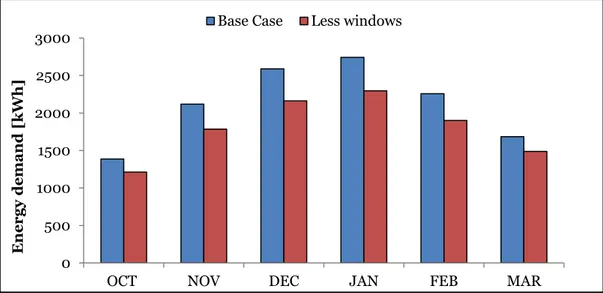
3.2.5 Run E: base case VS less windows case
Since windows are the worst energy leakers in any house, decreasing the percentage of windows over the envelope from 14,8% to 9%, an energy demand reduction is obtained.
Sunlight enters the house through south-facing windows, so avoiding some of north, west and east-facing windows the best solution can be obtained.
Table 11. Heating and DHW energy demand; base case vs less windows case, [kWh].
HEATING + DHW
BASE CASE WINDOWS LESS October 1388,1 1212,1 November 2119 1786 December 2588,5 2162,5 January 2742,5 2295,5 February 2258,1 1900,1 March 1683,9 1488,9 Total 12780,1 10845,1
42
Figure 55. Heating and DHW energy demand, base case vs less windows case.
The total energy demand drops 15% than the base case because windows are the thermally weakest components in a building. By the way, proper window placement encourages good ventilation in the summer and gives light in the house [32]. Hence the better choice is finding a good compromise between these two aspects.
3.2.6 Run F: base case VS 1 and 2 glazed windows case
The energy performance of a window depends on its thermal transmittance, on the glazing solar transmittance and on the air leakage due to the frame and installation air tightness. In new installations air leakage represents a quite small term which is almost independent from the window and in particular from the glazing system selection. The contributions of the two other terms to the building thermal balance are not independent to each other: the most effective thermal insulating glazing, as triple glazings, are generally characterized by low solar transmittance reducing solar gains. The thermal energy balance of the building is then affected not only in summer but also in winter, potentially increasing heating energy need. This could be useful to control solar gains during the summer season and to reduce cooling energy use, but in winter the reduction of solar gains can overcome the reduction of thermal losses and increase the energy needs. The solar gain through a window depends on the thermal transmission (the U-value), the total solar energy transmittance (the g-value) and the area collecting the radiation. Thermal transmission values and total solar energy transmittance values are shown in Table 12.
0 500 1000 1500 2000 2500 3000
OCT NOV DEC JAN FEB MAR
Ene rgy de m a n d [k W h ]
43
Table 12. Glasses properties, base case vs 1 and 2 glazed windows cases.
single glazed double glazed triple glazed
U- value(W/m2K) 5,8 2,9 1,9
g-value 0,85 0,76 0,68
Triple glazed windows choice is the most efficient though cost significantly more. Triple glazing has been the standard for residential building in Sweden for many years.
Table 13. Heating and DHW energy demand; base case vs 1 and 2 glazed windows cases, [kWh].
HEATING + DHW
BASE CASE DOUBLE GLAZED GLAZED SINGLE October 1388,1 1705,5 2824,5 November 2119 2560 3913 December 2588,5 3121,5 4639,5 January 2742,5 3306,5 4881,5 February 2258,1 2750,1 4197,1 March 1683,9 2109,9 3588,9 Total 12780,1 15553,5 24044,5
Figure 56. Heating and DHW energy demand, base case vs 1 and 2 Glazed windows cases.
0 1000 2000 3000 4000 5000 6000
OCT NOV DEC JAN FEB MAR
Ene rgy de m a n d [k W h
44
The total demand changes by 22% and 88% for the whole period and moreover double or triple glazed windows can also block street noise more efficiently than traditional windows. In addition to saving energy and reducing noise transmission, triple-glazed windows increase comfort by raising the temperature of a room’s coldest surfaces in winter. When windows are warmer, the body radiates less heat toward them and feels more comfortable [17].
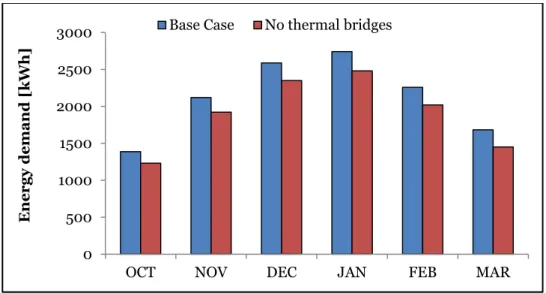
3.2.7 Run G: base case VS no thermal bridges case
A thermal bridge is a building element where a significant change in the thermal resistance occurs compared to that of the envelope, due to the presence of materials with a higher thermal conductivity, as well as to the change in the geometry of the fabric, as in the case of the junction between roofs, floors, ceilings and walls. As a result, a multidimensional heat flow is locally generated, which adds to the heat flow normally transmitted through the envelope surfaces; this means that thermal bridges increase winter heat losses and summer heat gains. The correction of the thermal bridges implies additional costs, not only during the construction of the building, but also during its refurbishment. The correction of the thermal bridges in new buildings is not compulsory, one might wonder whether this operation, carried out on a voluntary basis, is convenient from an economic point of view. Building envelope is designed to protect the inner space from harsh outdoor climatic conditions, hot and cold alike, and hence provides necessary thermal comfort to occupants. In addition, building envelope should be designed and built in a way to reduce energy consumption by air-conditioning (AC) and heating equipment. Reducing energy consumption also reduces adverse impact of power plants on the environment. Thermal bridges, when present, are enemy number one to almost all measures taken to reduce this load. In the cold climate of continental Europe the correction of thermal bridges in buildings is a mandatory issue, as in these areas they produce not only heat losses but frequently also condensation and mould growth. The energy performance of any building component is the result not only of its thermophysical properties but also of how all the components are installed and connected each other. Regarding heat losses, in fact, the energy performance of a window depends on glass and frame heat transfer coefficient, on linear heat transfer coefficient due to the spacer type but also on the position of the frame into the window hole and on the modality of insulation of jambs and sills. The use of multi-layer walls with high thermal resistance values is widely used to reduce heat losses in buildings during wintertime. Nevertheless, it is extremely important to treat also weaker components of the envelope such as doors, windows and all the various thermal bridges, otherwise the efforts in increasing walls thermal resistance can be vanished.
45
With a correct insulation of the buildings, thermal bridges can be avoided and in that case the energy demand could be really low.
The comparison between the base case and the one without thermal bridges is shown.
Table 14. Heating and DHW energy demand; base case vs no thermal bridges case, [kWh].
HEATING + DHW
BASE CASE NO THERMAL BRIDGES
October 1388,1 1233 November 2119 1922 December 2588,5 2349,5 January 2742,5 2480,5 February 2258,1 2019,1 March 1683,9 1452,9 Total 12780,1 11457
Figure 57. Heating and DHW energy demand, base case vs no thermal bridges case.
The total demand changes by 10% for the whole period.
0 500 1000 1500 2000 2500 3000
OCT NOV DEC JAN FEB MAR
Ene rgy de m a n d [k W h ]
46
3.2.8 Run H: base case VS tilted ceiling case
Figure 58 shows the two cases in comparison:Figure 58. Base case and tilted ceiling case, IDA ICE.
The first one is the base case and the second one represents the detached house with tilted roof and tilted ceiling.
Table 15. Heating and DHW energy demand; base case vs tilted ceiling, [kWh].
HEATING + DHW BASE CASE CEILING TILTED October 1388,1 1490,5 November 2119 2255 December 2588,5 2755,5 January 2742,5 2922,5 February 2258,1 2415,1 March 1683,9 1825,9 Total 12780,1 13664,5
In the base case (flat ceiling), the energy demand is less than the tilted ceiling case because in the first case, the zone between the roof and the ceiling is not heated and furthermore it insulates the house below. The difference is 7% for the whole period.
47
Figure 59. Heating and DHW energy demand, base case vs tilted ceiling.
In order to reduce the energy use for heating a frequent used refurbishment in Sweden is to add additional roof insulation to the building. In this case the roof is already insulation provided.
3.2.9 Run I: base case VS different percentages of internal gains cases
In the base case simulation, 10% of internal gains has been set. It means that only the 10% of the heat produced is considered. If the 20% and 50% of the internal gains is considered, the energy demand obviously changes as can be seen in the Table 16.
Table 16. Heating and DHW energy demand; basecase vs different percentage of internal gains cases, [kWh].
HEATING + DHW BASE CASE INTERNAL GAINS
50% INTERNAL GAINS 20% October 1388,1 1209,5 1342,3 November 2119 1934 2073 December 2588,5 2392,5 2539,5 January 2742,5 2549,5 2694,5 February 2258,1 2086,1 2215,1 March 1683,9 1500,9 1637,9 Total 12780,1 11672,5 12502,3 0 500 1000 1500 2000 2500 3000 3500
OCT NOV DEC JAN FEB MAR
En er gy de m a n d [k W h ]
![Figure 4. Electricity generation by energy source in Sweden in 1990, 1996-2001 and forecast for 2010, TWh [4]](https://thumb-eu.123doks.com/thumbv2/5dokorg/4561147.116421/11.892.167.729.108.278/figure-electricity-generation-energy-source-sweden-forecast-twh.webp)
![Table 10. Heating and DHW energy demand; base case vs north-facing and east-facing cases, [kWh]](https://thumb-eu.123doks.com/thumbv2/5dokorg/4561147.116421/44.892.152.744.556.1091/table-heating-energy-demand-north-facing-facing-cases.webp)
![Table 11. Heating and DHW energy demand; base case vs less windows case, [kWh].](https://thumb-eu.123doks.com/thumbv2/5dokorg/4561147.116421/45.892.120.775.620.1115/table-heating-dhw-energy-demand-base-case-windows.webp)
![Table 13. Heating and DHW energy demand; base case vs 1 and 2 glazed windows cases, [kWh]](https://thumb-eu.123doks.com/thumbv2/5dokorg/4561147.116421/47.892.138.757.432.1071/table-heating-dhw-energy-demand-glazed-windows-cases.webp)