FAST DETERMINATION OF
FUEL/FEEDSTOCK MATERIAL
PROPERTIES AND COMPOSITION
By Near infrared (NIR) spectroscopy
NEMIR GIBRAEL EMAD AL HAMRANI
School of Business, Society and Engineering
Course: Degree Project Course code: ERA206 Subject: Energy Engineering Credits: 15 hp
Program: Energy Engineering
Supervisor: Jan Skvaril
Examiner: Konstantinos Kyprianidis Date: 2016-09-22
Email:
SUMMARY
This degree project is to fast determine different combinations of fuel/feedstock using near infrared (NIR) spectroscopy prior to combustion, which will be used to verify with the time consuming traditional determination methods for the moisture, ash contents as well as the heating values. It starts with packing up the samples, then with the help of NIR spectroscopy (scanning the samples) the functional group can be determined with the peaks (water overtones) that represent the absorption level of the NIR.
These samples were used for both NIR scans and the traditional analysis, which consists of drying the samples, grinding to 1mm in order to measure the ash content and heating values. By using the software, The Unscrambler® the data obtained by the NIR scans was pre-treated by the second derivative and using the Savitzky Golay method in order to improve the data and reduce the errors. Hence by using multivariate data analysis the NIR data were calibrated and cross-validated with the calibration data set that was obtained by the traditional analysis and then an independent validation model was built using a different data set (validation data set) to further verify the results. The results also presented the relevant wavelength (Regression coefficient) for each of the traditional analysis.
The moisture content of the samples was between 31,9-65,1%, this variates depending on the storage conditions. Duplicates of each sample were taken in order to increase the accuracy of the results. The validation model was applicable on the moisture content, while for the ash content and heating value, a validation model wasn’t achieved. The moisture content has a significant role not only in combustion process but also while using the NIRS, the absorption level decreased while comparing with the dried sample, this is also applicable for the
different particle sizes and head to sample distance. NIRS is a quick and trustworthy method to determine material properties with consideration of moisture, ash content and heating value that can to be used in different sectors.
PREFACE
This degree project was carried out with support from The School of Business, Society and Engineering at Mälardalen University EST, within the framework for Future Energy Center. We would like to thank our supervisor Jan Skvaril, Laboratory coordinator Jamal Saywan and Professor Konstantinos Kyprianidis for guidance and assistance.
Västerås August 2016
Nemir Gibrael Emad Al Hamrani
TABLE OF CONTENTS
1 INTRODUCTION ... 1
1.1 Background ... 1
1.1.1 Previous research ... 2
1.1.2 Description of the research ... 2
1.2 Purpose ... 3 1.3 Research questions ... 3 1.4 Delimitation ... 3 2 METHOD ... 4 2.1 NIR ... 4 2.2.1 Sample preparation ... 4 2.2.2 Dry (moisture) ... 4 2.2.3 Ash content ... 4 2.2.4 Heating value ... 5
3 LITERATURE STUDY (THEORY) ... 5
3.1 Material ... 5
3.1.1 Woodchips ... 5
3.1.2 Sawdust (Pellets fuel) ... 5
3.1.3 Forest residue ... 5
3.1.4 Peat ... 6
3.1.5 Bark ... 6
3.2 Near infrared (NIR) spectroscopy ... 6
3.2.1 Near Infrared Spectroscopy (theory) ... 6
3.2.2 Multivariate Calibrating ... 8
4 CURRENT STUDY (LABORATORY) ... 12
4.1 Sample Preparation ... 12
4.2 Moisture determination in the material ... 13
4.3 Grinding ... 13
4.4 Heating value ... 13
4.5 Ash content ... 14
5 RESULTS ... 16
5.1 Pre-treatment of NIR wavelength ... 16
5.2 Moisture content of samples ... 17
5.3 Ash Content ... 19
5.4 Heating Value ... 23
6 DISCUSSION ... 26
7 CONCLUSIONS ... 28
8 SUGGESTIONS FOR FURTHER WORK ... 29
REFERENCER ... 30
APPENDIX ... 31
APPENDICE
LIST OF FIGURES
Figure 1 Global Energy Supply ... 1
Figure 2 Electro-magnetic spectrum ... 6
Figure 3 Diffusive Reflection ... 7
Figure 4 Predicted vs. Reference ... 9
Figure 5 PLS Validation samples ... 10
Figure 6 Flowchart of the laboratory ... 12
Figure 7 Bomb Calorimeter ... 13
Figure 8 NIR Process ... 15
Figure 9 NIR machine ... 15
Figure 10 Raw data ... 16
Figure 11 Pre-treatment ... 17
Figure 12 Moisture Calibration Regression ... 18
Figure 13 Moisture Predicted Vs Reference Calibration ... 18
Figure 14 Moisture Predicted Vs Reference Cross-Validation ... 19
Figure 15 Moisture Regression Model Validation ... 19
Figure 16 Ash Calibration Regression ... 20
Figure 17 Ash Predicted Vs Reference Calibration ... 20
Figure 18 Ash Predicted Vs Reference Cross-validation... 21
Figure 19 Ash Regression Model Validation ... 22
Figure 20 HV Calibration Regression ... 23
Figure 21 HV Predicted Vs Reference Calibration ... 23
Figure 22 HV Predicted Vs Reference Cross-validation ...24
Figure 23 HV Regression Model Validation... 25
Figure 24 NIR wavelength ... 27
Figure 25 Moist vs dried ... 27
LIST OF TABLES
Table 1 Type of test ... 16DESIGNATIONS
Designations Description Unit
F Moisture %
Hi High heating value MJ/kg
λ Wavelength µm ̅ Wavenumber cm-1 Y Prediction variable - X Reference variable - v Velocity m/s
ABBREVIATIONS
Abbreviations DescriptionNIRS Near Infrared spectroscopy
LHV Lower heating value
HHV High heating value
CEN European Committee for Standardization PLS Principal least squares
RMSEP Root Mean Standard Error of Prediction RMSEC Root Mean Standard Error of Calibration RMSECV Root Mean Standard Error of Cross-Validation
1 INTRODUCTION
This degree project will be focused on using Near Infrared Spectroscopy (NIRS), for
analyzing different mixture of materials. Certain properties of the materials have a significant effect on the combustion process such asthe heating value, ash and moisture content which will be covered. Thus each materials varies depending on where they have been extracted from, how have they been sorted, stored or transferred. Industries do measurements by using the directly or indirectly method which gives basic analysis and requires a lot of time. NIRS gives the opportunity to analyze different properties, as it requires less time. There are four steps; 1) samples preparation, 2) spectral data acquisition, 3) data pre-treatment and 4) multivariate calibration.
1.1 Background
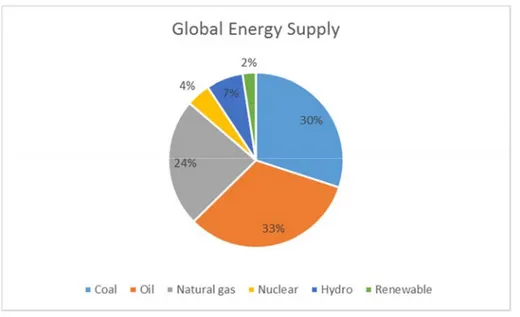
We are living in a world that is high dependent on fossil fuels as shown Figure 1 Global
Energy Supply and with unstable oil producing countries, which leads many countries to find
alternatives (renewable energy sources) to fulfil their countries energy demands.
Figure 1 Global Energy Supply
[Source: BP Statistical Review of World Energy, 2015]
A renewable alternative would be to use biomass, which consists of different organic material such as woodchips, forest residue, peat, etc. Each material has its own properties, which allows the user to decide which material would be suitable for a higher combustion, thus more energy produced. Factors such as the moisture content have a leading role in the combustion process. The usage of NIR spectroscopy enables power-producing companies determine the properties of a material on a large scale with reliable results compared with the traditional gravimetric analysis. Within a sustainable development, producing energy from biomass has many advantages, two major advantages are to produce energy, and reduce the carbon dioxide emissions (greenhouse gas) harming the Earth’s atmosphere. In this case five materials are going to be used which are wood chips, saw dust, forest residue, bark & peat.
Combustion is a chemical reaction that produces heating energy, which gives off carbon dioxide and water vapor. During the process, it forms dust, slag and ash, which is harmful for the environment. In Sweden, there are two types of combustion boiler; fluidized bed and grate combustion. Gasification is used for converting material from solid to gas. In both states of matter, it is required to control the process. In order to maintain lower emissions and reduce the amount of unburned material. This might affect the purification system. There has always been an interest in improving the combustion process, by reducing the emission, and increasing the efficiency of the plant. In order to improve a plant, it is required to measure the moisture in the fuel and heating value. The cost of the fuel is directly
proportional to the moisture content due to its production capacity. These measurements can be done by online NIRS, which is placed at the plant.
1.1.1 Previous research
Since 2004 there has been many research done on moisture content in biofuel, the purpose was to find better and reliable methods, by using the NIRS and comparing the values to traditional method, the results were very close, and the NIRS method was very time efficient. NIRS are used in many places throughout Sweden; such as Eskilstuna Energi och Miljös
kraftvärmeverk and Västerås Mälarenergi kraftvärmeverk.
It is necessary to measure the moisture content due to many factors, such as; it affects the amount of the burnable material which is directly affecting the cost (value), this leads to an additional step prior to the combustion (as the fuel shall be dried). If there are sufficient information regarding the moisture content of the fuel, one could control (decide) how much fuel is required and decrease additional cost such as transporting excess/little fuel.
The purpose is to research the possibilities of the NIRS for an automated moisture content measuring of biofuels. To further enhance the process, the NIRS can be placed at the fuel delivery station to analyze the fuel directly prior to combustion.
Methods for determination of the moisture content were either direct method or indirect method, which was carried out by analyzing flue gas. Disadvantage of these methods is that its time consuming, and not being able to analyze the material correctly as the samples might not be homogenously mix, thus this gives unreliable results and uncertainties regarding the material properties.
1.1.2 Description of the research
The first NIR was taken in 1880, it was photographic plate, and it was built in 1829 by two person. Niepce and Daguerre, but it had some problem with the NIR sensitivity. But Abney and Festing was able to record the spectra of organic liquids in range 1 to 1.2 µm, and did discover both atomic grouping and who imported of hydrogen bond in the NIR spectrum. (Donald Burns, 2008)
In our time NIR relies on computer, technology used for control, acquire data, calibration and data analysis. Since 1950s started to use NIR to determine the moisture, protein, oil and many other things.
Everyone has been through a simple near infrared, radiation from the sun for an example. It is perfectly safe for us; unless it is concentrated with, high degree could cause burning to the skin. Near infrared is very import tool, it could be used in different area like industries, agriculture, food and chemical. The NIR range is between 12 800 and 4 000 cm-1 (0.780-2.5
µm).
NIRS analysis products, the moisture content, and as mentioned earlier moisture content has a significant role in the combustion of biofuels. Based on previous researches (Värmeforsk) NIR gives accurate analysis. The preferred wavelength to measure the moisture content is between 4 000 and 12 000 cm-1, in order to achieve stable analysis, it’s recommended to use
rotary measurements while also stirring through the mixture between every measurement (up to 12).
1.2 Purpose
This degree project aim is to determine fast the properties of different combinations of fuel/feedstock materials using Near Infrared spectroscopy, and verify the NIRS results with the traditional analysis. Mainly on the ash, moisture contents and the heating values.
1.3 Research
questions
Is it possible to build a model by correlating the NIR absorbance spectra to the traditional analysis for moisture, ash content and heating value?
How reliable is NIRS for rapid fuel properties determination? How does the moisture content affect the NIR results?
1.4 Delimitation
Each sample consist of a mixture of different material (woodchips, sawdust, forest residue, peat and bark) which weighs approximately 200 grams. The traditional analysis are only limited to moisture, ash and the heating value.
2 METHOD
For this degree project, various tasks were taken place, such as NIRS scans, and different laboratory analysis (following standards) to correspond the NIR values. Scientific reports and literature were obtained to give basic knowledge regarding the usage of NIR.
2.1 NIR
In order to have better base, six scans were taken from each sample while rotating at 1 m/s. Hence the data was collected and pre-treated to smoothen out the noise disturbance which occurs during scans. This was done by The Unscrambler® and then the results were analyzed by correlating with the laboratory standard values.
2.2
Standards for laboratory procedures
There are several procedures to be followed that are issued from the Swedish Standards Institute (SIS) with collaboration with the CEN (European Committee for Standardization), which are introduced in different standards depending on task. Such as calculating the moisture, ash content, and heating value that are covered in this degree project.
2.2.1 Sample preparation
The standard SS-EN 14780:2011 has been issued by CEN. It describes the procedure to prepare the samples in order for one or more tests. It requires that the samples shouldn’t be changed throughout the process while using a shovel and balance, as samples should be homogenized. They shall be placed in airtight bags to avoid moisture loss. The moisture analysis (SS-EN ISO 18134-1:2015) shall be done primary stages of the task.
2.2.2 Dry (moisture)
To determine the moisture content in the sample, SS-EN ISO 18134-1:2015 describes that the samples should be dried at 105°C for a time frame less than 24 hours, as the sample shall be duplicated. Each sample shall be a minimum of 300 grams although there is an exception for solid biofuels to 200/100 grams.
2.2.3 Ash content
The determination of the ash content according SS-EN ISO 18122:2015, samples (1 mm) shall be in a furnace at 550°C until completely combusted. As the furnace shall be airtight in order for the combustion to occur.
2.2.4 Heating value
SS-EN 14918:2010 standard describes the determination of the calorific value which is used to analysis solid biofuel, usually its burns in high-pressure oxygen in a bomb calorimeter. Benzoic acid pellet is used to calibrate the calorimeter. The sample (completely dry) pellets shall weigh between 0.8-1 grams.
3
LITERATURE STUDY (THEORY)
3.1 Material
The materials used for the thesis work, were solid material. They consist of wood chip, saw dust, peat, forest residue and bark. All these material are renewable, and accounted as bioenergy material. (Energy, 2016)
3.1.1 Woodchips
Woodchip are usually used for high energy consumption users; such as in large facilities, due its properties it produces high level of energy. Woodchips could be used for small facilities too, but it requires a good quality of woodchips and it has to be more dry than the usual. The moisture varies between 30-50 % of the material, the heating value depends on the moisture in the material. If woodchips are dried appropriately it could give the best heating value.
The disadvantages for woodchips is the moist which could contain mold spores. It could be harmful, and causes lung disease. (JTI, 2013)
3.1.2 Sawdust (Pellets fuel)
Pellet fuel is made from compact sawdust and waste of wood products. (Energy, 2016) Pellets has very low moisture (below 10 %) it gives very high heating value compared to other
material. It’s not harmful for the environment, as the carbon dioxide released from the pellets are completely natural. (Walker, 2009)
3.1.3 Forest residue
Forest residue has a variety of different moisture and physical appearance. If the moisture is low, so is the Sulphur emissions. Forest residue are more useful than the usual substance in the forest, because it gives higher heating value than usual.
3.1.4 Peat
Peat is one of the most important substance for biomass, it grows about 0, 1 to 0, 2 mm. The best way to get highest heating value is by collect it during summer. Moisture for peat is between, 30 to 50 % this varies depending on the drying process and where it has been collected from. (Siden, 2015)
3.1.5 Bark
Bark is natural energy sources that is the product waste from trees. It’s difficult to use bark in small facility, because of high moisture and the variating particle sizes. (Siden, 2015)
3.2
Near
infrared (NIR) spectroscopy
3.2.1 Near Infrared Spectroscopy (theory)
NIRS (Near Infrared Spectroscopy) has been used widely, to analyze material properties in different sectors such as chemical, petrochemical, polymer, medical industries, etc. NIR is technique that doesn’t require any contact with the material to be analyzed as it preforms
scan through electro-magnetic radiation. It is proved to be a powerful tool in different industries.
To be able to analyze the sample, the NIR is within aspecific region which cover between 12,800-4,000 cm-1 and (0.780-2.5 µm) which is, the absorption bands of the fundamental
C-H, O-H and N-H. (Magnus Berg, 2005)
As shown in Figure 2 Electro-magnetic spectrum the wavelength between 0.7 and 1.1 µm represents the overtone for the second N-H and third C-H. Between 1.1 and 1.8 µm the first C-H, N-H and second C-H overtone are represented. While the combination of C-H, N-H, O-H and double bond C=O are presented between 1.8 and 2.5 µm. The equation mentioned is used to convert the wavenumber to wavelength.
Near infrared spectroscopy measures the light absorption in the sample with different wavelengths and it use the data to analysis the properties by multivariate calibration
methods. By using NIR, results can be obtained within a few seconds and be compared to the traditional method which may take a whole day to analyze the sample. (Magnus Berg, 2005) The advantages of near infrared spectroscopy are:
Time efficient, it analyzes the material very fast. Simplicity, sample preparation is not required. It could measure the samples while on rotation.
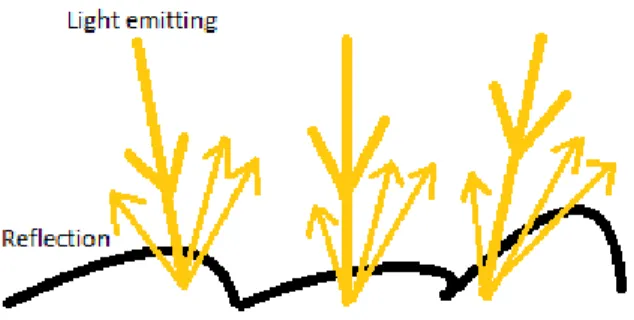
When the energy hit the chemical binding in the sample, the molecular binding starts moving (vibration), with this reaction a wavelength is presented as the vibration is absorbed by NIR. There are many type of molecular vibrations and the absorption, each appear at different wavelengths. The vibration depends on the bond type; each bonds has a unique frequency. Near infrared spectroscopy has two methods to present the sample properties:
1) Transmission (NIRT) and 2) Reflection (NIRR). The transmission has a detector and a light source emitting on the sample. The detector on the head absorbs the light reflection on the sample scanned. (Magnus Berg, 2005)
Diffuse reflection, is when the light bounces after reaching the sample. As some light is absorbed into the sample and then reflected, as shown in the
Figure 3 Diffusive Reflection.
3.2.2 Multivariate Calibrating
By multivariate calibration a model can be created between two data sets, X and Y. In this case, X is the NIR results (wavelength) and the Y is the reference results obtained through the traditional analysis. Multivariate calibrating is used in order to achieve reliable model. (Donald Burns, 2008)
The results would be presented as a statistic diagram, which is then enhanced to reduce the irrelevant wavelengths (noise cancellation). This is then used to fulfil the purpose of the project. For calibration principal least squares (PLS) method is used, which is done through The Unscrambler®.
Principal least squares method consists of evaluating and analyzing the raw data, correlating the X and Y values to build a model which will be used for exploring the different parameter relationships. It basically does approximations between the independent X and dependent Y values. The following linear Equation 1 Reference is used for calculating the reference which is a prediction of the dependent Y value. Where the Y is the reference data, b is the
correlation/regression coefficient and the X is the absorption value for the different
wavelengths whereas the ε is the stochastic (random) variable which isn’t built in the model.
Equation 1 Reference
⋯ … (1)
An important factor that must be taken into account for is the validity of the model, to check whether the model is accurate. There are different approaches to validate the model such as cross-validation, segmented cross-validation, independent validation and leverage corrected validation. (Esbensen, et al., 2002) In this degree project, the cross-validation and
independent validation will be used for identification of the prediction values and verification (trustworthiness) of the prediction values respectively. The model can be enhanced by
Figure 4 Predicted vs. Reference
The Figure 4 Predicted vs. Reference shows the selected predicted Y-value from the model and is plotted against the reference Y-value. This way it enables to check the quality of the regression model. If the model gives a good fit, the plot will show points close to a straight line through the origin and with slope close to one. Source The Unscrambler® X
(Interpreting PLS plots)
Slope
The closer value to one, the data are better presented.
Offset
It is the intercept of the line with the Y-axis when the X-axis is set to zero.
RMSE (Root mean square error)
The Calibration error RMSEC is presented in blue, while the expected Prediction error RMSEP is presented in red, depending on the validation method used. Equation 2 RMSEP, Root Mean Standard Error of Prediction is the error within alteration between the predicted values and the reference values for the models validation. Where the yi, pred is the predictive
value that is obtain through the model, yi,ref is the reference value of the model and n is the
number of the samples. It is an equivalent to standard deviation. An unknown value can be compared with the standard deviation result.
P redic ted Y (A s h , Fac tor-7)
Equation 2 RMSEP
∑ , ,
(2)
R-squared
The calibration R-Squared (blue) value taken from the calibration Explained Variance plot for the number of components in the model, as the validation R-Squared (red) is also
calculated from the Explained Variance plot. Basically the coefficient of determination, where the yi, pred is the predictive value that is obtain through the model, yi,ref is the reference value of
the model and , is the mean of the reference values.
1 ∑ , ,
∑ , , (3)
Figure 5 PLS Validation samples
The following describes the Figure 5 PLS Validation samples
Correlation
RMSEC
Root Mean Square Error of Calibration. This measures the scattering of the calibration samples about the regression line. Which is presented by the following equation, where the yi,calibration is the calibration value, yi,ref is the reference value and n is the number of the
samples.
∑ , ,
(4)
SEC
Standard Error of Calibration which is similar to RMSEC, except it is corrected for the Bias.
Bias
The mean value over all points which is either lie systematically above (or below) the regression line. Calculated through the following equation, where the yi, pred is the predictive
value that is obtain through the model, yi,ref is the reference value and n is the number of the
samples.
∑ , ,
(5)
The following are the summary of the steps taken to achieve the model: 1. Import the raw data
2. Pretreatment of the raw data (with 2nd derivative + Savitzky Golay)
3. Create the model
4. Enhance the model (with unmarked) 5. Regression analysis to validate
4
CURRENT STUDY (LABORATORY)
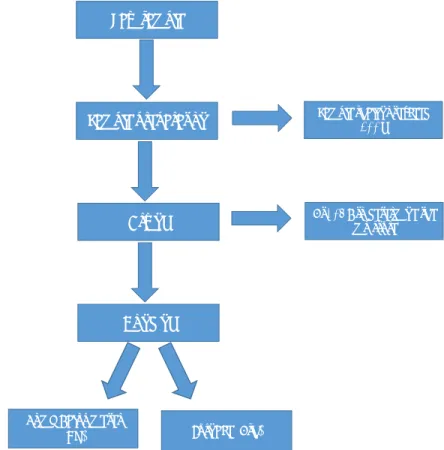
The following Figure 6 Flowchart of the laboratory shows the laboratory process.
Figure 6 Flowchart of the laboratory
4.1 Sample
Preparation
The material was given from the Mälardalens University; each sample would be 200 g. In this project five different materials would be used.
1. Wood Chips 2. Saw dust 3. Forest residue 4. Bark
5. Peat
By mixing different percentage from all the five materials, which is shown in the Appendix 1. There would be 105 sample in the project, 70 samples were given by the supervisor and 35 sample mixed by the students in different percentage.
Raw sample
Sample preparation Sample shall not exceed 200 g
Drying At 105 C to determine the moisture
Grinding
Furnace (Ash) Bomb Calorimeter
4.2 Moisture
determination in the material
In this step, the moisture content is measured in the material. The moisture content of the samples could easily change if it is not kept in closed container (sealed bags). Thus, this affects the NIR scans.
The method used for the moisture content. 1. First weight the sample before putting in the oven.
2. Drying process in the oven require time and the time depend on the material used and how big the material.
3. Weight the sample after taking out from the oven.
4. Calculate the moisture content in percentage by using the weight difference prior to drying and after drying.
It requires significant time in order to measure the entire samples for the project. There are certain precautions to be taken such as the samples shouldn’t be exposed to air after taking them out of the oven, as the samples are hot it absorbs moisture.
4.3 Grinding
To proceed forward with the project, the samples need to be grinded with 1 mm filter to change the sample to powder form. It is important to use powder form to determine the ash content and heating value.
4.4 Heating
value
Bomb calorimeter as shown in Figure 7 Bomb Calorimeter is used to determine the heating value of different samples. Samples should be completely dry then form into a pellet. The calorimeter requires oxygen to ignite the pellets.
To determine the heating value:
1. The sample shall be dried in the oven. 2. Approximately 1 gram of each dried
sample shall be form into a pellet. 3. Pellet is placed into the bomb
calorimeters cup, in which a thread is touching the surface of the pellet. 4. The head is placed into the bomb and
fasten tightly, then a flow of oxygen is inserted into the bomb.
5. The bomb is placed into the bucket,
4.5 Ash
content
Ash is the remains of the combustion which is non-flammable material. Biofuel have alkali like sodium and potassium. These elements could be difficult to deal with as it may stick in the boiler surfaces. The reason to determine the ash content is to find out which sample give less ash. The next task is to find out which sample’s ash is at the bottom or flown (ash). To determine the ash:
1. Measure the sample before putting into the oven.
2. Measure the sample after taking out of the oven, in order to know how much moisture is in the sample.
3. Put the sample in the furnace with 550◦C for around 3-4 hours. 4. Measure the sample after taking it out from the furnace. 5. Use the data to calculate for the ash.
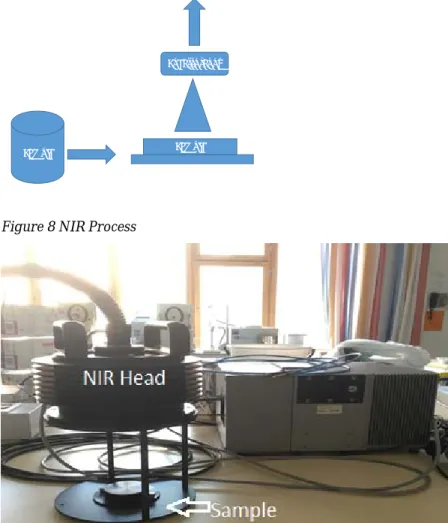
4.6 NIR
The samples shall be homogeneously mixed then placed beneath the NIR spectroscopy head
(Figure 9 NIR machine) to perform the scans. To analysis the sample, the information sent to a
computer program called The Unscrambler®, the process is shown in Figure 8 NIR Process. The head takes 32 scan for the sample, the range of the spectra is between 4000-12000 cm-1.
The samples widths are between 6-6.4 cm diameter and the depth depend on the material size. The process will be repeated 12 times with each sample; 6 times stationary and 6 times rotating with velocity 1 m/s.
Figure 8 NIR Process
Figure 9 NIR machine
Sample Sample
Spectroscopy
5 RESULTS
The following Table 1 Type of test presents the different types of test taken, and the sum of samples.
Table 1 Type of test
Table 2 Summary of results presents a summary of the figures of merits of the calibration,
cross-validation and independent validation models for the moisture, ash content and heating value.
Table 2 Summary of results
Analysis (Calibration) Moisture Ash Heating Value
RMSEC 0.0390 0.0070 0.4331 R2 0.6880 0.4497 0.3309 Cross-validation RMSECV 0.0408 0.0077 0.4521 R2 0.6683 0.3816 0.2818 Independent validation RMSEP 0.0301 0.0081 0.7309 R2 0.5858 NA NA
5.1
Pre-treatment of NIR wavelength
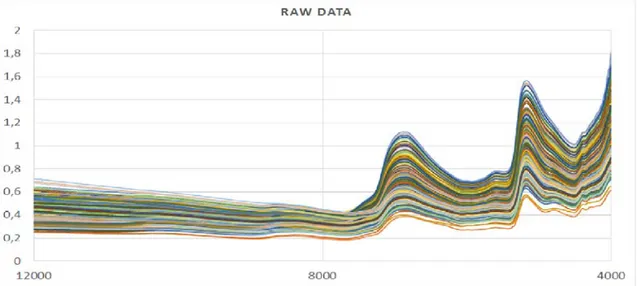
The Figure 10 Raw data shows the raw NIR data obtained through the NIR samples scans, and the Figure 11 Pre-treatment shows the pre-treated data obtained by the second derivative with Savitzky Golay method within the same wavelength range.
Figure 10 Raw data
Type Sum of sample
Moisture 105
Ash 44 HV 24
Figure 11 Pre-treatment
5.2 Moisture
content of samples
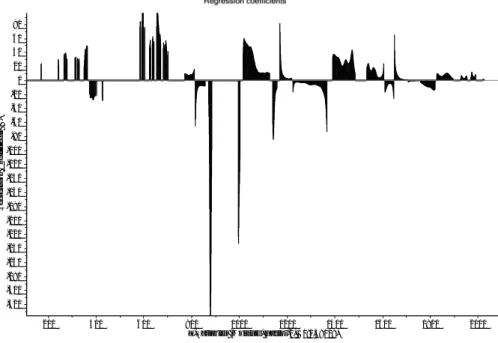
The following
Figure 12 Moisture Calibration Regression shows the calibration regression coefficients that
were smoothen, the black intervals represent the relevant wavelength, while the light purple represents the irrelevant wavelengths, while using the Martens uncertainty test.
X-Variables (Moisture, Factor-2, B0:0,38009)
200 400 600 800 1000 1200 1400 1600 1800 2000 Regression Coefficient s (B) -320 -300 -280 -260 -240 -220 -200 -180 -160 -140 -120 -100 -80 -60 -40 -20 0 20 40 60 80
Figure 12 Moisture Calibration Regression
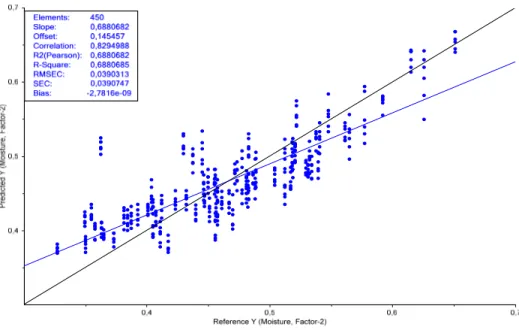
As shown in Figure 13 Moisture Predicted Vs Reference Calibration, there are 450 elements chosen from a total of 630 elements. This is the calibration set which represent the data acquired through the traditional method for measuring moisture content. Correlation between the predicted and reference values is about 0.83 whereas the R-square is about 0.69 and according to process control R-square greater than 0.65 is considered significant. While the RMSEC (Root Mean Standard Error Calibration) about 0.04, which is low error.
Figure 13 Moisture Predicted Vs Reference Calibration
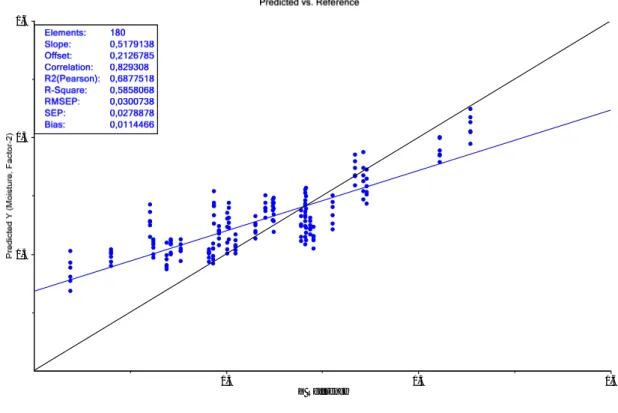
Figure 14 Moisture Predicted Vs Reference Cross-Validation, presents the cross validation
parity plot of the moisture content. The results show a decrease in the R-square value to 0.66
0,4 0,5 0,6 0,7
which is significant (>0.65), the root mean standard error of cross-validation is at 4% which is slightly higher error compared to the calibration model.
Figure 14 Moisture Predicted Vs Reference Cross-Validation
Figure 15 Moisture Regression Model Validation
The Figure 15 Moisture Regression Model Validation shows predicted vs reference for PLS calibration samples. It is an independent validation of the model developed and using the validation set that has not been included in the calibration/cross-validation model. RMSEP is close to zero, which shows good accuracy of the results obtained.
5.3 Ash
Content
The Figure 16 Ash Calibration Regression shows the relevant wavelengths after being pre-treated, while using the Martens uncertainty test.
Y Reference
0,4 0,5 0,6
0,4 0,5 0,6
Figure 16 Ash Calibration Regression
Figure 17 Ash Predicted Vs Reference Calibration
X-Variables (Ash, Factor-2, B0:0,03846)
0 200 400 600 800 1000 1200 1400 1600 1800 2000 2200 R egression C oef fi cients (B) -50 -45 -40 -35 -30 -25 -20 -15 -10 -5 0 5 10 15 20 25 30 35 40
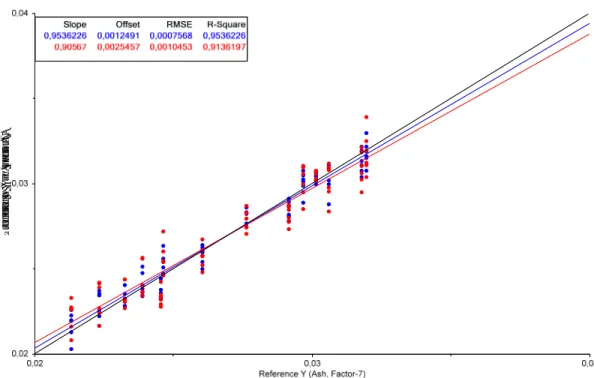
Figure 18 Ash Predicted Vs Reference Cross-validation
Figure 17 Ash Predicted Vs Reference Calibration shows the calibration set for the ash
content which were 180 of 264 elements, some points (samples) are far apart from the target line, and the RMSEC is very close to zero, which is substantial. While the R-square is
relatively good as it is around 0.45. Whereas for the cross-validation model the R-square is 0.38 which is less than the calibration model but the RMSECV is increased slightly, but this isn’t significant as it’s still considered as zero, the plot is presented at Figure 18 Ash Predicted
Figure 19 Ash Regression Model Validation
Due to few data being obtained (the validation set), the program wasn’t able to build an independent validation model, thus the R-Square is not available (NA) as shown on
Figure 19 Ash Regression Model Validation.
Pr edi ct ed Y ( A sh, Fact or -2 )
5.4
Heating Value
Figure 20 HV Calibration Regression
Figure 20 HV Calibration Regression presents the relevant wavelength for the heating value
after being smoothen, while using the Martens uncertainty test.
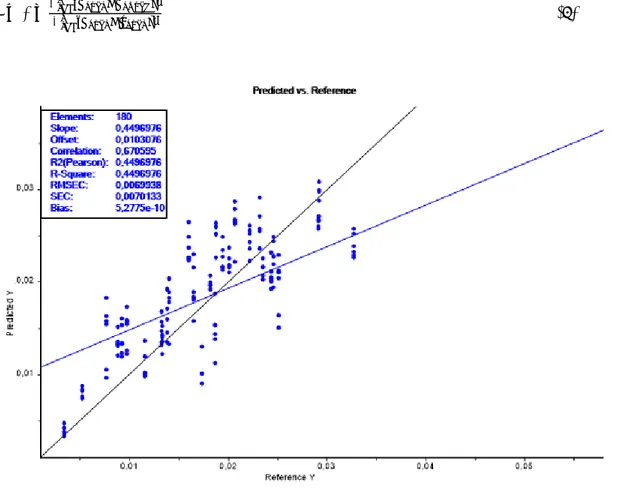
For the heating value there were 108 elements used for the calibration model out of the total of 144 elements. The Figure 21 HV Predicted Vs Reference Calibration shows the results for
X-Variables (HV, Factor-2, B0:20,66684) 0 200 400 600 800 1000 1200 1400 1600 1800 2000 2200 R e g ressi on C oef fi ci ents ( B ) -2200 -2000 -1800 -1600 -1400 -1200 -1000 -800 -600 -400 -200 0 200 400 600 800 1000 1200 1400 1600 1800 2000 2200 2400 2600 2800
the calibration model. The correlation between the predicted and reference values is about 0.58 whereas the R-square is about 0.33. While the RMSEC about 0.43, which is high error.
Figure 22 HV Predicted Vs Reference Cross-validation
Figure 22 HV Predicted Vs Reference Cross-validation shows the cross-validation results, as
correlation and R-square (coefficient of determination) are decreased to 0.52 and 0.28 respectively. Whereas the RMSECV is increased by around 0.019.
Pr edi c ted Y ( H V, F a c tor -2 )
Figure 23 HV Regression Model Validation
The independent validation model as presented on Figure 23 HV Regression Model
Validation could not be achieved since few data were obtained and the RMSEP for the
calibration was around 0.73.
P redic te d Y (H V , Fac tor-2)
6 DISCUSSION
The degree project is mainly based on the usage of NIRS for analyzing biomass properties, in which the moisture content, ash content and heating value were focused on. These factors affect the combustion process. The purpose of using biomass is due to the nature of the material as it is a renewable energy source, which is an alternative to fossil fuels. The biomasses used were woodchips, forest residue, peat, saw dust and bark.
NIR is a leading technology which can be used in different industry; ranging from health, utilities, chemical, etc. for analyzing the properties of absorption bands of the fundamental of C-H, O-H and N-H.
There has been many researches done using the NIRS, to improve the combustion process by knowing the fuel’s properties. Whereas factor such as moisture content have a huge impact on the combustion.
If the material has high moisture, it requires more time to be combusted as it has to be dried first. This means without having the NIR analysis we would have several stages prior to the combustion to dry the feedstock. It may be challenging for a small plant, as it is limited (not enough area). Thus, the fuel quality is directly proportional to the cost of the fuel, in case the fuel has high moisture content it’s not economical for the power producing companies to generate energy.
In comparison to previous research done for NIRS, this project degree mixes different portions of the fuel/feedstock to achieve a better (energy production) fuel mixture, rather than only using one type of fuel/feedstock. We have used two ways to scan the samples, stationary and while on rotation, to simulate different scenarios such as a belt conveyor inputting the feedstock/fuel into the boiler or specifically scanning a part of the sample. There were six scans made for stationary and while on rotation on each samples, to have a strong data set. After obtaining the results, the raw data were pretreated to minimize the errors in the data. These pretreated data were compared with the time consuming/traditional methods such as drying the samples in the oven, calculating the heating value by bomb calorimeter, etc. issued by the Swedish Standard Institute (SIS). According to the standard for determination of moisture content the drying process shall not exceed 24 hours, but the material size also affects the drying duration.
With the help of The Unscrambler®, we choose the PLS method to build our models, using all six scans for each sample. The data was divided into two sets, one set for the calibration and the another for validation. The calibration model and cross-validation model was built using only the calibration data set, and then an independent validation was done to further validate the results using the validation data set only.
Figure 24 NIR wavelength
The NIR scans were presented as Figure 24 NIR wavelength, it shows different chemical bonds with regard to relevant wavelength such that water is presented twice at around 6666 cm-1 and 5000 cm-1 theoretically albeit based on our results it was presented at around 6900
cm-1 and 5300 cm-1 as shown in Figure 25 Moist vs dried. We see a drop throughout the
whole wavelength. This can be affected by the particle size, sensor to sample distance or change of moisture during the scans which leads us to pre-treat the results prior to creating the analysis. Wavelengths varies depending on the samples composition.
4
Figure 25 Moist vs dried
While using NIR to determine the moisture content, the predicted value compared with the reference value were very accurate. Such that the Calibration error RMSE is about 4%. The samples, as mentioned earlier were a mixture of different materials with different moisture content with an interval between 31.9-65.1%, while being preserved in the same physically
condition. The surrounding condition (temperature) and preservation of the samples can affect the moisture content even though sealed plastic bags were used.
The following are a few sources of errors:
Storage condition of the samples (change of temperature, decaying overtime) The time taken to measure the dried samples while being exposed to air Inaccurate oven temperature (completely dried)
In order to improve the results, duplicate test was carried out of the same samples. Due to malfunction of the oven, certain samples were not completely burnt, as the oven had uneven heat distribution. This was also noted when the weight measurements were taken.
Due to unforeseen circumstances, the pellets were not fully combusted this lead to time consumption and not accurate results. Albeit the time the samples were exposed air does affect the results as according to standard SS-EN 14918:201 the samples should be kept in air tight bags.
We could have excluded certain samples, to achieve a better calibration model that (samples) were closer to the target line. Thus a lower RMSE and a higher R-square. The analysis has shown that the NIRS is a reliable and efficient process which is also time saving.
7 CONCLUSIONS
By using The Unscrambler we were able to create three calibration models for moisture content, ash content and heating value. The moisture model presented that the RMSEC is around 0.039 which makes the calibration model acceptable as it is very close to zero and then it was verified by the cross-validation model which gave approximately the same result (0.0408). This was further verified by the independent validation using a different data set which gave the RMSEP at 0.0301.
Meanwhile the calibration model for the ash content had very low RMSEC (0.0070), in which the cross-validation gave 0.0077 but an independent validation model couldn’t be modelled completely due to low data set as the R-square couldn’t be calculated.
For the heating value model, high RMSEC (0.4331) was achieved due to malfunction with the bomb calorimeter and for the cross-validation the RMSECV was increased by around 0.02 (0.4521). Thus, the independent validation model wasn’t built completely due to low data set. Hence, it is possible to build a model by correlating the NIR absorbance spectra to the traditional analysis with the sufficient amount of data obtained.
The moisture content affects the absorption level, as mentioned in the discussion there are two water overtones, these overtones are decreased in comparison with the moist (raw) sample. Thus is leads to better accuracy of the NIR scans as moist samples affect the scans as the rays are emitted on the sample the water particles vibrate and disturbs the absorption.
8
SUGGESTIONS FOR FURTHER WORK
Due to unforeseen circumstances, oven malfunctions, not all samples were measured for ash, and heating value. Thus, with all samples being measured for ash, and heating value gives better results. The NIR scans and the rotation speed may be increased to enhance the results. Other tests (traditionally analysis) shall be done using the same samples and compared with the NIR; such as lignin, metal and plastic.
Different application such as integrating it to internet of things, by having a worldwide network using the same database. Having a portable device that can easily be carried around and do scans and for process control.
REFERENCER
Bokobza, L., 1998. Near infrared spectroscopy.
Dahlquist, E., 2013. Biomass as Energy Source. s.l.:CRC Press Inc. Donald Burns, E. C., 2008. Handbook of Near-Infrared Analysis. s.l.:s.n.
Efternamn, F., 2014. Konsten att skriva referenser i enlighet med APA.. Västerås: Mälardalens högskola.
Energy, A., 2016. Biomass Energy. [Online]
Available at: http://www.altenergy.org/renewables/biomass.html/ [Accessed 2016].
Esbensen, K. H., Guyot, D., Houmoller, L. P. & Westad, F., 2002. Multivariate Data
Analysis. 5th ed. Esbjerg: CAMO Process AS.
JTI, 2013. Flis som värmekälla. [Online]
Available at: http://www.bioenergiportalen.se/?p=2045
Magnus Berg, M. K. R. T. S. E. W., 2005. Automatisk fukthaltsbestämning av biobränslen, STOCKHOLM: VÄRMEFORSK Service AB.
Serneels, S., 2004. Reliability of multivariate calibration. [Online] Available at: http://www.chemometry.com/Research/MVC.html Siden, G., 2015. Förnybar Energi. s.l.:s.n.
Walker, T., 2009. Biomass Sustainability And Carbon Policy Study, s.l.: Manomet Center for Conservation Sciences.
APPENDIX
1 SAMPLE PERCENTAGE
Sample ID Wood chips Saw dust Forest residue Bark Peat Total
1201 74% 26% 0% 0% 0% 100% 1202 50% 50% 0% 0% 0% 100% 1203 25% 75% 0% 0% 0% 100% 1204 75% 0% 25% 0% 0% 100% 1205 50% 25% 25% 0% 0% 100% 1206 25% 50% 25% 0% 0% 100% 1207 0% 75% 25% 0% 0% 100% 1208 50% 0% 50% 0% 0% 100% 1209 25% 25% 50% 0% 0% 100% 1210 0% 50% 50% 0% 0% 100% 1211 25% 0% 75% 0% 0% 100% 1212 0% 25% 75% 0% 0% 100% 1213 75% 0% 0% 25% 0% 100% 1214 50% 25% 0% 25% 0% 100% 1215 25% 50% 0% 25% 0% 100% 1216 0% 75% 0% 25% 0% 100% 1217 50% 0% 25% 25% 0% 100% 1218 25% 25% 25% 25% 0% 100% 1219 0% 50% 25% 25% 0% 100% 1220 25% 0% 50% 25% 0% 100% 1221 0% 25% 50% 25% 0% 100% 1222 0% 0% 75% 25% 0% 100% 1223 50% 0% 0% 50% 0% 100% 1224 25% 25% 0% 50% 0% 100% 1225 50% 0% 0% 50% 0% 100% 1226 25% 0% 25% 50% 0% 100% 1227 0% 25% 25% 50% 0% 100% 1228 0% 0% 50% 50% 0% 100% 1229 25% 0% 0% 75% 0% 100% 1230 0% 25% 0% 75% 0% 100% 1231 0% 0% 25% 75% 0% 100% 1232 75% 0% 0% 0% 25% 100% 1233 50% 25% 0% 0% 25% 100% 1234 25% 50% 0% 0% 25% 100% 1235 0% 75% 0% 0% 25% 100% 1236 50% 0% 25% 0% 25% 100% 1237 25% 25% 25% 0% 25% 100% 1238 0% 50% 25% 0% 25% 100% 1239 25% 0% 50% 0% 25% 100% 1240 0% 25% 50% 0% 25% 100% 1241 0% 0% 75% 0% 25% 100%
1242 50% 0% 0% 25% 25% 100% 1243 25% 25% 0% 25% 25% 100% 1244 0% 50% 0% 25% 25% 100% 1245 25% 0% 25% 25% 25% 100% 1246 0% 25% 25% 25% 25% 100% 1247 0% 0% 50% 25% 25% 100% 1248 25% 0% 0% 50% 25% 100% 1249 0% 25% 0% 50% 25% 100% 1250 0% 0% 25% 50% 25% 100% 1251 0% 0% 0% 75% 25% 100% 1252 50% 0% 0% 0% 50% 100% 1253 25% 25% 0% 0% 50% 100% 1254 0% 50% 0% 0% 50% 100% 1255 25% 0% 25% 0% 50% 100% 1256 0% 25% 25% 0% 50% 100% 1257 0% 0% 50% 0% 50% 100% 1258 25% 0% 0% 25% 50% 100% 1259 0% 25% 0% 25% 50% 100% 1260 0% 0% 25% 25% 50% 100% 1261 0% 0% 0% 50% 50% 100% 1262 25% 0% 0% 0% 75% 100% 1263 0% 25% 0% 0% 75% 100% 1264 0% 0% 25% 0% 75% 100% 1265 0% 0% 0% 25% 75% 100% 1266 100% 0% 0% 0% 0% 100% 1267 0% 100% 0% 0% 0% 100% 1268 0% 0% 100% 0% 0% 100% 1269 0% 0% 0% 100% 0% 100% 1270 0% 0% 0% 0% 100% 100% 1271 30% 15% 55% 0% 0% 100% 1272 40% 20% 0% 40% 0% 100% 1273 10% 20% 20% 20% 30% 100% 1274 0% 0% 20% 40% 40% 100% 1275 0% 0% 40% 40% 20% 100% 1276 10% 20% 30% 40% 0% 100% 1277 15% 15% 30% 40% 0% 100% 1278 20% 10% 40% 30% 0% 100% 1279 25% 10% 50% 15% 0% 100% 1280 0% 20% 30% 25% 25% 100% 1281 0% 30% 10% 10% 50% 100% 1282 0% 40% 0% 30% 30% 100% 1283 0% 40% 30% 30% 0% 100% 1284 10% 0% 25% 25% 40% 100% 1285 20% 0% 20% 40% 20% 100%
1287 0% 0% 25% 25% 50% 100% 1288 40% 40% 20% 0% 0% 100% 1289 30% 30% 30% 10% 0% 100% 1290 35% 0% 10% 35% 20% 100% 1291 25% 25% 0% 10% 40% 100% 1292 0% 20% 0% 20% 60% 100% 1293 45% 45% 10% 0% 0% 100% 1294 20% 20% 0% 35% 25% 100% 1295 0% 10% 25% 10% 55% 100% 1296 10% 10% 0% 10% 70% 100% 1297 15% 15% 15% 15% 40% 100% 1298 20% 10% 25% 25% 20% 100% 1299 50% 20% 20% 10% 0% 100% 1300 0% 30% 30% 0% 40% 100% 1301 0% 0% 40% 15% 45% 100% 1302 25% 40% 10% 0% 25% 100% 1303 15% 70% 0% 0% 15% 100% 1304 35% 40% 10% 0% 15% 100% 1305 28% 0% 50% 0% 23% 100%