Patterns of
Innovation among
Urban and Rural
Firms
MASTER THESIS WITHIN: Economics NUMBER OF CREDITS: 30 Credits PROGRAMME OF STUDY: Urban, Regional and International Economics
AUTHOR: Malin Allgurin JÖNKÖPING May 2017
The Effects of Broadband
i
Master Thesis in Economics
Title: Patterns of Innovation among Urban and Rural firms – The Effects of Broadband
Author: Malin Allgurin Tutor: Sara Johansson Date: 2017-06-12
Key terms: Innovation, Broadband, Urban, Rural
ABSTRACT
This paper explores the patterns of innovation among firms by using unique survey data on more than 2000 Swedish firms. The purpose of the study is to examine if broadband availability has an impact on firm-level innovation and explore differences between firms in urban and rural municipalities. A probability likelihood method is used estimating the probability of a firm being innovative or not. Using two types of explanatory variables, firm characteristics and location characteristics, the analysis show that firm characteristics are the main determinants of firm innovation. A firm that wants to increase their chances to be innovative should choose an urban location. The availability of broadband increases the probability of innovation. Firms with a good broadband connection can reach other types of knowledge and information. Organisations should therefore strive to have a good broadband connection with a high-speed internet to access external knowledge and increase the innovative activity.
ii
Table of Contents
1. INTRODUCTION... 1
2. THEORY AND PREVIOUS RESEARCH ... 3
2.1 What drives innovation? ... 3
2.2 Agglomeration theories ... 5
2.3 The importance of cities ... 6
2.4 Possibilities at rural places ... 7
2.5 The importance of Broadband ... 9
3. A SURVEY ON FIRM INNOVATION ... 12
3.1 Data... 12
3.1.1 Broadband ... 15
3.1.2 Innovation ... 17
4. ECONOMETRIC METHODS ... 19
5. EMPIRICAL RESULTS ... 24
5.1 Firm Characteristics and Urban vs Rural Municipalities ... 24
5.2 Local and Regional Characteristics ... 26
6. CONCLUSIONS ... 29
7. REFERENCES ... 30
iii
Figures
Figure 1 Sectioning of municipality groups in Sweden ... 14
Figure 2 The availability of broadband within Sweden 2009 and 2015 ... 16
Figure 3 Broadband availability in Swedish municipalities 2012 ... 17
Tables
Table 1 Description of the municipality groups in Sweden ... 13Table 2 Municipalities divided in nine subgroups ... 13
Table 3 The whole population vs. the sample population ... 15
Table 4 Type of innovation in all firms, in each group, respectively ... 18
Table 5 Combinations of innovation types in all firms, in each group, respectively ... 19
Table 6 Variables used in the regressions ... 21
Table 7 Regression Output – Effects on Innovation ... 25
Table 8 Correlation among variables ... 27
Table 9 Regression Output – Effects on Innovation – Local Characteristics ... 27
Appendix
Table 10 Grouping of municipalities in Sweden ... 37Table 11 Regression Output – Effects on Product Innovation ... 39
Table 12 Regression Output – Effects on Service Innovation ... 40
Table 13 Regression Output – Effects on Process Innovation ... 41
Table 14 Regression Output – Effects on Product Innovation – Local Characteristics . 42 Table 15 Regression Output – Effects on Service Innovation – Local Characteristics .. 43
Table 16 Regression Output – Effects on Process Innovation – Local Characteristics . 44 Table 17 Regression Output – VIF Test ... 44
1
1. INTRODUCTION
The economic activity is becoming increasingly concentrated in regions where the labor force has a high knowledge level. In dense and knowledge-rich environments it is easy for knowledge spillovers to occur. Knowledge intensive business therefore benefit from clustering together. Consequently, firms in cities dominates when it comes to innovation and growth. Innovation is a process that requires different kind of knowledge and is driven by firm and local characteristics. A firm needs to combine different knowledge sources, both internal and external, to increase their chances to be innovative. The external sources to knowledge increases with the size of the firm, by being a multinational company, do exports and collaborate with other firms and institutes.
Both theoretical and empirical research show that productivity, innovation and growth benefit from the density and diversity in urban environments. Explained by both internal and external economies of scale, indicating that the productivity increases and cost decreases with the size of the local market. Scale economies are also self-reinforcing because large regions in terms of population and economic activity have better conditions for economic growth. A region with good economic growth will generate new jobs and attract new residents. These forces explain the strong urbanization around the world and why urban areas are important. However, rural areas can still grow and be innovative without the knowledge spillovers that urban areas have. The spatial aspects of knowledge exchange and formation of knowledge networks is more complex than stated previously (Boschma, 2005). In recent studies, the perspectives of proximity are extended to non-spatial magnitudes relating to cognitive, organizational, institutional and social adjacency (Boschma, 2005; Boschma & Frenken, 2010; Ponds et al., 2007).
Broadband makes interaction between firms located with geographical distances possible. With broadband, firms can access knowledge from different parts of the world regardless any distances. Communication between partners is possible and firms can attract new conceivable customers and can export goods outside their home region.
The purpose of this paper is to analyze firm-level and location specific factors that explain firm innovations. Of particular interest is the availability of high speed broadband and to see if its impact on innovation is different in rural and urban municipalities. Broadband is in this paper defined as an Internet connection with at least 100mbit/s. By using a logistic regression model and estimating the logit transformed probability of the relationship through a maximum
2
likelihood method results show that firm characteristics impact innovative activities positive among firms. Firms located in metropolitan areas tend to be more innovative than firms in rural areas. The availability of broadband increases the likelihood of a firm to be innovative. However, the availability of broadband is higher in the metropolitan areas. Other local and region characteristics such as density and access to highly educated labor does impact the likelihood of a firm to be innovative in a positive way.
By quantitative analysis of the relationship between firm innovations and the availability of broadband, this paper contributes to previous literature in two ways. First, the data used include even the smaller firms (1 to 9 employees) in contrast to, e.g. the Community Innovation
Survey (CIS). Also, most of the previous literature in this field have focused on innovation
within large metropolitan regions. This analysis includes even the firms located outside these areas. The survey data indicates that even rural firms are innovative, even though the fraction is somewhat greater among urban firms.
The second contribution of the paper is found in the analysis of broadband availability and its impact on innovation. This type of studies is lacking in the literature since most studies concerning broadband have looked at different measures on its impact on firm performance. However, Bertschek et al. (2013) studied how broadband impact firm performance measured as realized process and product innovations. The result show that broadband Internet has a positive and significant impact on firms’ innovation activity. Since many firms today rely on the internet it is interesting to see how the availability impact their innovativeness. Most previous literature regarding broadband have focused on bigger firms. As mentioned previously, this study will also include the smaller firms.
The first chapter describes previous theoretical and empirical research on innovation and the distribution of economic activity in knowledge based economies. Previous literature stresses the importance of face to face interaction and its importance for innovation. However, the use of broadband and other spatial proximities enables innovation regarding distances. The first chapter goes over previous literature in five sections: what drives innovation? agglomeration theories, the importance of cities, possibilities in rural areas, and the importance of broadband. The following chapters then describe the survey and data used, the method, results and at last a conclusion.
3
2. THEORY AND PREVIOUS RESEARCH
In the 14th century, only 10% of the European population live in cities. Most people live
outside cities and their main occupation is agriculture. Until the beginning of the 19th century
urbanization increased very slow, but it was here the urbanization wave started. In the beginning of the 21th century, 75% live in cities (Fujita et al., 2000). The work tasks for people
had changed, the traditional agriculture and manufacturing had changed into a society primarily based on input from the human mind. People are now paid to think compared to before when their physical strength was their main contribution to production. When people are paid to think, new ideas and innovations are encouraged. What drives these innovative activities? People have clustered together and face to face interaction foster innovation. However, recent studies show that other spatial proximities such as broadband can increase innovation activities despite any distances.
2.1 What drives innovation?
Innovation involves both high costs and high risks and is often the result of the confrontation of different fields of knowledge (Oerlemans & Meeus, 2005). Empirical studies on firm innovation point out the importance of combining different knowledge sources, internal as well as external to the individual firm (Almeida & Phene, 2012; B. Johansson et al., 2015). The dependence on external knowledge might vary among firms, especially if the firms differ in size. Bigger firms appear to be more innovative compared to small firms. They have both the financial structure to take bigger risks and an internal knowledge pool of sufficient size and scope to come up with new ideas. External knowledge is accessible from different sources. International trade in commodities is a central channel for knowledge and technological diffusion, but even more important for knowledge exchange is the markets for services and labor (Bjerke & Johansson, 2015). People need to personally interact for more complex knowledge to be exchanged or transacted, implying that markets for knowledge intensive services often are very local. Previous research (B. Johansson et al., 2015) shows that local markets for business services is significantly important for mediating knowledge and stimulating innovation renewal.
In research related to this study, there is evidence of how important multinational firms are as disseminators of technologies (Blomström & Kokko, 1998; Keller & Yeaple, 2009). Being a part of a bigger organization helps firms to access knowledge sources within its own corporate group, which is a specific kind of knowledge network. Firms who are a member of a
4
multinational corporation tend to be more innovative than independent corporations (Ebersberger & Lööf, 2005; B. Johansson & Lööf, 2008).
The innovation process can be organized in different ways; within the firm, in collaboration with other firms or institutions, be fully outsourced to external actors or as a combination of internal and external knowledge (Cantwell & Zhang, 2012). Previous studies show that firms increase their likelihood of being innovative when collaborating with other firms and institutes (Roijakkers & Hagedoorn, 2006; Salancik & Pfeffer, 1978). Collaboration increases the opportunity to pool resources, where firms can have complementary roles (Wernerfelt, 1984). As mentioned above, knowledge exchange often requires face-to-face contacts, which implies that markets for knowledge-intensive services are geographically bounded. Physical distances have a negative impact of commodity trade and has an even larger role in the spatial formation of service markets. In these types of markets, knowledge-intensive services are clustered together in the same area. The localized nature of knowledge transfers is just one of the reason knowledge demanding production such as R&D activities and knowledge-intensive services tend to agglomerate in space (Acs et al., 1992; Feldman, 1994). A face-to-face interaction is often required in the exchange of complex knowledge in a process of interactive learning. Moreover, the cost of obtaining external knowledge through market-based transactions, inter-organizational collaborations or in the form of pure spill overs are often higher if the persons involved are positioned far from each other (Bjerke & Johansson, 2015).
If looking beside the geographical location among network participants, the context of knowledge network does have several non-spatial dimensions. Research within this field comes from literature on evolutionary economics, whit the argument that firms tend to innovate within the area of their expertise. This means that the exchange of knowledge and collaborations tend to be very close in cognitive/technological space rather than where they are located (Nelson & Winter, 1982).
Innovation is stimulated by firm characteristics (Bjerke & Johansson, 2015) such as the size of the firm, corporate group, being an exporter, by international trade with commodities and collaboration with other firms. Innovation is also stimulated by the local economic milieu (Asheim & Isaksen, 2002; Moodysson et al., 2008; Simmie, 2003; Trippl, 2011) and very dependent on the location of the firm. These environmental factors affect the economic geography and is self-reinforced. Regions where innovation occur is often clustered together and have followed the patterns of agglomeration.
5
2.2 Agglomeration theories
Traditionally, the study of industrial clusters is explained by “agglomeration economics” which came to prominence by the work of Marshall (1890), Jacobs (1969) and Porter (1990). This literature suggests that firms pick their geographic location to get the advantage of local returns to scale to benefit their industry. A more recent stream of literature is within the realms of the new economic geography. This theory emphasizes the importance of the size of the region and that the driving forces of economic growth comes from within the region. The explanation for regional development can be expected to depend on the regions own market size due to economies of scale and the demand of product variety. The base in this theory is that big market regions can see a competitive advantage because they attract firms with a high productivity. Unless high congestion effects, such as high real estate prices, eroding the attraction of a larger market, these regions also attract households and labor (Fujita et al., 1999). These effects lead to what the literature calls agglomeration economies, that drives growth in the bigger regions. Agglomeration theories explains why cities and metropolitan regions, with its density, diversity and accessibility to different economic inputs, stimulate economic growth (Krugman, 1991).
According to Duranton and Puga (2004) there is three mechanisms that constitutes the micro-foundations of agglomeration economies: sharing, matching and learning. Sharing helps firms to improve and grow by sharing indivisible facilities. Also, sharing the gains from the broader variety of input suppliers that can be sustained by a larger final-goods industry and sharing the gains from the narrower specialization that can be sustained with larger production. The matching mechanism improves either the expected quality of matches or the probability of matching. It also improves hold-up problems. By being in a bigger city, both firms and workers have a wider pool of alternatives to choose from. Matching can therefore be more precise compared to smaller regions where the supply and demand is not as broad. Least, the learning mechanism is based on the generation, the diffusion, and the accumulation of knowledge. When people with different knowledge and experience meet, they learn from each other and new knowledge is generated. These three mechanisms are said to foster agglomeration, but why do people want to move to the cities?
Two interrelated mechanisms are suggested in the literature on why cities attract people in general and particularly people with a higher education. The first, and most traditional view offered by economists is that places attract people by matching them to jobs and economic opportunities. The second mechanism is presented in more recent studies and suggests that
6
places attract people by providing a range of lifestyle amenities (see Gottlieb, 1995). This is particularly true among the younger generations who are more mobile and among high-educated individuals who possesses the resources needed to move. Florida (2006) argues that universities attract talented people to cities, both professors and students. A region with more college graduates tend to have a higher quality of life (Shapiro, 2006). Currid (2007) argues the creative industries such as fashion, art and music drives people to cities. Lloyd and Nichols Clark (2001) refers to the city as an “Entertainment Machine” and argue amenities are a key component of modern cities. Kotkin (2002) claims high-technology industries and employees are attracted to a variety of lifestyle amenities. A significant relationship is found between amenities and city growth (Glaeser et al., 2001). High human capital workers increase productivity, and these places where high human-capital live are pleasant to live.
Cities attract people to come and live there instead of rural places. The urbanization started as a response to the industrialization. The workplaces moved with the production and so did the people. The cities became more dense and diverse as more people moved there. How come cities are important and what possibilities does rural places have when it comes to growth?
2.3 The importance of cities
Jacobs (1961, 1969) argues cities play an important role for economic development, through the generation and mobilization of new knowledge. Cities, with their diversity of inhabitants creates interaction among people with different knowledge. Such interactions generate new and original ideas. In other words, the density of people encourages interactions and promote the creation and development of new products and new technology (Florida, 2002a).
In urban areas, a higher concentration of people and firms generates an environment in which knowledge moves quickly from person to person and from firm to firm. Therefore, large, dense locations inspire knowledge flows and knowledge exchange, thus facilitating the spread of new knowledge that brings innovation and the creation of new goods and new ways of producing existing goods (Carlino, 2001). Often, knowledge is extremely complicated and contains complex elements meaning it can only be transferred via face-to-face interactions. Such interactions are often confined to inter-firm networks that tend to be bounded by geographical proximity (Andersson & Karlsson, 2002, 2006; Karlsson, 1997; Karlsson & Manduchi, 2001). There is strong evidence from both Europe and the US that knowledge flows measured by patent citations are restricted within a relatively narrow geographical range (Almeida & Kogut, 1999; Jaffe et al., 1993; Maurseth & Verspagen, 1998; Verspagen &
7
Schoenmakers, 2000). The high concentration of people in urban areas lead to an increase in diversity. Innovation is stimulated by diversity since it often requires different kinds of knowledge that different kind of people possesses. Innovation is therefore more common in the bigger, denser and knowledge intensive regions.
The new growth theory based on Romer (1990) emphasizes the link between knowledge and economic growth. Other empirical studies claim that human capital is strongly associated with both urban and regional growth. A strong relationship is found between human capital and city growth by Glaeser et al. (1995). Their findings mention that cities who start off with more educated people exhibit higher rates of population growth as time goes on. Firms tend to cluster together in regional agglomerations, rather than interfirm linkages. This is because they have access to common pools of labor and talent (Glaeser, 2000). Furthermore, the spillover effects in the accumulation of human capital increases the productivity among workers (Black & Henderson, 1999; Eaton & Eckstein, 1997). Cities with high concentration of human capital tend to see a regional employment growth over a considerable time frame. Both Simon (1998) and Glendon (1999) found strong relationships between these two variables.
Technology has also a positive impact on economic growth in cities. Florida (2002a) finds a positive relationship between technological creativity (measured as regional innovation and high-technology industry) and cultural creativity (measured by a “bohemian index”)1.
Furthermore, a positive relationship is found between regional concentrations of high-technology industry and several measures of diversity (Florida et al., 2006). The different measures of diversity includes the percent of the population that is foreign born, the percent that is gay, and a composite diversity measure2. Florida (2002b) claims that a region has
economic growth due to underlying conditions facilitating creativity and diversity.
2.4 Possibilities at rural places
Despite the strong urbanization some businesses rather localize at a rural location. For a country like Sweden, with a strong export of raw material produced in rural areas such as forest- and metal goods, rural places are important. A big challenge for rural regions is to attract highly educated people. Most people with high education move to bigger cities for jobs offering a higher salary. However, industries outside the cities also need high educated workers to maintain their competitiveness in the international market. A challenge for rural areas is to
1 bohemian index= the regional share of artists, musicians, and cultural producers
2 This index is a sum of the rankings of the three individual diversity measures: the gay index, bohemian index,
8
attract skilled workers to primary and processing industries that becomes more and more knowledge based (Bjerke et al., 2012).
Firms in rural areas finds it difficult to attract high educated labor, therefore they are more dependent on external knowledge sources. External knowledge can be accessed through markets for service, networks and cooperation’s. When looking beside the geographical location among network participants, the context of knowledge network has several non-spatial dimensions. Research within this field comes from literature on evolutionary economics, with the arguments that firms tend to innovate within the area of their expertise. The exchange of knowledge and collaborations tend to be very close in cognitive/technological space rather than location (Nelson & Winter, 1982). The external knowledge is useful if it complements the internal knowledge (Mowery & Rosenberg, 1989). In both external and internal knowledge, the knowledge recipients need some sort of absorptive capacity (Cohen & Levinthal, 1990). To receive external knowledge, firms need common knowledge bases and codes for communication (Boschma, 2005; Boschma & Frenken, 2010).
Four different non-spatial proximities are distinguished by Boschma (2005): cognitive, organizational, institutional and social proximity. In short, these dimensions relate to technology and knowledge bases (cognitive proximity), hierarchical structures (organizational proximity), legal frameworks (institutional proximity) and personal relationships (social proximity). Boschma argues these four dimensions need to be considered to understand the geographical structures for interactive learning. Small geographical distances are neither a sufficient condition nor necessary for learning. Instead, proximity in space matters for learning because it enables the coordination of numerous activities and individuals. As an example of both organizational and social proximity is being a part of a scientific or professional community. As a source of knowledge, researchers use their networks of friends and colleagues (Allen, 1977). By being a member of scientific communities, individuals tend to adopt logic of knowledge sharing and circulation (Bercovitz & Feldman, 2008; Gittelman, 2007; Knorr-Cetina, 2009; Merton, 1973; Partha & David, 1994), with common norms, codes, and channels used across regions and countries. Prior working relationships and professional networks simplifies knowledge exchange (Breschi & Lissoni, 2009; Sorenson & Singh, 2007) because these are relationships that can last even if people switch location of their workplace (Agrawal et al., 2008; Fleming et al., 2007; Kerr, 2008; Singh, 2005).
9
According to previous empirical research, organizational and cognitive proximities have influenced the formation of knowledge networks and on the innovativeness from firms (Rallet & Torre, 1999; Torre & Wallet, 2014). What seems to be of crucial importance for the capacity of firms to assimilate external knowledge is cognitive proximity. It does not matter if such knowledge is intentional or unintentional (Oerlemans & Meeus, 2005). On the other hand, organizational proximity is needed to form effective structures for sharing knowledge. Interestingly, the geographical proximity seems to be of no use if it does not overlap with some type of organizational relationship (Rallet & Torre, 1999).
2.5 The importance of Broadband
Previous it has been argued why people move to cities and why cities are important, but the digital evolution have changed how we look at geographical locations. However, just like any other social and economic activity, which is “inscribed in space and takes place” (Swyngedouw, 1993, p. 305), the Internet, as a platform for virtual interaction among individuals and organizations, has a geographical component. Even though early commentators claim that the Internet has an anti-spatial nature (Mitchell, 1996). Interestingly, the fast Internet penetration resulted in deterministic views on the impact of information and communication technologies (ICTs), declaring the death of cities (Drucker, 1998; Gilder, 1995; Kolko, 2000) distances (Cairncross, 2001), and in general, the end of geography, because of this widespread and fast penetration of ICTs. However, none of these claims have been supported by evidence from empirical investigations. Although we know that “cities are well and alive” (Malecki, 2002, p. 419), and that ICTs did not impact as dramatically as predicted, there is still not sufficient empirical knowledge about the relation between physical space and the Internet (Tranos & Nijkamp, 2012). Nowadays people talk about broadband when they talk about the internet. The term “broadband” is commonly referred to the provision of high-speed data transmission, which allows Internet services encompassing streaming media, phone, gaming and interactive services. Since the late 1990s, broadband technologies have been implemented by countries around the world. The phenomenon of broadband has changed the way individuals live, work and communicate. Likewise it has an impact on firms, markets and government operations. (Arvin & Pradhan, 2014). What impact have broadband internet had?
GDP and Productivity
Czernich et al. (2011) provides empirical evidence that an increase in broadband penetration with 10 percent entails a yearly increase in growth per capita between 0,9-1,5 percent in OECD
10
countries. Atif et al. (2012) look at the effect broadband has on production per capita. Significant results are found between broadband and economic growth.
Broadband can be given as public support and help firms to increase their productivity (Akerman et al., 2015). Even though firms’ total productivity increases due to the availability of broadband, it decreases the marginal productivity among low educated personnel with less demanding work tasks. Broadband might be a substitute for less demanding or routine tasks performed by employees with a lower education. Personnel with more qualified tasks will benefit more from broadband and adapt to it faster. Structural and/or strategic changes among companies are necessary for assimilating the potential productivity gain that broadband provides (Colombo et al., 2013). Firms need to start using broadband applications to make production more effective. Otherwise the broadband won’t have an impact on productivity.
Labor Market
A region going from no broadband provider, to 1-3 providers can see a local employment growth by 6,4 percentage points (Kolko, 2012). In contrast, De Stefano et al. (2014) do not find any evidence for a causal relationship between broadband and employment per working place. Broadband has positive effects on employment in urban areas, but no or negative effects in rural areas (Kandilov & Renkow, 2010). However, high broadband use in rural areas has positive effects on employment (Whitacre et al., 2014a). In comparison, gaining access to broadband services in a county is associated with about 1.8 percentage points increase employment rate with larger effects in rural and isolated areas. The effect of broadband could differ depending on the industry (Boström & Toms, 2015; Fabritz, 2013).
Broadband seems to have a positive effect on employment in most cases, still, it does not necessarily mean a positive effect on the employment rate due to increase in population at the same time. Kolko (2012) finds positive results on the employment but not on the employment rate. However, Fabritz (2013) makes a comparison between the employment rate in urban and rural areas and draws the conclusion that broadband has a stronger impact in rural compared to urban areas. In contrast, Whitacre et al. (2014a) find that broadband decrease the unemployment in areas with a high use of broadband. The expansion of high-speed broadband in rural Sweden has a positive effect on rural workplaces (Stenfeldt & Andersson, 2016). If the availability of broadband would increase by 10 percent, the number of startup businesses would increase by 1,6 percent in rural areas that are connected to urban areas (Kim & Orazem, 2012). In addition, Whitacre et al. (2014a) find positive effects on the availability
11
of broadband and the number of workplaces. Either through more startups or less businesses that liquidates in the area.
Broadband tends to increase (decrease) the productivity of high skilled (low skilled) labor and therefore their wages in the same manner (Akerman et al., 2015). The growth of the median income in household is higher in urban areas compared to rural areas (Whitacre et al., 2014a). Furthermore, households with a higher usage of broadband have higher median incomes (Whitacre et al., 2014b). Higher skilled workers tend to have a higher salary compared to lower skilled workers. Atasoy (2013) claims broadband technology is complementary to skilled workers and has a greater effect among college-educated workers and in industries and professions with more college-educated workers employed. Investments in high-speed internet is associated with higher salaries and higher employment growth in regions that already has a high concentration in IT use, high salary, high population and high skills. Regions who lack these characteristics do not see a payoff from investments in high-speed broadband. In other words, widely deployed Internet worsened regional income inequality (Forman et al., 2012).
In the Future
The geographical breadth becomes wider with the use of broadband. European inventors with a high level of schooling, such as a university or doctoral degree, rely more on external spillovers regardless of the geographical location of their sources (Giuri & Mariani, 2013). Internet can help inventors to access geographically wider external knowledge and knowledge spillovers and increase innovation among firms. Specially the younger generation who is used to the internet. Many of the non-spatial proximities is used through the internet. By the help of Google or other search engines information is easily found. The most important is probably social media. Today it is important for firms to be on social media such as Facebook, Instagram and Twitter to reach their clientele. The increase in the availability of broadband internet might help firms to locate further away from each other since the distance becomes irrelevant with the use of internet.
12
3. A SURVEY ON FIRM INNOVATION
The term innovation is hard to define. What can be considered as a new product, service or process? The Oslo manual is a collaboration between 30 countries with guidelines for gathering and understanding innovation data. The “Community Innovation Survey” (CIS) is devised from the Oslo manual (Oecd, 2005). Over the years, the results from the CIS survey have refined the Oslo manual to keep it up to date. In the manual, four types of innovations are distinguished: product innovations, process innovations, marketing innovations, and organizational innovations. According to the OLSO manual, the definition of an innovation is “… the implementation of a new or significantly improved (good or service), or process, a new market method, or a new organizational method in business practice, workplace organization or external relations…, where the minimum requirement for an innovation is that the product, process, marketing method or organizational method must be new (or significantly improved) to the firm” (Oecd, 2005). The CIS survey is common in research regarding innovation around the world.
3.1 Data
Since 1990, the CIS survey has been completed every other year in the European Union. This paper is based on a survey on firm innovations made by the Swedish Board of Agriculture (2016) and it is very like the CIS survey, but even the smallest firms with the minimum restriction of one employee where able to participate. Some questions need to be modified to address even firms with less than ten employees. Telephone interviews where made instead of postal questionnaires. This method requires less reading from the respondent’s part and allows some guidance from the interviewer part. Moreover, in interviews by phone, questions must be stated and posed in a more direct manner compared to questions in written questionnaires. Even in interviews by phone, it might be hard for the respondents of the survey to distinguish if their firm is innovative or not. This becomes problematic in a sense that what is an innovation can differ between individuals. A small change might be qualified as an innovation from one person’s point of view while another person sees it as a necessary routine (Tether, 2001).
The sample of firms interviewed consist of a little bit over 2000 different firms located in 247 out of the 290 municipalities in Sweden. The sample of firms is delivered by Statistics Sweden and is stratified with respect to firm size, location and industry to reflect the true distribution.
13
To find out how representative the sample is, the true distribution needs to be considered. Sweden consists of 290 municipalities categorized in three groups: A=Large cities and municipalities near large cities, B= Medium-sized towns and municipalities near medium-sized towns, and C= Smaller towns/urban areas and rural municipalities. The classification of the municipalities is produced by the Swedish Association of Local Authorities and Regions SALAR3. This classification includes 46 municipalities in group A, 108 in group B and 136 in
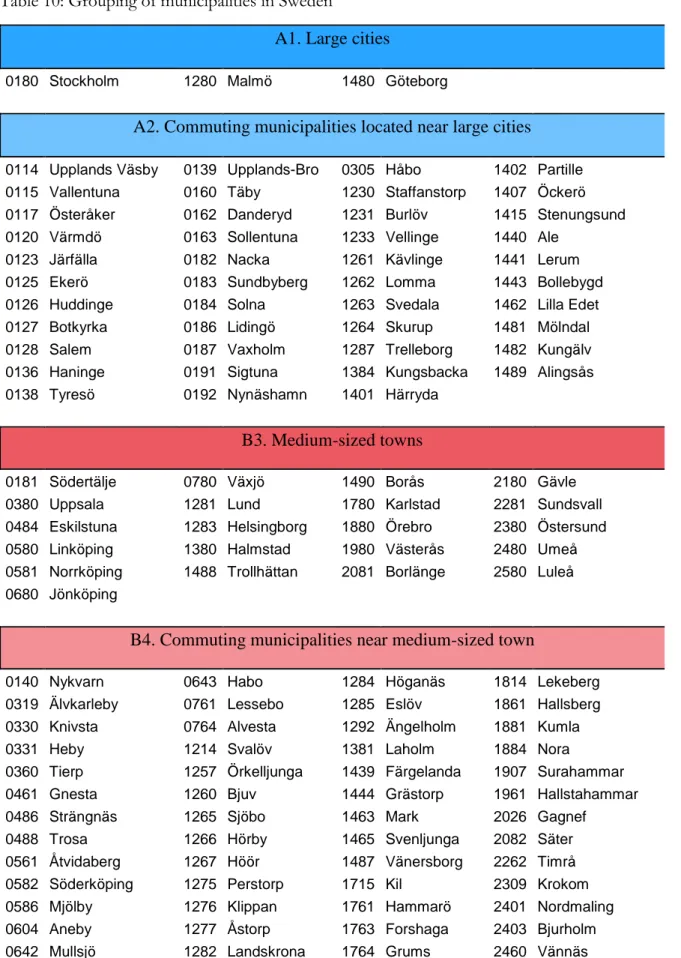
group C (Table 1). These three groups are divided in smaller sub groups based on structural parameters such as population and commuting patterns (Table 2). For a description on which municipality belonging to which group, please see Table 10 in Appendix.
Table 1: Description of the municipality groups in Sweden
Main Group Short Definition Number Percent of Total A Large cities and municipalities near large
cities
46 15.86% B Medium-sized towns and municipalities
near medium-sized towns
108 37.24% C Smaller towns/urban areas and rural
municipalities
136 46.90%
Table 2: Municipalities divided in nine subgroups
Main Group Municipality Group Short definition A. Large cities and
municipalities near large cities
A1. Large cities At least 200 000 inhabitants in the municipalities largest urban area A2. Commuting
municipalities located near large cities
At least 40% commute to work in a large city or municipality near a large city
B. Medium-sized towns and municipalities near medium-sized towns B3. Medium-sized towns
At least 40 000 and less than 200 000 inhabitants in the municipalities largest area B4. Commuting
municipalities near medium-sized town
At least 40% commute to a bigger city B5. Commuting
municipalities with low commuting rate near medium-sized towns
Less than 40% commute to a bigger city
C. Smaller
towns/urban areas and rural
municipalities
C6. Small towns At least 15 000 and less than 40 000 inhabitants in the municipalities largest city C7. Commuting
municipalities near small towns
At least 30% commute to and from a small town/urban area
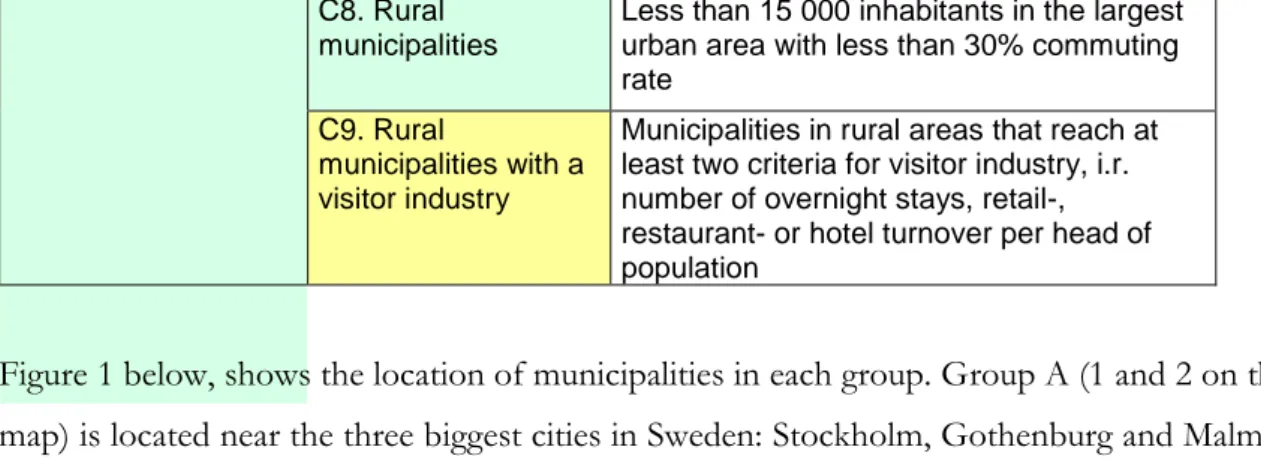
14
C8. Rural municipalities
Less than 15 000 inhabitants in the largest urban area with less than 30% commuting rate
C9. Rural
municipalities with a visitor industry
Municipalities in rural areas that reach at least two criteria for visitor industry, i.r. number of overnight stays, retail-, restaurant- or hotel turnover per head of population
Figure 1 below, shows the location of municipalities in each group. Group A (1 and 2 on the map) is located near the three biggest cities in Sweden: Stockholm, Gothenburg and Malmö. Whereas the municipalities belonging to group C (6, 7, 8 and 9 on the map) are in the northern parts of Sweden that is more rural compared to the southern parts.
Figure 1: Sectioning of municipality groups in Sweden
Source: SALAR, own processing
Municipality groups 1 2 3 4 5 6 7 8 9 SWEDEN
Sectioning of municipality groups
Stockholm
Malmö Gothenburg
15
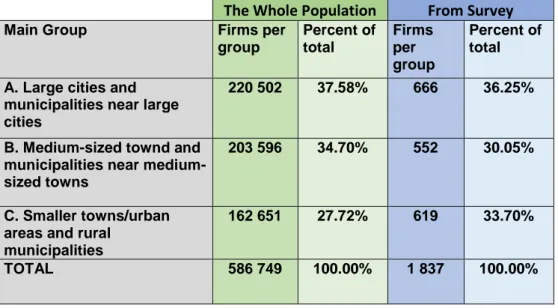
Table 3 below represents the number of firms per group, in the whole population and in the survey sample respectively. Most firms in Sweden belongs to a municipality in group A. Almost 40% of all firms belong to group A. Not even 30% of all firms in Sweden belongs to a municipality in group C. The firms interviewed are more evenly distributed between the groups. The sample do not correspond to the true distribution therefore sample weights are applied in the analysis.
Table 3: The whole population vs. the sample population
The Whole Population From Survey
Main Group Firms per group Percent of total Firms per group Percent of total A. Large cities and
municipalities near large cities
220 502 37.58% 666 36.25%
B. Medium-sized townd and municipalities near medium-sized towns
203 596 34.70% 552 30.05%
C. Smaller towns/urban areas and rural
municipalities
162 651 27.72% 619 33.70%
TOTAL 586 749 100.00% 1 837 100.00%
3.1.1 Broadband
From a global perspective, Sweden is a leading country in information technology. Statistics from both national and international sources indicate growing broadband availability and increasingly frequent use of broadband service (Jägeberg & Lindeberg, 2011).
In the early 2000, the main driving forces for the development of broadband came from the suppliers rather than the customer’s requests (Aronsson et al., 2003; Hamngren et al., 2000). The broadband infrastructure of today is probably still based on this (Jägeberg & Lindeberg, 2011). The geographical access to broadband can have a big impact for both private customers and firms. In terms of economic growth, the areas with lack of broadband connection or connection of low quality tend to fall behind. Most of these places are in the rural parts of Sweden and many of these regions already struggle to attract and keep residents and firms. Firms who drive the broadband technology expansion forward are striving to make a profit. By focusing on urban areas with more customers available they increase their potential profits. The density in urban areas decreases the development price per customers whereas it can be expensive in rural places (Stenfeldt & Andersson, 2016). However, the Swedish Government
16
has a goal for the development of broadband. By 2020, over 90% of all households should have a broadband connection with the speed of at least 100 mbit/s. To reach this goal, and to speed up the development of high speed connection even in rural areas, the government has committed 3.25 billion Swedish crones (Jordbruksverket, 2015). To achieve this goal, the money cannot be used to what is known as urban localities4. The classification of these urban
localities are areas with a minimum of 200 inhabitants and a maximum of 200 meters between each house. The aim is to try to narrow the gap between urban and rural areas. In 2015, 73.78% of the urban population in Sweden had an internet access that met the goal set by the Government. Compared to the rural areas where only 20.84% of the population had the internet access of 100mbit/s (Kojo & Wigren, 2015).
Figure 2: The availability of broadband within Sweden 2009 and 2015
Source: PTS, own processing 4 TÄTORT in Swedish Workingplaces (%) (.8,1] (.6,.8] (.4,.6] (.2,.4] [0,.2]
Percent share by municipality 2009
Workplaces with broadband connection
Workingplaces (%) (.8,1] (.6,.8] (.4,.6] (.2,.4] [0,.2] No data
Percent share by municipality 2015 Workplaces with broadband connection
Stockholm Stockholm
Gothenburg Gothenburg
17
The availability of broadband at working places in Swedish municipalities has changed between 2009 and 2015 as illustrated in Figure 2. In 2009, 250 of all municipalities had a broadband availability among their workplaces below 50%. Not even half of the workplaces within the municipality had access to broadband with the speed of at least 100mbit/s. During the same year, four municipalities could offer over 80% of their workplaces broadband with the speed of at least 100mbit/s. In 2015, 199 municipalities could not offer half of their workplaces with broadband but 12 municipalities could offer more than 80% of the workplaces high speed broadband. The availability of broadband increases each year among workplaces.
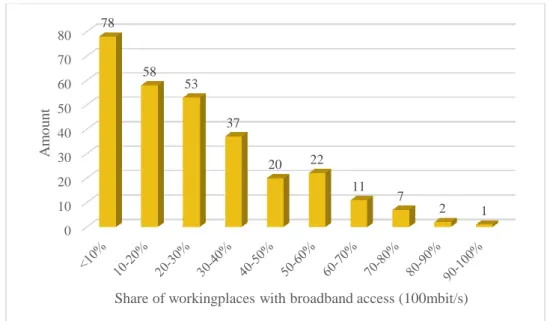
The broadband variable used in this analysis represents data from 2012 and its distribution is represented in Figure 3. 78 of the Swedish municipalities could offer less than 10 percent of their working places with broadband with the speed of 100mbit/s. Not even 10 municipalities offer more than 70 percent of their working places high speed broadband.
Figure 3: Broadband availability in Swedish municipalities 2012
3.1.2 Innovation
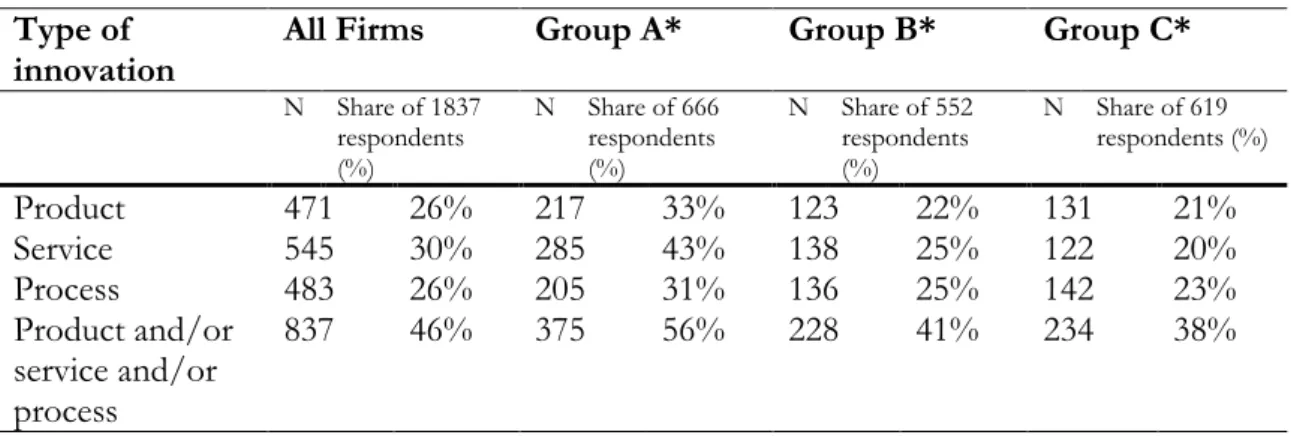
Summarizing the survey responses, Table 4 shows that 46% of all respondents in the survey consider their firm to be innovative in some aspect. There are three categories of innovation: product, service and process. 26% of all firms from the survey has product innovation, 30% service innovation and 26% does process innovation. In this analysis, we are interested to see if the innovativeness differs among firms in the groups. From the firms interviewed, 36,25% belongs to group A, 30,05% belongs to group B, and 33,70% belongs to group C. The percentage of firms being innovative is going down in each group with 56% of the interviewed
0 10 20 30 40 50 60 70 80 78 58 53 37 20 22 11 7 2 1 A m o u n t
18
firms in group A is innovative, 41% in group B, and 38% in group C. These results are not surprising looking at previous literature. Cities are more dense and diverse and knowledge moves quickly between people and firms. This means that large, dense locations inspire knowledge flows and knowledge exchange, thus facilitating the spread of new knowledge that brings innovation and the creation of new goods and new ways of producing existing goods (Carlino, 2001). Young people who are eager to learn move to the cities to study and cities attract college-graduates with their amenities. It is a challenge for rural places to attract and to keep highly educated personnel.
Table 4: Type of innovation in all firms, in each group, respectively
Type of
innovation All Firms Group A* Group B* Group C*
N Share of 1837 respondents (%) N Share of 666 respondents (%) N Share of 552 respondents (%) N Share of 619 respondents (%) Product 471 26% 217 33% 123 22% 131 21% Service 545 30% 285 43% 138 25% 122 20% Process 483 26% 205 31% 136 25% 142 23% Product and/or service and/or process 837 46% 375 56% 228 41% 234 38%
*A= Large cities and municipalities near large cities
*B= Medium-sized towns and municipalities near medium-sized towns *C= Smaller towns/urban areas and rural municipalities
The difference in economic structure between urban and rural places can be seen when looking at what type of innovation is the most common in each group. In large cities and municipalities near large cities, the most common type of innovation is services. In medium-sized towns and municipalities near medium-medium-sized towns, both service and process innovations are common. In smaller towns/urban areas and rural municipalities, process is the most common innovation type. Sweden is a strong exporting country of raw material such as forest- and metal goods, produced and processed in these areas with a high share of manufacturing industries.
Table 5 presents a more detailed description of the interrelations between different types of innovation in the full sample and in each group respectively. Considering all innovative firms in the sample, 48% does one type of innovation, 25% does two, and 27% does all three types, product, service and process innovations. Out of the 212 firms doing two types of innovation the most common combination is product and service innovations. Service is the most
19
common innovation type among all the innovative firms in the sample, 65% of the firms does service innovations.
Table 5: Combinations of innovation types in all firms, in each group, respectively
Type of Innovation
All Firms Group A* Group B* Group C*
N Share of 837 innovative firms (%) N Share of 375 innovative firms (%) N Share of 228 innovative firms (%) N Share of 234 innovative firms (%) One Type 400 48% 165 44% 114 50% 121 52% Two Types 212 25% 88 23% 59 26% 65 28%
All three types 225 27% 122 33% 55 24% 48 21%
Product 471 56% 217 58% 123 54% 131 56% Service 545 65% 285 76% 138 61% 122 52% Process 483 58% 205 55% 136 60% 142 61% Product and Service 84 10% 33 9% 26 11% 25 11% Product and Process 58 7% 18 5% 19 8% 21 9% Service and Process 67 8% 37 10% 12 5% 18 8%
*A= Large cities and municipalities near large cities
*B= Medium-sized towns and municipalities near medium-sized towns *C= Smaller towns/urban areas and rural municipalities
Looking at the innovative firms in each group one can see that it is most common to do one type of innovation in all the three groups. Service innovations is most common in large cities and municipalities near large cities and in medium-sized towns and municipalities near medium sized towns. Process innovation is most common in smaller towns/urban areas and rural municipalities. Among the firms doing two types of innovation the most common combination is service and process among firms in large cities and municipalities near large cities. Compared to the other groups where the most common combination is product and service. This is surprising since the most common type of innovation in smaller towns/urban areas and rural municipalities was process.
4. ECONOMETRIC METHODS
The purpose of this study is to analyze the impact broadband availability has on the innovative activity among firms in Sweden. The prime interest is whether firms are innovative or not regarding innovation performance. Accordingly, the dependent variable becomes binary: taking the value of one if the firm is innovative and the value of zero otherwise. The most used empirical strategy in this situation is to use a logistic regression model which estimates the logit transformed probability of the relationships through a maximum likelihood method.
20
This paper explores if the availability of broadband affect firms’ innovativeness. Either, process, service or product innovation. Two types of explanatory variables are used to explain the probability that a firm does innovation: firm characteristics and characteristics of the locality. In this equation, they are expressed as two vectors of predictor groups. Broadband is a local characteristic and is therefore included in that vector. An error term is included. The relationship is specified as:
Logit (Pinnov) = log (
𝑃𝑖𝑛𝑛𝑜𝑣
(1−𝑃𝑖𝑛𝑛𝑜𝑣)) =αi + βi(Firm characteristics) + ϒi(Local characteristics) + εi
The availability of broadband is assumed to shift firm i’s probability to innovate.
A firm’s Broadband Internet use is possibly endogenous with respect to firm innovation since it might be a part of the firm’s strategy. Put it like this, highly innovative firms may be more likely to adopt and start using broadband Internet compared to firms who are not innovative. Possibly indicating a reverse causality. Bertschek et al. (2013) tackle this problem by applying an instrumental variable approach. For this study, broadband Internet use is instrumented by the availability of an internet speed with at least 100mbit/s among firms at the municipality level in Sweden. Hence, the availability of broadband is observed at the municipality level instead of the firm level due to endogeneity.
The analysis is based on survey data, the distribution of firms in the survey sample must be considered and compared with the distribution of the whole population. Deviation between the sample and true firm distribution need to be treated by adding sampling weights to reduce biases in the regression estimates. The sample is weighted for firms’ geographical location, firm size and firm industry since agricultural firms are over represented in the sample, so is rural and small firms. The regression is clustered at the municipality level to correct for heteroskedasticity. We know that multicollinearity is not present after performing a variance inflation factor (VIF) test. Please see Appendix Table 17.
The explanatory variables are presented in Table 6. First presented is the dependent variable, which is a bivariate variable, 1 if the firm is innovative and 0 otherwise. For a firm to be considered innovative they need to have at least one of the following types of innovation, product, service or process. The variable in focus is the availability of broadband. It is used as an instrumental variable and is therefore proxied by the availability at the municipality level. It is defined as the share of working places within the municipality with access to broadband with the speed of at least 100mbit/second.
21 Table 6: Variables used in the regressions
Variable Description
Dependent Variable
Innovative 1=innovative 0=otherwise
Firm variables
Employees Number of employees. The natural logarithm is used Corporate group 1=the firm belongs to a corporate group
0=otherwise
Export 1=the firm has sales outside Sweden 0=otherwise
Collaboration 1=the firm does collaboration with other firms 0=otherwise
Dummy Metropol 1=Metropolitan region 0=otherwise
Dummy Rural 1= Rural region 0=otherwise
Local variables
Density Population density, number of inhabitants per km2 in the
municipality. The natural logarithm is used High Education The accessibility to highly educated people
High education is classified as three years of university studies or more. The natural logarithm is used
Broadband Share of workplaces within the municipality with access to
broadband with at least 100mbit/s. The natural logarithm is used Firm-level variables are included among the regressors. Number of employees is used to discover any difference among small and large firms. Most studies on innovation regards large firms and show they have a positive impact on innovation. However, more recent studies show that even small firms tend to be innovative. The variable corporate group is a bivariate variable that is equal to 1 if the firm belongs to corporate group and 0 otherwise. By being a member of a corporate group the firm has more knowledge inputs and is probably therefore more likely to be innovative. Export is included since previous research stresses that exporting firms tend to be innovative. Moreover, firm collaboration is included since firms who collaborate have access to a wider knowledge base. Collaboration is therefore expected to increase the likelihood of innovation.
22
The location specific variables that are included besides the availability of broadband, are a dummy for metropolitan municipalities and a dummy for scarcely populated municipalities. As mentioned previous, SALAR divide municipalities in Sweden in three groups, A=large cities and municipalities near large cities, B= Medium-sized towns and municipalities near medium-sized towns, C=Smaller towns/urban areas and rural municipalities. These three groups then have subgroups with finer definition of each municipality group. Please see Table 2 previous in the text.
When creating the dummy for metropolitan areas, both municipalities with large cities and commuting municipalities located near large cities are included. The group with smaller towns/urban areas and rural municipalities has four sub groups but only two of them are included in the metropolitan dummy: commuting municipalities near small towns and rural municipalities. Small towns include municipalities with a population of at least 15 000 inhabitants in the largest area and is therefore not included. Rural municipalities with visitor industries do have a strong merchants power during large parts of the year and is therefore not included. Examples of municipalities in the latest group is Borgholm and Båstad which is very attractive during the summer and Åre and Sälen which is very attractive during winter. Location specific variables has been used in previous research since many scholar stress the importance of cities for innovation and economic development. This analysis considers the most apparent features of metropolitan areas. Previous research shows that innovations are more likely to appear in places that are very dense. People move to these regions due to job and economic opportunities but also because they provide a range of lifestyle amenities. Those who move to the metropolitan areas are often from the younger generation since they are more mobile and among high-educated individuals who possesses the resources needed to move. Large regions have better infrastructure for interaction due to the high availability of broadband. Broadband providers want to build their network in the bigger regions where they have the most possible customers.
To investigate the impact on the specific features of metropolitan regions, the regression analysis considers population density, accessibility to highly educated workers and broadband availability. The density variable is defined as number of inhabitants per km2 within the
municipality. The variable highly educated people is a measure of geographical accessibility. Following B. Johansson and Karlsson (2001), Niebuhr (2003) and S. Johansson and Karlsson (2007) it is calculated by travel-time and distance between different regions regarding how sensitive it is to changes in travel-time distances. In this analysis, the measure of accessibility
23
is defined as the sum of accessibility to highly educated people within the municipality and within the surrounding region. A better estimation of the high education variable would be to see how many percent of the workers within the firm who had at least three years of university studies. Unfortunately, this variable was missing in the survey sample and that is why the accessibility of highly educated personnel is used instead.
24
5. EMPIRICAL RESULTS
The analysis is divided into two steps. First, we look at the firm characteristics to see how they affect the firms’ likelihood of being innovative. Second, we add local and regional characteristics to see if the economic milieu plays an important role for a firm’s probability to be innovative.
Estimation results are presented as odds ratios, which expresses the probabilities for firms being innovative or not. In the logistic regression used, all variables estimates are related to their conditional odds ratio. The odds ratio of being innovative is defined as the ratios of the probability of being innovative over the probability of being not innovative.
Odds ratio = (Pinnovative/1-Pinnovative) where P = probability
Following this, we read the exponents as an estimate of the odds ratio among the dependent variable and the predictor when the other variables are held constant. The result of this manipulation is that the odds ratio can be computed by raising e to the power of the logistic coefficient. In other words, the exponential function of the estimated coefficient is the odds ratio associated with a one-unit increase in the predicted variable. If the odds ratio is above 1 it means that the variable increases the likelihood of a firm being innovative. If the odds ratio is below 1, the variable has a negative impact on the likelihood of the firm being innovative.
5.1 Firm Characteristics and Urban vs Rural Municipalities
Table 7 presents the estimation results of the first step in the analysis. It is five model specifications estimated with stepwise introduction of explanatory variables. In the first specification, four firm-level variables are used, number of employees, being a member of a corporate group, if they have sales outside Sweden (exporter), and if they do collaboration with other firms. All these variables have a significant positive impact and increases the probability of a firm to be innovative since the odds ratio is above one. These findings confirm that larger firms tend to be more innovative. Moreover, the results suggest that firms that access external knowledge through participation in export markets, through corporation networks and/or through collaborations have a higher probability of innovation. Collaboration is identified very general and is significant with an odds ratio far above one. These findings indicate that collaboration of any type and for any reason is increasing the likelihood for a firm to be innovative. Number of employees, corporate group, exports and collaboration remain significant throughout all different model specification and has a positive impact on innovation.
25 Table 7: Regression Output – Effects on Innovation
Logistic regression, odds ratios
Variables Model Specification
1 2 3 4 5 Employees 1.098*** 1.090*** 1.090*** 1.089*** 1.090*** (0.0231) (0.0239) (0.0239) (0.0242) (0.0239) Corporate Group 1.813*** 1.796*** 1.800*** 1.802*** 1.791*** (0.346) (0.342) (0.345) (0.346) (0.341) Export 2.422*** 2.388*** 2.386*** 2.388*** 2.447*** (0.517) (0.490) (0.487) (0.487) (0.479) Collaboration 1.987*** 1.955*** 1.951*** 1.951*** 1.964*** (0.276) (0.272) (0.271) (0.271) (0.271) Dummy Metropol - 1.347** 1.367* 1.456 1.345** (0.202) (0.232) (0.333) (0.202) Dummy Rural - 0.724 0.723 0.730 0.931 (0.173) (0.177) (0.175) (0.323) Broadband - - 0.952 - - (0.250) Interaction Broadband Metropol - - - 0.886 - (0.261)
Interaction Broadband Rural - - - - 0.170
(0.363)
Constant 0.457*** 0.432*** 0.440*** 0.433*** 0.430***
(0.0464) (0.0523) (0.0650) (0.0523) (0.0518)
Number of observations 1,478 1,478 1,475 1,475 1,475
Robust standard errors in parentheses
Significant at level *** p<0.01, ** p<0.05, * p<0.1
In the second model specification, two dummies are included to control for metropolitan and rural municipalities and to see if innovation differs depending on the local milieu. In the regression, the dummy for metropolitan areas is significant and the odds ratio is above 1 indicates that being in a larger city or region increases the probability of being innovative. In the third model specification, the broadband variable is included, unfortunately it is insignificant and can therefore not be discussed. Instead an interaction dummy is created for both metropolitan and rural places to see if broadband has a specific effect in either of these regions. In specification 4, the broadband dummy is interacted with the dummy for metropolitan municipalities and in specification 5 the broadband dummy is interacted with the dummy for rural municipalities. As shown in Table 7, these interaction variables are insignificant in both specification 4 and 5.
26
The estimations in Table 7 do not consider the different types of innovation; product, service and process. The overlap between the different types of innovation is relatively common (see Table 4 and 5). More than half of the innovative firms does more than one type of innovation and this makes it harder to interpret the result when the types of innovation is separated. However, Table 11, 12 and 13 in the Appendix present the regression outputs when the three innovation types are separated. When focusing on just product innovation all firm level variables are significant in all model specifications. All firm level variables increase the likelihood for a firm to be innovative. Furthermore, neither urban or rural municipalities is significant nor broadband or any of the interaction dummies. In the regression output for service innovation the firm level variables do not differ from the results regarding product innovation. Considering the local variables, metropolitan areas is significant and affect innovation positively while rural areas is insignificant. Neither the broadband variable nor the interaction dummy variables are significant for service innovation. Considering process innovation, results show that all firm level variables are significant and has a positive impact on innovation. None of the other variables is significant in any of the model specifications. Table 7, indicates that all firm characteristics is significant and has a positive impact on firm innovation. The results in Table 7 also indicates that firms in metropolitan regions tend to be more innovative and firms located at rural places tend to be less innovative. When regional dummies are included the availability to broadband seem to have no effect on innovation. Previous research claims that cities are preferred locations for innovation activities. That is why we further explore some of the distinctive features of metropolitan areas.
5.2 Local and Regional Characteristics
The regression results in Table 7, show that firms in metropolitan areas are more innovative. How come innovation activities are more common in these regions? Previous research show that areas providing density, diversity and interconnectedness attract knowledge intensive activities, which stimulates innovation. Hence, the regression analysis addresses the importance of density, accessibility to highly educated workers and availability of broadband. Table 8 below show the correlation between these variables. Table 18 in the Appendix describes descriptive statistics for these variables.
27 Table 8: Correlation among variables
Density High Education Broadband
Density 1.000
High Education 0.925 1.000
Broadband 0.757 0.804 1.000
Due to the high correlation among density, high education and broadband these three local variables are not included at the same time in the regression to see their impact on innovation. Table 9 below show the results of the regression outputs.
Table 9: Regression Output – Effects on Innovation – Local Characteristics Logistic regression, odds ratios
Variables Model Specification
6 7 8 Employees 1.095*** 1.094*** 1.097*** (0.023) (0.023) (0.0229) Corporate Group 1.779*** 1.796*** 1.760*** (0.338) (0.341) (0.334) Export 2.366*** 2.386*** 2.396*** (0.500) (0.503) (0.508) Collaboration 1.969*** 1.963*** 1.968*** (0.274) (0.272) (0.274) Density 1.085*** - - (0.030) High Education - 1.103** - (0.047) Broadband - - 1.076* (0.045) Constant 0.308*** 0.171*** 0.476*** (0.055) (0.075) (0.047) Number of observations 1,478 1,478 1,475 Robust standard errors in parentheses
Significant at level *** p<0.01, ** p<0.05, * p<0.1
Three model specifications are included in Table 9. Specification 6 includes density, specification 7 the accessibility to highly educated people and specification 8 includes the broadband term once again but this time without the geographical dummies. The four firm characteristics is the same as in the previous regression. Number of employees, corporate group, export and collaboration have again a significant and positive impact on innovation in
28
all tree specifications in table 9. Density, the accessibility to highly educated people and the availability to broadband is significant with an odds ratio above one. Indicating that all three variables has a positive impact on innovation. The natural logarithm of the variables is used in the regression to decrease the variance.
The estimations in Table 9 do not consider the different types of innovation; product, service and process. However, Table 14, 15 and 16 in the Appendix present the regression outputs when the three innovation types are separated. When estimating the product innovation all firm level variables are significant in all model specifications but neither of the local characters. The service innovation result show that firm characteristics increases the likelihood for a firm to be more service innovative. All local and regional characteristics are significant and increases the probability of a firm to be service innovative since the odds ratio is far above one. In the estimation regarding process innovation all firm characteristics is significant with a positive impact on innovation while neither of the local and region characteristics are significant.
29
6. CONCLUSIONS
The purpose of this paper is to analyze firm-level and location specific factors that explain firm innovations. Of particular interest is the availability of high speed broadband and to see if it impacts innovation differently in rural and urban municipalities. The survey data used in this empirical analysis provides a rich material on innovations among firms in all size classes and all types of locations. Using two types of explanatory variables, firm characteristics and location characteristics, the analysis show that firm characteristics are the main determinant of firm innovation. Being a member of a corporate group increases the likelihood of a firm to be innovative, so does export activities and collaboration with other firms. By being a member of a corporate group firms can use knowledge from all firms within the group. Exporting firms have market access and networks outside the national boundaries and can reach knowledge outside Sweden. For collaboration, the findings indicate that collaboration of any type and for any reason is increasing the likelihood of a firm to be innovative. Looking at location characteristics, a firm should locate at an urban location to increase its chances to be innovative.
To further explore the locational advantages of metropolitan areas the analysis includes three specific location characteristics that distinguish metropolitan areas: density, high education and broadband. All these three variables are correlated and therefore not included at the same time in the regression. Both density, high education and the availability of broadband is significant with an odds ratio above 1 when included in the regression. This means all these three variables increases the likelihood for innovation. However, the analysis show that firm characteristics are the main determinant of firm innovation, the locational advantages may impact firm characteristics and could be an interesting research question for further research. Several questions remain unanswered in this paper. First, innovation activities in small firms need to be further explored. The size of the firm was not explored in this analysis so future research can look at innovation is just small firms. A second relevant topic for future research, which cannot be answered by the present survey data, is to what extend innovation activities differs among sectors. In the survey used in this analysis agricultural firm was overrepresented, but they were weighted to reflect the true distribution among different sectors. A future research project would be to look in to the different sectors and see if innovation activities differs among them and to see if the broadband availability have a different impact on different sectors.