Vibration exposure model
for
human operators
working with chainsaw
equipment.
PAPER WITHIN Product Development: Software Product Engineering AUTHOR: Meelad Al-Ghareeb
TUTOR:Rob Day
Postadress: Besöksadress: Telefon:
equipment”. The work is a part of the two-year university diploma
program, of the Master of Science program, Software Products
Engineering
The author takes full responsibility for opinions, conclusions and findings
presented.
Examiner: Anders Adlemo
Supervisor
:
Rob Day
Scope: 30 credits (second cycle)
Date: May 2018
I would like to thank my supervisor, Andriy Shyshka, at Husqvarna for the provided guidance and help during this work. I would also thank Henrik Karlsson for help provided, specially by providing me with several experiment data that helped me a lot in the analysis process of the thesis. And finally, my huge gratitude to my thesis supervisor, Rob Day, at Jönköping University for his patience and support during these couple of months.
Abstract
Being exposed to vibration using hand-held tools might lead to a very serious condition, known as vibration syndrome. The purpose of this study is to introduce a new vibration exposure estimation model that can be used to evaluate the likelihood of operators developing vibration syndrome. The new model will be an improved version of the time-based model that is suggested by the ISO standard 5349 “Mechanical vibration – Measurement and evaluation of human exposure to hand-transmitted vibration”. According to ISO 5349, it is difficult to propose a comprehensive method to evaluate hand-arm vibration exposure, and it also suggests that it is possible to improve the current vibration exposure model. This is one of the reasons behind conducting this research.
To introduce the new vibration estimation model, a Design Research methodology with the help of experiments were conducted. The data that was used in this research was provided by Husqvarna Fleet Services, which consists of results from experiments for measuring vibration acceleration, and a dataset that contains information about chainsaw usage sessions. To analyze the data, various data analysis and datamining techniques were used with the help of a python tool called Jupyter. To achieve the purpose of this study, which is to introduce a new vibration exposure model, the following research questions were answered:
• RQ1: How does data gathered from practical experience differ from ISO 22867 vibration test code assumptions?
• RQ2: How can the ISO 5349 vibration exposure estimation model (VEM_0) be modified to be more accurate?
• RQ3: To what extent can the ISO 5349 vibration exposure estimation model be made more accurate by taking into consideration additional rpm ranges apart from idle, engaged and racing rpm values?
The findings obtained imply that the ISO model can be improved by considering additional parameters about chainsaw machine usage, which in this case, rpm ranges apart from idle, engaged and racing. A new vibration exposure model was developed and presented in the results section of this report. This research can be further improved by conducting more experiments for vibration acceleration calculation at different rpm ranges apart from idle, engaged and racing.
Contents
1
Introduction ... 7
1.1 BACKGROUND ... 7
1.2 PURPOSE AND RESEARCH QUESTIONS ... 8
1.3 DELIMITATIONS ... 8
1.4 OUTLINE ... 9
2
Theoretical background ... 11
2.1 PHYSICS OF VIBRATION AND HOW VIBRATION TRANSMITTED TO THE HAND IS CAPTURED ...11
2.2 EFFECTS OF HAND-ARM VIBRATION ON HUMAN BODY ...13
2.2.1 Vascular disorder – vibration induced white finger ... 13
2.2.2 Neurological disorders ... 14
2.2.3 Musculoskeletal disorders ... 15
2.3 STANDARDS AND GUIDELINES FOR HAV ...16
ISO 5349-1 ... 16
Directive 2002/44/EC (European Parliament, 2002) ... 17
ISO22867-2011 ... 18
2.4 VIBRATION ACCELERATION CALCULATION AT HUSQVARNA ...18
Testing and calculation of vibration acceleration ... 18
How the experiment is conducted ... 20
Daily vibration exposure calculation at Husqvarna ... 22
2.5 DATA MINING ...23
Data mining tasks ... 24
2.6 RELATED RESEARCH – CONNECTING DATA MINING AND HAV ...25
Whole-body vibration exposure ... 25
Hand grip strength prediction of hand held grass cutter workers. ... 26
3
Method and implementation ... 27
3.1 DESIGN RESEARCH ...27
How design research is related to this study ... 28
3.2 EXPERIMENTS ...28
Dataset ... 28
Experiment 3 ... 29
4
Findings and analysis ... 30
4.1 DATA ANALYSIS ...30
General data pre-processing ... 30
CSM1, CSM2 and CSM3 rpm values ... 31
4.2 RQ1:HOW DOES DATA GATHERED FROM PRACTICAL EXPERIENCE DIFFER FROM ISO VIBRATION TEST CODE ASSUMPTIONS? ...31
CSM1 ... 31
CSM2 ... 34
CSM3 ... 36
Analysis of findings from CSM1, CSM2 and CSM3 ... 38
4.3 RQ2:HOW CAN THE ISO5349 VIBRATION EXPOSURE ESTIMATION MODEL (VEM_0) BE MODIFIED TO BE MORE ACCURATE? ...40
Vibration acceleration predictive model for CSM1 ... 40
Vibration acceleration predictive model for CSMS2... 41
Vibration acceleration predictive model for CSM3 ... 42
Analysis of CSM1, CMS2 and CSM3 ... 43
Vibration exposure model implementation according to ISO 5349... 43
VEM_1 implementation ... 44
4.4 RQ3: TO WHAT EXTENT CAN THE ISO 5349 VIBRATION EXPOSURE ESTIMATION MODEL BE MADE MORE ACCURATE BY TAKING INTO CONSIDERATION ADDITIONAL RPM RANGES APART FROM IDLE, ENGAGED AND RACING RPM VALUES? ...45
Summary of comparison – VEM_0 vs VEM_1 ... 49
5
Discussion and conclusions ... 50
5.1 DISCUSSION OF METHOD ...50
5.2 DISCUSSION OF FINDINGS ...50
RQ1: How does data gathered from practical experience differ from ISO 22867 vibration test code assumptions? ... 50
RQ2: How can the ISO 5349 vibration exposure estimation model (VEM_0) be modified to be more accurate? ... 51
RQ3: To what extent can the ISO 5349 vibration exposure estimation model be made more accurate by taking into consideration additional rpm ranges apart from idle, engaged and racing rpm values? ... 51
5.3 CONCLUSIONS ...51
6
References ... 53
List of Figures
Figure 1 Fleet services (Services, 2018). ... 7
Figure 2 Number of sessions for each chainsaw model in the dataset provided by Husqvarna. CSM stands for chainsaw model. ... 9
Figure 3 Object moves from point B to C around the equilibrium position A. This figure is a description of vibration motion (Burström, Neely, Lundström, & Nilsson, 2009). ... 11
Figure 4 Vibration direction that needs to be captured from a handgrip position and flat palm postion (Burström, Neely, Lundström, & Nilsson, 2009) ... 12
Figure 5 Sine vibration and corresponding representation of frequency (Burström, Neely, Lundström, & Nilsson, 2009). ... 12
Figure 6 VWF (HSE, Hand Arm Vibration Syndrome Hazard at workplace, 2015) .... 13
Figure 7 Numerical system for VWF (Griffin M. J., 1990) ... 14
Figure 8 Reported information by Husqvarna. ... 20
Figure 9 Final result achieved from an experiment conducted by Husqvarna to measure the vibration acceleration for a specific chainsaw model. ... 22
Figure 10 Fleet Services notification. ... 23
Figure 11 KDD steps (TAN, STEINBACH, & KUMAR, 2006)... 24
Figure 12 Data mining tasks (TAN, STEINBACH, & KUMAR, 2006) ... 24
Figure 13 Code that calculates the number of operators that use one chainsaw model and more than one chainsaw model. ... 31
Figure 14 CSM1_User1 chainsaw usage profile. ... 32
Figure 15 CSM1_User2 chainsaw usage profile. ... 33
Figure 16 CSM1_User3 chainsaw usage profile. ... 33
Figure 17 Dataset after transposing for CSM2. ... 34
Figure 18 Chainsaw usage profile CSM2_User1. ... 35
Figure 19 Chainsaw usage profile CSM2_User2. ... 35
Figure 20 Chainsaw usage profile CSM2_User3 ... 36
Figure 21 Chainsaw usage profile CSM3_User1. ... 37
Figure 22 Chainsaw usage profile CSM3_User2. ... 37
Figure 23 Chainsaw usage profile CSM3_User3. ... 38
Figure 24 Summary of all three chainsaw models. ... 39
Figure 25 Simple linear regression for CSM1. ... 40
Figure 26 Simple linear regression for CSM2. ... 41
Figure 27 Simple linear regression model for CMS3. ... 42
Figure 28 Implementation of ISO-5349 vibration exposure estimation model. ... 44
Figure 29 Overall daily vibration exposure according to ISO 5349. ... 44
Figure 30 Implementation of VEM_1 ... 44
Figure 31 Overall daily vibration exposure for VEM_1. ... 45
Figure 32 VEM_0 vs VEM_1 overall daily exposure for CSM1. Where the diagram to the left is for CSM1_User1, the diagram to the right is for CSM1_User2 and the diagram in the middle is for CSM1_User3. ... 46
Figure 33 VEM_0 vs VEM_1 overall daily exposure for CSM2. Where the diagram to the left is for CSM2_User1, the diagram to the right is for CSM2_User2 and the diagram in the middle is for CSM2_User3. ... 47
Figure 34 VEM_0 vs VEM_1 overall daily exposure for CSM3. Where the diagram to the left is for CSM3_User1, the diagram to the right is for CSM3_User2 and the diagram in the middle is for CSM3_User3. ... 48
List of Tables
Table 1 Stages of VWF (Stockholm Workshop, 1987) ... 14
Table 2 Stages for neurological component according to (Stockholm Workshop, 1987) ... 15
Table 3 Filtered one-octave values. Fetched from an experiment conducted by Husqvarna. ... 20
Table 4 Vector summation from an experiment conducted by Husqvarna ... 21
Table 5 Explanation of different parameters in the dataset provided by Husqvarna . 28 Table 6 Experiment one ... 29
Table 7 Experiment two ... 29
Table 8 Experiment 3 ... 29
Table 9 Sessions dataset description after choosing three chainsaw models. ... 30
Table 10 chainsaw model and corresponding rpm values for idle, engaged and racing ... 31
Table 11 Operators' tag id, their abbreviation and the number of sessions for each.... 31
Table 12 rpm range against the percentage of time spent in each. ... 32
Table 13 Top three operators for CSM2 ... 34
Table 14 Top three operators for CSM3 ... 36
Table 15 Maximum percentage of session time spent in corresponding rpm range for each chainsaw model user ... 38
Table 16 Error values for linear regression of degree 1 to 5 for CMS1 ... 41
Table 17 Error values for linear regression of degree 1 to 5 for CMS2 ... 42
Table 18 Error values for linear regression of degree 1 to 5 for CMS3 ... 43
Table 19 Summary of the predictive models for CSM1, CSM2 and CSM3 ... 43
Table 20 number of values exceeding action and limit values ... 49
List of Equations
Equation 1 root-mean-square value for acceleration (ISO5349-1, 2001). ... 12Equation 2 daily vibration exposure (ISO 5349) ... 17
Equation 3 overall daily vibration exposure (ISO5349-1, 2001). ... 17
Equation 4 Time distribution for vibration emission calculation for different chainsaw modes. ... 18
Equation 5 vector summation according to ISO 5349 ... 21
Equation 6 VEM_1 ... 44
Abbreviations
CSM Chainsaw model
EMG Electromyographic
HAV Hand-arm vibration
HAVS Hand-arm vibration syndrome
HSE Health and Safety Executive
Hz Hertz, cycles/second
LR Linear regression
MRS Motor rotation speed
rpm Revolutions per minute
VEM Vibration exposure model
VEM_0 Vibration exposure model in ISO 5349
VEM_1 Suggested vibration exposure model that takes different rpm ranges into account
VWF Vibration induced white finger
1
Introduction
This research was conducted during the last semester of a 2-year education on advanced level in product development: software product engineering program. The purpose behind this research is to improve an existing model to measure vibration levels in hand-held chainsaws. To tackle this problem, a new vibration exposure model (VEM) was designed.
This chapter will cover the subject of the research, the purpose behind it, the research questions, the research objectives and finally, the delimitations of this research.
1.1 Background
Being exposed to vibration during working hours can lead to a very serious condition, known as vibration syndrome. There are two types of vibration exposure: Transition transmitted to the whole body and vibration transmitted to the arm or the hand. The first type of exposure can be transmitted by the seat or the floor on which the workers are sitting or standing on (HSE, 2005). An example of that can be: mobile machines that are driven over uneven surfaces. On the other hand, hand-arm vibration (HAV), can be transmitted using hand-held power tools (HSE, Hand-arm vibration: A guide for employees, 2014). An example of that can be: chainsaws, grass cutters etc. In the framework of this study, the interest will be focused on HAV exposure while using chainsaws that are manufactured by Husqvarna Group.
Husqvarna Group is a global company that produces outdoor power products and innovative solutions for garden care, forest, and park. These products include: different types of lawn mowers, chainsaws and trimmers (Husqvarna, About, 2018). One of the services that Husqvarna provides for its end users is Fleet Services.
Husqvarna Fleet Services (Figure 1) is a cloud-based solution that consists of a web and mobile application. The start page is a dashboard that gives an overview of the machines that are owned by companies. Fleet services shows how the machines are being used; provides guidance to make right decisions to create the conditions for high utilization rate; guidance on how to maximize the uptime; it also provides guides to safety and efficiency.
Fleet services uses several techniques to gather data from the machines, one of them is battery powered machines sensors. These sensors gather important parameters for example: engine revolutions, temperature, operator tags, vibration levels etc. (Services, 2018). The data gathered is then stored on a memory attached to the machine and then automatically uploaded to the cloud for further analysis. In accordance with industry standards (ISO5349-1, 2001), Husqvarna uses a time-based model to calculate vibration exposure values from hand-held tools. According to (ISO5349-1, 2001), it is difficult to propose a comprehensive method to evaluate hand-arm vibration exposure. It also suggests that it is possible to improve the current vibration exposure model.
A chainsaw consists of three modes (idle, engaged, racing), these chainsaw modes are basically specific rpm values that differ from one chainsaw model to another. A chainsaw of model XYZ has for example the following rpm values for different modes:
• Idle = 2800 rpm • Engaged = 10200 rpm • Racing = 13600 rpm
In this thesis, a new VEM will be introduced that takes the motor rotation speed, which is measured in rpm, as a parameter (VEM_1). Instead of only looking at the modes of the chainsaw (three rpm values), additional rpm ranges will be looked at, which are collected from Fleet Services. Data analysis and data mining techniques will then be used to analyze and design the suggested model. Experiments will later be conducted to compare the new model against the model that is presented in ISO 5349.
1.2 Purpose and research questions
The research at hand assumes that vibration exposure measurements can be further improved, by considering additional parameters about chainsaw machine usage (i.e. motor rotation speed that is measured in rpms).
Accordingly, the purpose of this study, is to introduce a new vibration exposure model (VEM) to achieve better vibration exposure measurements. To introduce the new VEM, the following research questions need to be answered:
RQ1: How does data gathered from practical experience differ from ISO 22867 vibration test code assumptions?
RQ2: How can the ISO 5349 vibration exposure estimation model (VEM_0) be modified to be more accurate?
RQ3: To what extent can the ISO 5349 vibration exposure estimation model be made more accurate by taking into consideration additional rpm ranges apart from idle, engaged and racing rpm values?
1.3 Delimitations
There are two types of vibration exposure: whole body and hand-arm vibration. This Study will take into consideration only HAV that is generated from using chainsaws.
Another delimitation for this study is looking at different rpm ranges. This will be the factor that will be considered to introduce a new VEM. There might be other factors that could be looked at, which are not considered in this research
There are other hand-held tools that generate vibration apart from chainsaws, for example, power cutter, trimmers etc. Due to time constraints, only chainsaws will be looked at in this research.
Finally, only three chainsaw models from Husqvarna will be looked at. This decision was made after analyzing the dataset provided by Husqvarna. These three chainsaw models will be referred to in the report as CSM1, CSM2, and CSM3 respectively. The reason behind choosing these three chainsaw models is that they are used by operators more than the other chainsaw models (Figure 2). It is possible that a chainsaw operator uses different types of chainsaws during a working day, which is also one of the reasons behind choosing more than one chainsaw model.
1.4 Outline
Chapter 2 will give an overview of the theoretical background. The following topics will be introduced and discussed: physics of vibration, data mining, effects of hand-arm vibration syndrome, vibration acceleration calculation at Husqvarna, data mining, related research, and guidelines and standards regarding hand-arm vibration.
Chapter 3 will give an overview of the research methods used and the different data gathering techniques. It will also explain the dataset used for data analysis.
Figure 2 Number of sessions for each chainsaw model in the dataset provided by Husqvarna. CSM stands for chainsaw model.
x-axis = chainsaw model. y-axis = number of usage sessions for a specific chainsaw model.
Chapter 4 is where the findings and the analysis of the findings is done. The chapter presents the findings of the research in the form of figures and tables, the findings are then analyzed.
Chapter 5 discusses the method in terms of strength and weaknesses. The findings are also discussed here. A conclusion of the results is then presented together with a suggestion for future work.
2 Theoretical background
This section covers the theoretical framework of the thesis. The main themes that were established are: physics of vibration, effects of hand-arm vibration on human body, standards and guidelines for HAV, vibration acceleration calculation at Husqvarna, data mining techniques and related research.
2.1 Physics of vibration and how vibration transmitted to the hand is
captured
For this research, it is important to understand the concept of vibration. This section includes a short introduction to what vibration is, the physics behind it and how vibration is captured when transmitted to the arm. This will help in understanding what factors are needed to calculate vibration exposure coming from hand-held tools. Vibration is when an object swings back and forth over the same path, so it is simply a motion called vibrational motion (Figure 3).
There are physical measurements which are needed to describe this vibrational motion. These measurements are: amplitude, displacement, duration, frequency and direction.
Amplitude is the peak displacement of the object from the equilibrium point A (Figure 3) and it is measured in meters. Displacement is the distance between the object and the equilibrium point at any period. Duration is the time required for the object to complete one cycle of motion from point B to C and back to B (Figure 3). Frequency is the number of complete cycles per second and it usually represented by Hertz (Hz). Finally, the direction of vibration that can take place in three translational directions and three rotational directions. The translational axes are designated x-axis, y-axis and z-axis (Figure 4). While the rotation about these axes are designated rx, ry, and rz, respectively (Griffin M. J., 2011).
Figure 3 Object moves from point B to C around the equilibrium position A. This figure is a description of vibration motion (Burström, Neely, Lundström, & Nilsson, 2009).
Vibration can also be represented as how amplitude changes over time (Burström, Neely, Lundström, & Nilsson, 2009). Figure 5 shows the frequency representation (right) of sine vibration (left).
Vibration measurements are required to estimate vibration exposure (Pelmear & Wasserman, 1998). To obtain correct vibration measurements it is good to identify the source of vibration. When using a chainsaw, the vibration can be caused by two things: engine vibration and cutting vibration that is caused by the chain of the chainsaw (MSSI, 2011). According to (ISO5349-1, 2001) the magnitude of the vibration is the main quantity used to describe vibration. The magnitude is described by acceleration which is expressed in meters per second squared (m/s2), while the magnitude of the vibration should be expressed as a root-mean-square acceleration value (ISO5349-1, 2001).
The root-mean-square value for acceleration is describe as the following (Equation 1):
𝑎𝑎
𝑟𝑟𝑟𝑟𝑟𝑟= �1 𝑇𝑇
� ∫ (𝑎𝑎(𝑡𝑡))
0𝑡𝑡 2𝑑𝑑𝑡𝑡
(1)
Equation 1 root-mean-square value for acceleration (ISO5349-1, 2001).
Where arms is root-mean-square value for acceleration, T is the total time for which arms should be calculated and a(t) is the acceleration measured at a time.
Figure 5 Sine vibration and corresponding representation of frequency (Burström, Neely, Lundström, & Nilsson, 2009).
Figure 4 Vibration direction that needs to be captured from a handgrip position and flat palm postion (Burström, Neely, Lundström, & Nilsson, 2009)
2.2 Effects of hand-arm vibration on human body
Working with hand-held vibrating tools leads to possible health hazards. Using such tools will expose the workers to the risk of variety of disorders. Exposure to hand-arm vibration might lead to hand injuries in the form of vascular disorders, effects on musculoskeletal system and nerve malfunctioning (Heaver, 2011). These health effects are collectively known as hand-arm vibration syndrome (HAVS).
2.2.1
Vascular disorder – vibration induced white finger
The vascular disorder associated with exposure to HAV is traditionally called vibration-induced white finger (VWF). VWF is when workers experience episodic attacks of blanching in the fingers. The syndrome itself is caused by being exposed to vibration, but the blanching appears after being exposed to cold temperature. The frequency and severity of these attacks increase with continued HAV exposure. The medical explanation of VWF is that the contraction changes in muscles and vessels, may limit or completely block the blood from reaching and supplying the affected parts (fingers), thus resulting in severe pain and bluish skin color. If the venous capillaries are also constricted, the blood will be completely blocked and will never reach the skin which will make it turn white in color (Figure 6).
According to (NIOSH, 1997), episodes of VWF are usually triggered by exposure to cold temperature. These episodic attacks are often triggered when people hold cold objects, exposed to melting snow or ice. Other factors that might precipitate these attacks can be stressful situations, nicotine intake and vibration exposure in daily life e.g. vibration from electric shaver.
There are several ways to classify VWF. (Stockholm Workshop, 1987) proposed a grading scale for VWF classification. this grading scale states that there are 5 different stages for VWF. Table 1 illustrates these stages, their symptoms and severity. Another system was introduced by (Griffin M. J., 1990). He introduced a numerical system for VWF that is based on scores for the blanching of different phalanges (Figure 7). This system assigns a weighted numerical value to each finger that is affected by VWF. The overall score is calculated for finger blanching in each hand. According to (HSE, Health surveillance - Guidance for Occupational Health Professionals, 2015), this system is a useful method in practice for monitoring progression or regression of symptoms in
Figure 6 VWF (HSE, Hand Arm Vibration Syndrome Hazard at workplace, 2015)
individual fingers. One disadvantage of this system is that it does not take how frequent VWF attacks may occur, which may be more relevant in assessing functional disability. Table 1 Stages of VWF (Stockholm Workshop, 1987)
Stage Severity Symptoms
0 - No attacks or symptoms.
1 Mild Occasional attacks affecting only the tips of one or more fingers.
2 Moderate Occasional attacks affecting distal and middle (rarely also proximal) phalanges of one or more fingers. 3 Severe Frequent attacks affecting all phalanges of most
fingers.
4 Very severe As in stage 3, with trophic skin changes in the finger tips.
Prevention by vibration exposure reduction is the primary source of treatment for VWF. In severe cases of VWF, medical treatment should be considered in combination with vibration exposure reduction. According to the standards the companies are required to provide their workers for possible referral to workers’ compensation or litigation (Burström, Neely, Lundström, & Nilsson, 2009).
2.2.2
Neurological disorders
Extensive and long-lasting exposure to vibration, according to (Burström, Neely, Lundström, & Nilsson, 2009), is associated with neurological disorders in the peripheral nervous system, which can be seen in two forms: nerve entrapment at various locations or as a peripheral nerve affection viewed as a diffusely distributed neuropath. Early symptoms of neurological injuries are usually tingling and/or numbness in fingers and hands, which after a while turns into decreased responsiveness and partial dexterity (dynamics, 2015).
Who is at risk?
According to research, it is not clear if neurological effects are caused by vibration, because this effect might easily be identified as a work injury rather than caused by HAV. Neurological disorders may appear after a short period of being exposed to vibration or it might appear suddenly because the symptoms may develop over several years. But according to (dynamics, 2015) neurological disorders develop quicker when working with vibrating machines and it may affect even young workers.
There are also some other factors that may cause diseases to the nerves for example abuse of alcohol, exposure to neurotoxin agents (e.g. arsenic) or uncomfortable work patterns (Heaver, 2011).
How dangerous are neurological disorders?
Since the human hand is a large sense organ, disturbance in this organ may result in serious disability or difficulty in performing hand-related everyday jobs. HAV is considered one of the reasons for causing neurological disorders, exposure to HAV may present considerable impairment of hand function. Neurological disorders may also cause numbness, pain, weakness or cold intolerance which may results in difficulty coping with coldness and dampness due to pain (WHO, 2009).
Staging of the symptoms
Table 2 shows the stages of the neurological component of HAVS. This staging is according to the Stockholm workshop scale (Stockholm Workshop, 1987) and the grading of the neurosensory conditions is made for each hand separately.
Table 2 Stages for neurological component according to (Stockholm Workshop, 1987) Stage Description
0SN Vibration-exposed but no symptoms.
1SN Intermittent numbness with or without tingling.
2SN Intermittent or persistent numbness, reduced sensory perception. 3SN Intermittent or persistent numbness, reduced tactile discrimination
and/or manipulative dexterity. Where SN is Sensorineural
Management and treatment of neurological effects
Providing a comprehensive and clear understanding of the disease in the form of documents, handbooks etc. is the best way to reduce the total risk. When it comes to treatment of vibration induced neurosensory disorders, the primary way of treatment is vibration exposure reduction which should be supplemented with information about how stress, alcohol use, tobacco use, nutrition and work techniques could affect the severity of the disorder.
In severe cases, medical treatment, in the form of surgical treatment or pain relief medication, must be taken into consideration. In such cases, medical treatment should be combined with vibration exposure reduction.
2.2.3
Musculoskeletal disorders
When it comes to musculoskeletal injuries, they may take the form of arthritis, tendonitis and changes in muscle fibers. Major symptoms of such injuries can appear in the form of reduced muscular function and force, possible muscular pain & reduced manual dexterity. Primary prevention of such injuries includes a total ergonomic evaluation with reduced work and vibration exposure (dynamics, 2015).
Musculoskeletal disorders effects: temporary vs permanent
Workers that are exposed to vibration have an excessive risk of musculoskeletal disorders compared to non-vibration exposed workers. The effects on the musculoskeletal system can either be temporary or permanent.
When the hand-arm system is exposed to vibration, the electromyographic (EMG) activity in the muscles will temporary increase. This causes temporary acute disturbances to the hand-arm system and it affects most workers that are exposed to vibration. This effect, in most cases, does not stay for more than one hour after interrupted vibration exposure.
According to (Burström, Neely, Lundström, & Nilsson, 2009) the musculoskeletal disorders might be permanent. Example of such disorders can be muscle-limb pain, muscle-tendon syndromes, reduced muscular capacity, osteoarthritis or stiffness. Loss of neuro-muscular control might also happen due to a combined effect of neurosensory and muscular impairment.
Who is at risk?
Just like in the vascular and neurological systems, being exposed to vibration for a long period of time is the main reason for musculoskeletal disorders. But unlike these two, ergonomic risk factors must also be considered when evaluating musculoskeletal disorders (CCOHS, 2014).
Treatment
Primary treatment methods include an ergonomic evaluation with reduction of vibration exposure. In advanced cases, surgical intervention or medical treatment is required.
2.3 Standards and guidelines for HAV
There are several standards and guidelines that can be followed to measure and evaluate hand-arm vibration exposure. The ISO standard (ISO5349-1, 2001) provides guidelines and evaluation criteria for hand-arm transmitted vibration. (EU-OSHA, 2002) aims at ensuring health and safety of each worker by providing minimum health and safety requirements regarding exposure to hand-arm vibration. While (ISO22867, 2011) provides a vibration test code that can be followed by manufacturers to efficiently determine the magnitude of vibration. Below is a description of the standards and guidelines mentioned above.
ISO 5349-1
2.3.1.1 Direction of measurements
The direction of vibration that is transmitted to the hand should be measured in the appropriate directions of an orthogonal coordinate system in a handgrip position. These directions are described in Figure 4.
2.3.1.2 Magnitude of vibration
According to (ISO5349-1, 2001), the primary quantity to describe the magnitude of vibration shall be acceleration, which is expressed in m/s2.
The acceleration level can also be measured using weighting network and it is called frequency-weighted acceleration level.
2.3.1.3 Measurement of HAV
The equipment’s used in HAV measurement usually consist of a transducer, an amplifying device and amplitude indicator or recorder. The equipment should be correctly calibrated. The basis of operation and characteristics of any equipment used should be reported, together with the results obtained. If the tools used are held in both hands, measurements must be made at both hand positions, the highest value obtained is then used for determining vibration exposure.
2.3.1.4 Daily exposure calculation
The daily exposure is calculated from acceleration and exposure time and it is expressed in m/s2 (Equation 2 daily vibration exposure). If the worker is exposed to vibration from more than one source of vibration, e.g. the worker uses more than one vibrating tool during the day, then the partial vibration exposure is calculated for each tool. The partial vibration values are then combined to give an overall daily vibration exposure value for that worker (Equation 3 overall daily vibration exposure
(ISO5349-1, 2001).).
𝐴𝐴(8) = 𝑎𝑎
ℎ𝑣𝑣�𝑇𝑇 𝑇𝑇
�
0(2)
Equation 2 daily vibration exposure (ISO 5349)
Where A(8) is the daily vibration exposure, ahv is the vibration magnitude in m/s2, T is the exposure time in hours and T0 is the reference duration of eight hours.
𝐴𝐴(8) = �𝐴𝐴
1(8)
2+ 𝐴𝐴
2(8)
2+ 𝐴𝐴
3(8)
2+ ⋯
(3)
Equation 3 overall daily vibration exposure (ISO5349-1, 2001).
Where A(8) is the overall daily vibration exposure, A1(8)2, A2(8)2, A3(8)2 etc. are the partial vibration exposure for one worker from different vibrating tools.
Directive 2002/44/EC (European Parliament, 2002)
This directive was legislated by the European Parliament on the 25th of June year 2002 with the objectives of improving the protection of workers against the risks of being exposed to mechanical vibration. It laid down minimum requirements with regards to the protection of health and safety.
The directive sets vibration limit values for both hand-arm vibration and whole-body vibration (WBV), if these values are exceeded, employees must take measures.
2.3.2.1 HAV daily exposure limits and action values
For hand-arm vibration, the daily exposure limit value shall be 5 m/s2, while the action value is 2.5 m/s2. Both values are standardized to an eight-hour reference period. 2.3.2.2 Determination and assessment of risk
According to the directive, the employer shall assess and, if necessary, measure the levels of vibration exposure. The assessment can be done by means of observation of specific working practices and by referencing to relevant information provided by the tool manufacturer. The measurement on the other hand, shall be done by using specific apparatus and appropriate methodology (European Parliament, 2002).
There are aspects that the employer shall give attention to when carrying out the risk assessment (European Parliament, 2002):
• The level, type and duration of exposure.
• The exposure limit values and the exposure action values.
• Any effects concerning the health and safety of workers at particularly sensitive risk
• Any indirect effects on worker safety resulting from interactions between mechanical vibration and the workplace or other work equipment.
• Information provided by the manufacturers of work equipment in accordance with the relevant Community Directives.
• The existence of replacement equipment designed to reduce the levels of exposure to mechanical vibration.
• The extension of exposure to whole-body vibration beyond normal working hours under the employer's responsibility.
• Specific working conditions such as low temperatures.
• Appropriate information obtained from health surveillance, including published information, as far as possible.
2.3.2.3 Provisions aimed at avoiding or reducing exposure
If the exposure action values are exceeded by the employees, the employer shall establish and implement measure to reduce the exposure of vibration to the minimum. This can be achieved by for example changing working method, changing working equipment, supply the employees with appropriate training and information, adjustment to work schedules with adequate rest periods, etc. (European Parliament, 2002).
ISO22867-2011
This international ISO standard provides vibration test code which gives general specifications to measure vibration emission of hand-held tools. The use of the test code specified in this standard will ensure reproducibility of the determination of vibration characteristics (ISO22867, 2011). These vibration characteristics are then primarily used for manufacturer’s declarations, comparing vibration data between vibrating tools, development decisions at the design stage, and the estimation of the vibration risk.
In this standard, when calculating vibration emission for a chainsaw, it is assumed that one third of the time is spent in each chainsaw mode, this is shown in the equation below:
(4)
Equation 4 Time distribution for vibration emission calculation for different chainsaw modes.
2.4 Vibration acceleration calculation at Husqvarna
To calculate the vibration magnitude for each chainsaw machine, Husqvarna follows the test code provided by (ISO22867, 2011). For the calculation of daily vibration exposure, Husqvarna follows (ISO5349-1, 2001). Below is an explanation of how the calculation is done.
Testing and calculation of vibration acceleration
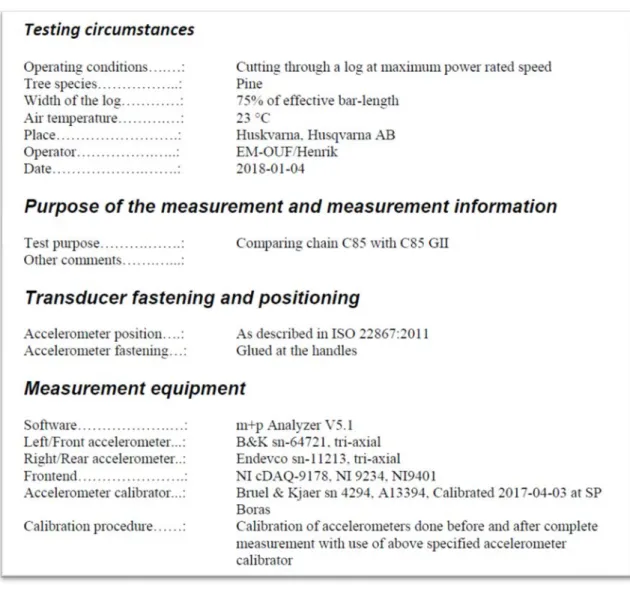
Husqvarna follows the ISO standard ISO22867-2011 to test and calculate vibration acceleration for their chainsaws. The information reported after conducting such
• Machine under test:
o Description of the machine, including engine displacement, manufacturer, type and serial number, type of cutting equipment.
o Operating conditions. • Work piece, where applicable. • Instrumentation:
o Equipment used for the measurements, including name, type, serial number and manufacturer.
o Methods used to fasten accelerometers.
o Method used to calibrate the instrumentation system.
o Date and place of most recent calibration of accelerometer calibrator. • Vibration and other data:
o Location of accelerometer positions (a sketch may be included, if necessary).
o Measurement values and arithmetic mean values for each handle and cutting attachment (where applicable).
o Remarks, if any. o Air temperature.
o Date and place of measurements.
Figure 8 shows some of the reported information by Husqvarna (to see the full result of the experiment see appendix 1).
Figure 8 Reported information by Husqvarna.
How the experiment is conducted
The acceleration is measured using accelerometers that are placed on both front and rear handle of the chainsaw. The acceleration is then reported in terms of acceleration analyzed in one-third octave bands for each direction (x, y, z), which is recommended by (ISO5349-1, 2001). After that, the values are then ISO-filtered for each channel. The table below shows an example of filtered one-third octave values (for full results see appendix 1).
Where Front_1_x, front_2_y and front_3_z = front handle x, y and z axles, and Rear_4_y, rear_5_x and rear_6_z = rear handle y, x and z axles.
Table 3 Filtered one-octave values. Fetched from an experiment conducted by Husqvarna.
The filtered values are then summed together in accordance to (ISO5349-1, 2001) vector summation formula (Equation 5) to get the final vibration value for each handle.
𝑎𝑎 = �𝑎𝑎
𝑥𝑥2+ 𝑎𝑎
𝑦𝑦2+ 𝑎𝑎
𝑧𝑧2(5)
Equation 5 vector summation according to ISO 5349
Table 4 Vector summation from an experiment conducted by Husqvarna
The experiment is then repeated at least three more times (four in total) in accordance to (ISO5349-1, 2001). The mean value is then calculated for all the values that are achieved from running the experiment for several times. The mean value is then used to calculate the final acceleration value for each handle. The first part of Figure 9 (one third octave values) shows the mean value of the third octave values achieved from running the experiment several times, the second part (each channel ISO filtered) shows the ISO-filtered values for the mean third octave values, and finally the third part (ISO-vector), shows the final vibration acceleration value for each handle.
After calculating the vibration acceleration for each chainsaw mode, the final vibration value is calculated using Equation 4 with the assumption that one third of the time is spent in each chainsaw mode.
Daily vibration exposure calculation at Husqvarna
Husqvarna uses (Equation 2 daily vibration exposure) that is specified in (ISO5349-1, 2001) standard. The input parameters for the equation are provided by Fleet Services in the form of a dataset that contains sessions for workers working with chainsaws. Below is a step by step explanation of how the daily vibration exposure is calculated at Husqvarna for one worker at the end of the day that has used several chainsaw machines:
• The acceleration value is fetched for a chainsaw machine. Each chainsaw model has a specific acceleration value for each handle (rear and front), the highest value is used here. How the acceleration calculation is done at Husqvarna is explained earlier in section 2.4.2.
• Session time is then used as exposure time.
Figure 9 Final result achieved from an experiment conducted by Husqvarna to measure the vibration acceleration for a specific chainsaw model.
The daily exposure is then calculated using (Equation 2). If the worker uses several chainsaw models during several sessions, the vibration exposure is then calculated for each session and then (Equation 3) is used to calculate the overall daily vibration exposure.
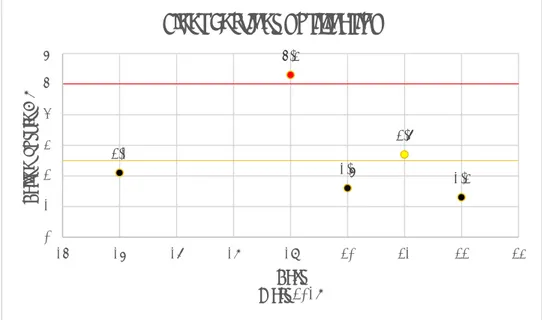
If the overall daily vibration exposure exceeds the limit or action values that are specified in (European Parliament, 2002), the employer will be notified through Fleet Services. The diagram below illustrates a simple scenario of when Fleet Services notifies their users when they exceed the proposed values of daily exposure to vibration:
From the diagram above, we see that Fleet Services notifies the user on the 21st and 19th of Mars because the daily exposure exceeded the action (yellow line) and limit (red line) values respectively.
2.5 Data mining
Data mining techniques will be used in this research to analyze and evaluate the datasets that are provided by Husqvarna. Data mining is the process of extracting useful information in large data repositories. This process is automated, and it is used to find useful patterns to predict the outcome of a future remark (TAN, STEINBACH, & KUMAR, 2006), such as predicting and identifying new product bundles or maybe to predict the playing patterns of poker players.
The overall process of converting raw data into useful information is called knowledge discovery in databases (KDD), data mining is an integral part of that. Figure 11 shows the different steps involved in KDD. It starts from data preprocessing and finishes with data postprocessing. The purpose behind data preprocessing is to transfer the input data (which is raw data that is stored in e.g. spreadsheet) into appropriate data that is ready for analysis. Preprocessing includes merging raw input data from different resources together, removing missing values and duplicates, and finally selecting records that are suitable for the data mining tasks. After applying data mining techniques to the input data, postprocessing is done. Post processing allows analysts to explore the data mining results from different viewpoints. Hypothesis testing, and
2,1 5,3 1,6 2,7 1,3 0 1 2 3 4 5 6 15 16 17 18 19 20 21 22 23 Da ily ex po sur e A(8) Days Mars 2018
Fleet Services notification
Data mining tasks
Data mining tasks consists of two types: predictive tasks and descriptive tasks (Figure 12 Data mining tasks (TAN, STEINBACH, & KUMAR, 2006). Predictive tasks help in predicting the value of an attribute (dependent variable) based on the value of other attributes (independent variables). Examples of such tasks can be predictive modeling and cluster analysis. On the other hand, descriptive tasks tend to find patterns that can summarize the underlying relationships in data. The data gathered from descriptive tasks are often exploratory and require postprocessing techniques to explain the results (TAN, STEINBACH, & KUMAR, 2006).
Predictive modeling
According to (Larose & Larose, 2015) predictive modeling can be divided into estimation, prediction and classification. In estimation, we use a set of numeric and/or categorical predictor variables (independent variables) to estimate the value of a numeric target variable (dependent variable). One way of doing this is using regression for example. Classification serves the same purpose as estimation; the only difference Figure 11 KDD steps (TAN, STEINBACH, & KUMAR, 2006).
is that in classification the dependent variable is categorical rather than numerical. An example of classification can be classifying a creature as reptile, mammal, fish, bird or amphibian. Finally, prediction, which is similar to classification and estimation, except that the results of prediction lie in the future. An example of that can be predicting market stocks 3 months in the future.
Cluster analysis
Cluster analysis is explained as: “seeks to find groups of closely related observations so that observations that belong to the same cluster are more like each other than observations that belong to other cluster. Clustering has been used to group sets of related customers, find areas of the ocean that have significant impact on the Earth’s climate, and compress data.” (TAN, STEINBACH, & KUMAR, 2006).
Examples of clustering tasks in research and business can include (Larose & Larose, 2015):
• Target marketing of product for a small business which does not have a large marketing budget.
• Segmenting financial behavior into benign and suspicious categories. • As a tool to reduce a data set that has hundreds of attributes.
Association analysis
Association analysis is used to learn patterns that describe related features in data sets. The discovered patterns are often described as an implication of rules or feature subsets. Association can be used in several cases include identifying web pages that are visited at the same time or maybe to find items that are frequently bought together by customers which can help in organizing a shop (putting related items close to each other) (TAN, STEINBACH, & KUMAR, 2006).
Anomaly detection
The purpose behind anomaly detection is to find observations that have characteristics that are different from the rest of the data. Such observations are known as anomalies or outliners (TAN, STEINBACH, & KUMAR, 2006). An example of anomaly detection can be the detection of fraud, network intrusions, unusual patterns of disease, and ecosystem disturbances (TAN, STEINBACH, & KUMAR, 2006).
2.6 Related research – connecting data mining and HAV
After conducting literature research, there were no research papers regarding developing new VEMs for chainsaws by using rpm ranges or the mode of the chainsaw as independent variables. On the other hand, there are several research papers that predict vibration exposure for HAV and whole-body vibration (WBV) by considering other variables e.g. age of vibration exposed workers. Below are the papers of relevant research with a short explanation of each.
Whole-body vibration exposure
(Clay, Milosavljevic, & Trask, 2015) conducted a study to measure vibration exposure for the whole body. The purpose behind this study was to develop statistical predictive models to predict WBV exposure using self-reported predictors. The target group in this study was farmers that operate on agricultural quad bikes and the data collection included 130 farmers. To create the predictive models, they considered the following variables: farmer age, estimated quad bike driving hours (to estimate exposure time) and the type of the quad bike rear suspension. The outcome of this research was four predictive models where model three and four had similar characteristics.
Hand grip strength prediction of hand held grass cutter workers.
(Ali, Azmir, Ghazali, Yahya, & Song, 2015) conducted a research to predict the hand grip strength. Since exposure to HAV causes disability to hand grip strength, the objective of this paper is to develop predictive models to evaluate the factors that affect hand grip strength. Non-linear neural network and linear multiple regression were used as data mining techniques. For this study 204 hand-held grass cutter workers of age between fifteen and fifty-six were selected. The input data was the following: age, weight, height, working experience and estimated hand vibration exposure, which was collected using a case study.
The dependent variable for this study was the hand grip strength for both hands, while the independent variables were age, weight, height, working experience and estimated hand vibration exposure. The results showed that both linear multiple regression and neural networks modeling techniques were successfully able to predict the hand grip strength of the workers. According to the paper, the non-linear neurological network algorithm performed much better than the linear multiple regression model.
3 Method and implementation
Design research is the research method that is used for this thesis work. The reason behind choosing this method is to fulfill the purpose of this research which is to design a new vibration exposure model.
According to (Oates, 2006) design research can be used when an artifact is developed, the artifact can represent a method, model, working system or a construct. The knowledge contribution is the artifact itself, or the lessons learned during the development process (Oates, 2006). So, in this case, the new VEM is the artifact. The VEM will be an improved version of the currently used model at Husqvarna that is based on the ISO standard ISO 5349. The new VEM will consider additional rpm ranges aside from the modes of the chainsaw (idle, engaged and racing).
After designing the new VEM, experiments will be conducted to test the model against the old model that is stated in the ISO 5349 standard, to see if there is any improvement in vibration exposure measurements. The dataset used in the experiment will be provided by Husqvarna fleet services, the dataset has several parameters (rpm, exposure time etc.), these parameters will be passed to the newly designed models as independent variables and the outcome will then be analyzed using datamining techniques.
3.1 Design research
According to (Oates, 2006),design research is a method that can be used when developing a new IT artifact. The artifact can represent a model, method, instantiation or a construct. Design research involves different stages to create a new artifact, these stages can be performed iteratively (Vaishnavi & Kuechler, 2004). Below is an explanation of the stages:
Awareness
The main output of this stage is a proposal, formal or informal, for a new research effort. The content of such proposal will arise from awareness of an interesting problem. The problem can come from multiple sources including industry or literature. Suggestion
At this stage, a solution to the problem is suggested by the researcher. A plan on how to tackle the problem is also suggested here.
Development
The implementation of the suggested solution is done during this stage. Several development methodologies can be used here based on the type of the artifact being created. The main purpose behind development is primarily in the design, not the construction of the artifact.
Evaluation
Once constructed, the artifact is evaluated according to certain criteria. During this stage, the researcher might find that the artifact or the development process needs further improvement.
Conclusion
This stage could be the end of the research cycle or just an end to a specific research effort. The research efforts need to be reported and the knowledge contribution needs to be stated clearly.
How design research is related to this study
The awareness stage for this research is the realization that there is difficulty to propose a comprehensive method for assessing vibration exposure. This realization is stated in the form of thesis purpose that is divided into three research questions.
When it comes to the suggestion stage, a suggestion was provided to solve the problem: the development of new VEM that considers rpm ranges.
For the development stage, data that is collected from various Husqvarna chainsaw models is used for analysis and to implement the new VEM.
Additionally, when it comes to the evaluation stage, the new VEM will be evaluated using several experiments and data mining techniques.
And finally, the knowledge contribution and future work will be stated. This is the conclusion stage.
3.2 Experiments
The complementary methodology for this paper is experiments. Several experiments will be conducted for comparison purposes and to answer the research questions stated in section 1.2. The experiments will be conducted in conjunction with data analysis.
Dataset
The dataset used to conduct the experiments is provided by Husqvarna Fleet Services. The dataset is in .CVS format and it consists of data about chainsaw usage in Fleet. The dataset contains approximately eighty-five thousand data of chainsaw usage sessions. Each row in the dataset contains the following attributes: chainsaw model, user tag id, date and time of session start, RPM histogram, percentage of session time spent in a given histogram bucket, session duration.
The dataset will be used for analysis and to answer the research questions. The table below explains how each parameter in the dataset will be used in the models’ development process.
Table 5 Explanation of different parameters in the dataset provided by Husqvarna
Parameter Explanation
Chainsaw model A worker can use different chainsaw models during the day. This helps to get the acceleration values for each chainsaw model which will help in the calculation of the overall vibration exposure.
User tag id The id of the worker that uses a chainsaw during a session. Session time The start time of a session. It is provided as date and time. This
will help to see how many sessions a worker has during a working day.
Session duration How long a session is.
RPM histogram Shows the different rpm ranges that the worker was exposed to during a session. Percentage of session time spent in a histogram bucket
Gives the percentage of time that a worker spends in a specific rpm range. So, if the worker spent 0.2% of the total session duration (e.g. 13 minutes) in 1200 rpm, this means that he spent 2.6 minutes in that rpm range.
Experiment 1
The purpose behind this experiment is to see if a chainsaw operator spends one third of a session time in each chainsaw mode (idle, engaged, racing). The table below explains the experiment:
Table 6 Experiment one Null hypothesis
H0_exp1 An operator spends one third of a session time in each chainsaw mode (idle, engaged, racing). Alternate
hypothesis H1_exp1
An operator does not spend one third of a session time in each chainsaw mode (idle, engaged, racing).
Dependent variable Percentage of time spent in a specific rpm range. Independent
variables Different rpm ranges. Where Exp1 is experiment 1.
Experiment 2
The purpose behind this experiment is to compare predictive models of different polynomial degrees. The table below explains the experiment:
Table 7 Experiment two Null hypothesis
H0_exp2 Polynomial linear regression is better than simple linear regression in predicting vibration acceleration for a chainsaw model.
Alternate hypothesis
H1_exp2
Simple linear regression is better than polynomial linear regression in predicting vibration acceleration for a chainsaw model.
Dependent variable Mean Absolute Error, Mean Squared Error, Root Mean squared Error.
Independent
variables Acceleration, rpm ranges. Where exp2 is experiment 2.
Experiment 3
The purpose of this experiment is to compare VEM_1 with VEM_0. The table below explains the experiment:
Table 8 Experiment 3 Null hypothesis
H0_exp3 VEM_1 is not better than VEM_0 by taking different rpm ranges into account. Alternate
hypothesis H1_exp3
VEM_1 is better than VEM_0 by taking different rpm ranges into account.
Dependent variable Result from experiment 1. Independent
variables rpm, exposure time.
Where exp3 is experiment 3, VEM_0 = Vibration exposure model as presented in ISO 5349 and VEM_1 is the new VEM that takes additional rpm ranges into account.
4 Findings and analysis
In this chapter, the datasets that are provided by Husqvarna will be analyzed. After the analysis, the research questions will be answered in the form of figures and tables. The findings are then stated by answering the hypothesis stated in the experiments mentioned above.
4.1 Data analysis
To answer the first research question, data analysis was done using Jupyter, which is a non-profit and open-source project that is used to support interactive data science and scientific computing across many programming languages (Jupyter, 2018). The python programming language in combination with Jupyter was used in this study.
General data pre-processing
As mentioned in the delimitation section of this report, session data from three chainsaw models were chosen for analyses. These three chainsaw models will be referred to as CSM1, CSM2, and CSM3 respectively. The number of sessions that are remaining for analysis is 64943 as described in Table 9.
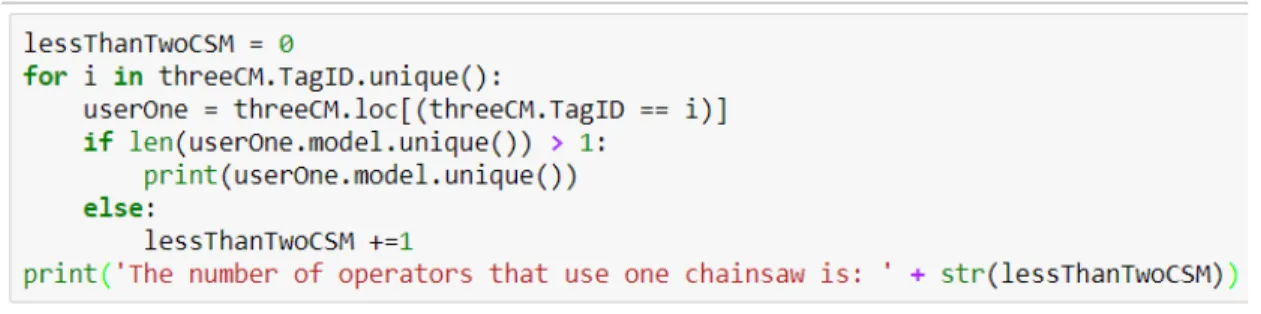
The number of unique operators in the dataset is 137, but none of them used more than one chainsaw. This was checked using the code in Figure 13. The code prints out 137 which is the number of operators that use only one chainsaw. This is equivalent to the number of unique operators in the dataset.
Where Count is the number of sessions in the dataset, Unique is the number of chainsaw models in the dataset and Freq is the number of sessions for the most frequent chainsaw model, which is in this case CSM1.
CSM1
Table 9 Sessions dataset description after choosing three chainsaw models.
One of the dataset parameters is session start time, this parameter was presented in an invalid format in the dataset, so one of the pre-processing tasks was to convert the parameter to a valid format.
CSM1, CSM2 and CSM3 rpm values
The table below describes the rpm values for idle, engaged and racing for the three chainsaw models CSM1, CSM2 and CSM3, this will later be used for comparison purposes:
Table 10 chainsaw model and corresponding rpm values for idle, engaged and racing
Idle Engaged Racing
CSM1 2800 rpm 10200 rpm 13600 rpm
CSM2 2700 rpm 9600 rpm 12800 rpm
CSM3 2900 rpm 9600 rpm 12800 rpm
4.2 RQ1: How does data gathered from practical experience differ from
ISO vibration test code assumptions?
CSM1
4.2.1.1 Data pre-processing
The number of operators that have used CSM1 is 33. Since it is time consuming to look at all the operators, the top three prevalent operators were chosen to provide a useful volume of data. The table below shows the tag id of the three operators, how they will be abbreviated in the text and the number of chainsaw usage sessions for each:
Table 11 Operators' tag id, their abbreviation and the number of sessions for each
Operator tag id Abbreviation No. of sessions
268438386 CSM1_User1 1132
268438828 CSM1_User2 568
268438201 CSM1_User3 297
Figure 13 Code that calculates the number of operators that use one chainsaw model and more than one chainsaw model.
The next step was to transpose the dataset to get two columns, one for rpm ranges and one for time spent in each rpm range. This will help to retrieve the chainsaw usage profile for each operator. The table below shows a sample representation of the dataset after transposing:
Table 12 rpm range against the percentage of time spent in each.
Where rpm is the rpm range and % is the percentage of time spent in a rpm range.
4.2.1.2 Chainsaw usage profile for CSM1_User1
Figure 14 shows chainsaw usage profile for CSM1_User1. The histogram shows how much time in percentage the operator spends in each rpm range.
4.2.1.3 Chainsaw usage profile for CSM1_User2
Figure 15 shows chainsaw usage profile for CSM1_User2:
4.2.1.4 Chainsaw usage profile for CSM1_User3 Figure 16 shows chainsaw usage profile for CSM2-User:
Figure 15 CSM1_User2 chainsaw usage profile.
CSM2
4.2.2.1 Data pre-processing
The number of operators that have used CSM1 is 68. The top three operators were chosen for further analysis. The table below shows the tag id of the three operators, how they will be abbreviated in the text and the number of chainsaw usage sessions for each:
Table 13 Top three operators for CSM2
Operator tag id Abbreviation No. of sessions
268438053 CSM2_User1 1309
268438388 CSM2_User2 1111
269485626 CSM2_User3 1051
The dataset was then transposed to get two columns, one for rpm ranges and one for time spent in each rpm range. This will be used to retrieve the chainsaw usage profile for each operator. The figure below shows the first five columns of the dataset after transposing:
Figure 17 Dataset after transposing for CSM2. 4.2.2.2 Chainsaw usage profile for CSM2_User1 Figure 18 shows chainsaw usage profile for CSM2_user1:
4.2.2.3 Chainsaw usage profile for CSM2_User2
Figure 19 shows chainsaw usage profile for CSM2_User2: Figure 18 Chainsaw usage profile CSM2_User1.
4.2.2.4 Chainsaw usage profile for CSM2_User3
Figure 20 shows chainsaw usage profile for CSM2_User3:
CSM3
4.2.3.1 Data pre-processing
The number of operators that have used CSM1 is 36. The top three operators were chosen for further analysis. The table below shows the tag id of the three operators, how they will be abbreviated in the text and the number of chainsaw usage sessions for each:
Table 14 Top three operators for CSM3
Operator tag id Abbreviation No. of sessions
268438182 CSM3_User1 1726
269486796 CSM3_User2 1132
269486727 CSM3_User3 1122
The dataset was then transposed to get two columns, one for rpm ranges and one for time spent in each rpm range. This will be used to retrieve the chainsaw usage profile for each operator. The figure below shows the first five columns of the dataset after transposing:
4.2.3.2 Chainsaw usage profile for CSM3_User1 Figure 21 shows chainsaw usage profile for CSM3_User1:
4.2.3.3 Chainsaw usage profile for CSM3_User2
Figure 22 shows chainsaw usage profile for CSM3_User2:
Figure 22 Chainsaw usage profile CSM3_User2. Figure 21 Chainsaw usage profile CSM3_User1.
4.2.3.4 Chainsaw usage profile for CSM3_User3
Figure 23 shows chainsaw usage profile for CSM3_User3:
Figure 23 Chainsaw usage profile CSM3_User3.
Analysis of findings from CSM1, CSM2 and CSM3
Figure 24 shows an overview of all the three chainsaw models. The first row is for CSM1, second row for CSM2 and third row for CSM3. Table 15 shows at what rpm range does a chainsaw operator spent most of his time at during cutting sessions. This indicates that an operator spends most of his time in idle (see Table 10).
Table 15 Maximum percentage of session time spent in corresponding rpm range for each chainsaw model user
Chainsaw model Operator
CSM1_User1 CSM1_User2 CSM1_User3
CSM1 2000*
37.0 %** 2200* 47.3 %** 2800* 48.2 %**
CSM2_User1 CSM2_User2 CSM2_User3
CSM2 2800*
35.7 %** 2800* 46.9 %** 2800* 46.1 %**
CSM3_User1 CSM3_User2 CSM3_User3
CSM3 2800*
47.1 %** 2800* 42.5 %** 2800* 45.9 %** *rpm value.
This leads to the rejection of H0_exp1 (Table 6 Experiment one) which states that “An operator spends one third of a session time in each chainsaw mode (idle, engaged, racing)”, and the acceptance of the alternate hypothesis H1_exp1 which states that “An operator does not spend one third of a session time in each chainsaw mode (idle, engaged, racing)”.
4.3 RQ2: How can the ISO 5349 vibration exposure estimation model
(VEM_0) be modified to be more accurate?
Vibration acceleration predictive model for CSM1
The experiment data that was provided by Husqvarna contains vibration acceleration values for only three rpm values (idle, engaged and racing), the first step of analysis was to develop a predictive model to predict the vibration acceleration for other rpm values. The first predictive model is a simple linear regression. The figure below is an illustration of the model:
Figure 25 Simple linear regression for CSM1.
Polynomial linear regression of different degrees (2-5) was also computed. The table below shows linear regression models of different degrees for CSM1, mean absolute error (MAE), mean squared error (MSE) and root mean squared error (RMSE) for each:
Table 16 Error values for linear regression of degree 1 to 5 for CMS1
MAE MSE RMSE
CSM1 LR degree 1 0.4197 0.2502 0.5002 CSM1 LR degree 2 0.15000 0.03611 0.19003 CSM1 LR degree 3 0.15000 0.03611 0.19003 CSM1 LR degree 4 0.15000 0.03611 0.19003 CSM1 LR degree 5 0.15000 0.03611 0.19003 LR = Linear regression
Vibration acceleration predictive model for CSMS2
Figure 26 shows the vibration acceleration against rpm ranges. The graph also shows a simple linear regression model:
Table 17 compares linear regression models of different degrees. This is helpful to understand which model performs better.
Table 17 Error values for linear regression of degree 1 to 5 for CMS2
MAE MSE RMSE
CSM2 LR degree 1 0.51709 0. 38084 0. 61712
CSM2 LR degree 2 0.20000 0.05500 0. 23452
CSM2 LR degree 3 0.20000 0.05500 0. 23452
CSM2 LR degree 4 0.20000 0.05500 0. 23452
CSM2 LR degree 5 0.20000 0.05500 0. 23452
Vibration acceleration predictive model for CSM3
Figure 27 shows the vibration acceleration against rpm ranges. The graph also shows a simple linear regression model:
Table 18 compares linear regression models of different degrees. This is helpful to understand which model performs better.
Table 18 Error values for linear regression of degree 1 to 5 for CMS3
MAE MSE RMSE
CSM3 LR degree 1 0. 31138 0.10405 0.32256 CSM3 LR degree 2 0.15833 0.03472 0.18634 CSM3 LR degree 3 0.15833 0.03472 0.18634 CSM3 LR degree 4 0.15833 0.03472 0.18634 CSM3 LR degree 5 0.15833 0.03472 0.18634
Analysis of CSM1, CMS2 and CSM3
By looking at Table 16, Table 17 and Table 18 compares linear regression models of different degrees. This is helpful to understand which model performs better.
Table 18, we can see that polynomial linear regression is better than simple linear regression, because polynomial regression has lower error values.
By looking at Table 7 Experiment two, H0_exp2 states that “polynomial linear regression is better than simple linear regression in predicting vibration acceleration for a chainsaw model” which is true according to the findings. This leads to the rejection of the alternate hypothesis H1_exp2 that states that “Simple linear regression is better than polynomial linear regression in predicting vibration acceleration for a chainsaw model”.
It is also noted that the error values do not change even when increase the polynomial degree thus polynomial linear regression of degree two is chosen for further analyses. The table below shows a summary of polynomial linear regression for CSM1, CSM2, and CMS3:
Table 19 Summary of the predictive models for CSM1, CSM2 and CSM3 Linear regression (LR) Equation
CSM1 LR degree 2 -3.14e-8 x 2+ 0.0003501 x + 4.133 CSM2 LR degree 2 -3.96e-8 x2 + 0.0004871 x + 4.873 CSM3 LR degree 2 -2.46e-8 x2 + 8.866e-5 x + 6.116
Vibration exposure model implementation according to ISO 5349
Figure 28 shows the implementation of VEM_0 according to ISO 5349 as stated in Equation 2. While Figure 29 shows the implementation of the overall daily vibration exposure calculation according to ISO 5349 as stated in Equation 3.