Managing fluctuations in Overall Equipment Effectiveness
-A Fuzzy approach
PAPER WITHIN Production systems AUTHOR: Ziad Ahmad & Raman Dadwal TUTOR: Mahmood Reza Khabbazi
This exam work has been carried out at the School of Engineering in Jönköping in the subject area Production Systems. The work is a part of the Master of Production Development and Management program.
The authors take full responsibility for opinions, conclusions and findings presented.
Examiner: Kerstin Johansen
Supervisor: Mahmood Reza Khabbazi Scope: 30 credits
Date: 2019-12-06
We want to take this opportunity to thank everyone who gave us support and motivated us A special thanks to our case company DELTA, who helped us to conduct this research at their facility and made this thesis possible. And we also want to thank all the employees at DELTA, especially those who participated and contributed to the interviews.
Our supervisor at DELTA, deserves a special thanks for the time and effort as well as support throughout the whole thesis work.
A special thanks also goes to our supervisor at the university, Mahmood. Thank you for your help and the supervision at various stages of our thesis.
Companies predominantly use OEE (Overall Equipment Effectiveness) as a performance measure and many of these companies deal with fluctuating levels of OEE. It is important to firstly reduce and control the fluctuating OEE levels and then improvement in OEE is logically the next step. It is important to stabilize the process before implementing improvements. A lot of literature is available for improving OEE however very less focus is on the issue of fluctuating OEE. This paper addresses the issue of fluctuating OEE levels with the help of a fuzzy logic approach. An existing but novel concept of fuzzy overall equipment effectiveness (FOEE) is proposed to the case company to complement their Total productive maintenance approach.
The reasons and possible solutions to address the fluctuating OEE have been explored from the literature and the case company findings. Finally, a framework is generated to guide the implementation of FOEE in the case company.
Keywords
Overall equipment effectiveness, FOEE, Uncertainty, Fuzzy Logic, fluctuations, Lean manufacturing, Total productive maintenance
Table of Contents
Introduction ... 7
1.1 Background ... 7
1.2 Problem Description ... 7
1.3 Aim and Research questions ... 8
1.4 Relevance to Area of education ... 8
1.5 Delimitations ... 8
1.6 Chapter outline ... 9
Theoretical background ... 10
2.1 Overall Equipment Effectiveness ... 10
2.1.1 OEE Development ... 10
2.1.2 Six big losses ... 11
2.2 Uncertainty in Production Environment ... 14
2.3 HTO approach ... 15
2.4 Total productive Maintenance ... 16
2.5 Fuzzy Logic and its industrial use cases ... 18
2.6 Fuzzy Overall Equipment Effectiveness (FOEE) ... 20
Method and approach ... 21
3.1 Research design ... 21
3.1.1 Single case study ... 21
3.1.2 The selection of case ... 22
3.2 Literature review ... 22
3.3 Process mapping – Current status analysis ... 24
3.4 Observation ... 24
3.5 Interview ... 25
3.5.1 Semi-structured interview ... 26
3.5.2 Structured interview ... 26
3.5.3 Un-structured interview ... 27
3.6 Survey (Ranking Question) ... 27
3.7 Expected reliability and validity of the research ... 27
Findings and analysis from the case company ... 29
4.1 Process mapping ... 29
4.2 Observation ... 30
4.3 Interviews ... 31
4.4 Survey (Ranking Question) ... 32
4.5 Analysis ... 33
Discussion and conclusions ... 37
5.2 Discussion on findings ... 41
5.2.1 Answering Research Question 1 ... 41
5.2.2 Answering Research Question 2 ... 42
5.2.3 Answering Research Question 3 ... 43
5.3 Conclusion ... 45
5.3.1 Further research and improvements ... 45
References ... 46 Appendices ... 50 7.1 Appendix 1: Interview 1 ... 50 7.2 Appendix 2: Interview 2 ... 51 7.3 Appendix 3: Interview 3 ... 52 7.4 Appendix 4: Interview 4 ... 53
7.5 Appendix 5: Fuzzy Terminology ... 54
7.6 Appendix 6: FOEE calculation steps: ... 55
7.7 Appendix 7: Traditional OEE values derived from software ... 56
7.8 Appendix 8: Ranking Question weightage table ... 58
Table 1 Uncertainty in production environment ... 14
Table 2 Interview Characteristics ... 26
Figure 1 Six Big Losses categorised by Nakajima(1988) ... 11
Figure 2 OEE losses clasification ... 12
Figure 3 Human, Technology and Organisation elements ... 16
Figure 4 Eight pillars of Total productive maintenance ... 17
Figure 5 Different type of membership functions ... 19
Figure 6 Stages of the hermeneutic circle ... 23
Figure 7The three types of interviews ... 25
Figure 8 Demonstration of validity and reliability ... 28
Figure 9 Flow chart over the baking process machine ... 30
Figure 10 Results from ranking question survey ... 33
Figure 11 Traditional OEE level at production line ... 34
Figure 12 Different uncertainties assigned to HTO model ... 35
Introduction
This chapter presents the background of this study and the problem description. Further it presents the aim with the research and the outlined research questions for this study. Lastly this chapter present the area of relevance to the study and delimitations.
1.1 Background
Today’s manufacturing industries are facing increased competitiveness, where a productive and lean focused production process is a major factor in having a competitive advantage. To stay competitive, industries must continuously improve their production processes to stay efficient and productive. Therefore, manufacturing industries are striving for increased productivity and a lean approach since it has a direct impact on productivity (Tay & Chan, 2018). To increase profits, manufacturing industries need to reduce production costs. This can be realized by reducing waste and subsequently increasing productivity. The production processes have become a competitive advantage and that the focus on productivity and lean has increased (Singh, Singh, & Singh, 2018).
The lean philosophy contributes to decreasing the operating cost by eliminating waste and waste is everything that fails to add value to the product or service being provided by the company (Womack & Jones, 1996). This helps us to establish a connection between lean and total productive maintenance (TPM), as the goals of TPM is to bring breakdowns, defects, waste, and accidents to a level of zero (Ahuja & Khamba, 2008). At the same time TPM is not only related to maintenance department rather it brings production and maintenance together (Willmott & McCarthy, 2001). Nakajima (1988) presented the key performance indicator to support TPM which is very well known as OEE (Overall Equipment Effectiveness). It is an efficiency metric that helps to evaluate hidden losses by making a comparison between the actual performance and the theoretical performance (Jonsson & Lesshammar, 1999). OEE has a major role to play in maintaining competitive advantage (R.Oliverson, 2006).
There is considerable research done in the area of OEE since its introduction. Although the metric itself is very informative however over the last 35 years many of its shortcomings have been discussed and solutions have been provided. Especially the literature review by Muchiri and Pintelon (2008) suggests that manufacturers customize and interpret OEE as per their requirements (Muchiri & Pintelon, 2008).
1.2 Problem Description
The decentralized data collections are used to analyse OEE by cumulating different machine states without the consideration of uncertainty (Rößler & Abele, 2013). The presence of uncertainty in such parameters leads to uncertainty in overall performance (Nannapanen, Mahadevan, & Rachuri, 2016).Under uncertainty it is difficult to plan and control the manufacturing operations (Koh & Saad, 2002).
This thesis is attempting to address the research gaps in two ways. Firstly, an ample amount of literature is available for improvements of OEE in various industry types (Manojkumar,
Kesavan, & Kalyanakumar, 2014).Haitham & Mohammad, 2015;Wudhikarn, 2013;Vijayakumar & Gajendra, 2014) however, there is considerably less focus on the fluctuations in OEE levels. Secondly, in recent times the fuzzy logic has been used in some papers to improve the traditional OEE calculations (Zammori, 2015; Rößler & Abele, 2013;Sari & Darestani, 2019;Sonmez, Testik, & Testik, 2018). One of this paper by Zammori (2015) introduces FOEE (fuzzy overall equipment effectiveness) to address the fluctuations in the performance. This novel concept of FOEE has only been tested in a discrete manufacturing environment. A research is needed to be done to explore the capabilities of FOEE in a process industry environment more specifically in food processing industry.
1.3 Aim and Research questions
This research is aimed at reducing and controlling fluctuations in OEE by enhancing the capability of fuzzy OEE in a food processing industry. A framework establishing the connection between the fuzzy OEE and TPM to reduce and control fluctuations in OEE has been attempted and to achieve this following research questions are framed:
To have a firm beginning, it is inevitable to explore the reasons for fluctuating OEE in the literature, hence first RQ is framed as:
1. What are the reasons for fluctuations in Overall equipment effectiveness in a production process?
Once the reasons for the uncertainty are established, the next step is to explore the literature to find methodologies to counter uncertainty therefore the second research question is framed as:
2. How can fluctuations in Overall equipment effectiveness be reduced and controlled? A new concept of FOEE is explored to understand its usability to curtail fluctuating OEE and encapsulate the whole framework of FOEE in the current industry context. The RQ3 is exactly formulated to meet this requirement as
3. How the concept of fuzzy overall equipment effectiveness be used to reduce and control the fluctuation in OEE?
1.4 Relevance to Area of education
This topic related to TPM and OEE holds a considerable amount of relevance to the master’s course in production development and management. The subjects related to production development has a major chunk of literature devoted to these topics and improvements in the production processes would require a study of these concepts.
1.5 Delimitations
The research could only focus on the FOEE as a concept and mathematical calculations as presented in the original research paper for FOEE are not done. The part of paper concerning evaluation of effectiveness and the efficiency of the improvement initiative has been omitted
in this research, which may require an actual improvement plan with same type of FOEE evaluation over the period.
1.6 Chapter outline
Chapter 1 presents the background of this study. Further it presents the aim with the research and the outlined research questions for this study. Lastly this chapter present the area of relevance to the study and delimitations.
Chapter 2 explains the OEE and its development. Reasons for uncertainty in OEE has been explored from literature. Further this chapter has HTO approach for explaining reasons of uncertainty. Approaches to manage OEE fluctuation has also been presented in the end. Chapter 3 presents the methodological approach used in this study. Further presenting the research design used and the different data collection methods used in order to answer the research questions.
Chapter 4 presents the findings from the case company and presents the data from the methods and techniques that was used in this study. Further this chapter explores FOEE in the case company context.
Chapter 5 discusses the methods used in this research, the reason behind choosing the methods used and how well they have contributed to this research. Also, what the strengths and weaknesses of the methods used are and how well the methods used answered the research questions and set the aim of the research.
Theoretical background
This chapter explains overall equipment effectiveness, its development and modified forms. Further theory is presented to elaborate the reasons for fluctuating OEE. Total Productive Maintenance is explained to keep control over uncertainty with introduction to fuzzy overall equipment effectiveness. The theory topics do not necessarily follow an order. Reader can revert to these topics to understand their use in the later parts of the research.
2.1 Overall Equipment Effectiveness
Companies strive for improving their processes and productivity which is becoming a crucial competitive factor. Different performance measures are used and monitored by companies to improve their processes. A performance measure that is commonly used to evaluate the efficiency of production processes is OEE. The term “OEE” stands for overall equipment effectiveness which is used to measure in what degree the machines or equipment’s in a production are utilized (Klabusayova, 2014). Nakizama (1988) provided OEE as aquantitative metric known to support the overarching concept of Total Productive Maintenance(TPM) (Nakajima, 1988). According to Muchiri and Pintelon (2008),”OEE is a measure of total equipment performance, that is degree to which the equipment is doing what it is supposed to do”. It helps to identify and measure the losses for manufacturing aspects namely availability, performance and quality (Muchiri & Pintelon, 2008). OEE has gained popularity by helping companies improve their productivity which is a mojor competetive factor. (Ylipää, Skoogh, Bokrantz, & Gopalakrishnan, 2017). A focus on OEE helps to identify losses and improve them which contributes to increased profits and it is a powerful tool to do so (Puvanasvaran, 2013).
2.1.1 OEE Development
Since its introduction by Nakizama(1988), OEE has evolved over the years. Muchiri and Pintelon(2008)has done a comprehensive literature review on this topic. The modified versions of OEE has been proposed to overcome the inefficiencies of the traditional OEE, these modifications are mainly motivated by looking into effectiveness at the equipment level or at the factory level (Muchiri & Pintelon, 2008).
TEEP (Total equipment effectiveness performance) and PEE (Production equipment effectiveness) are two of the modified forms at the equipment level. TEEP introduced by Ivancic (1998) differs from OEE in a way that it clearly differentiates between planned downtime and the unplanned downtime (Ivancic.I, 1998). PEE introduced by Raouf (1994) puts emphasis on weights associated with availability, performance and quality and it also makes distinction between discrete and continuous production processes (Raouf.A, 1994). OFE (Overall factory effectiveness) was developed by Scott and Pisa (1998) to express the factory level effectiveness of the production process where there are a multiple number of production steps and machines are involved (Scott & Pisa, 1998). Further Huang et.al (2003) came up with OAE (Overall asset effectiveness) which uses simulation analysis as a reliable method to understand the dynamic nature of the production processes (Huang, Dismukes, Mousalam, & Razzak, 2003).
OPE (Overall plant effectiveness) and OAE (overall asset effectiveness) are extensions of the OEE tool which helps to identify and measure all the losses in a production process. Both terms are same from an industrial application purpose, but losses differ when using them across different industries (Muchiri & Pintelon, 2008).
2.1.2 Six big losses
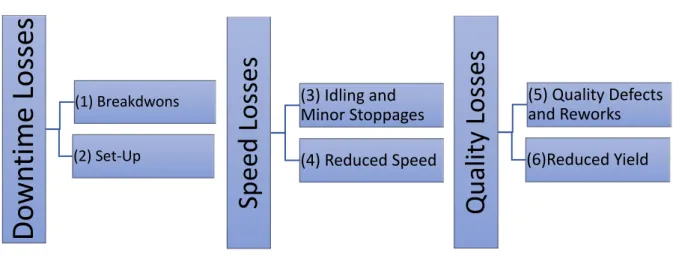
Nakizama (1988) categorised six big losses under three categories namely Downtime losses, Speed losses and Quality losses. Downtime losses are due to (1) breakdowns and (2) set-up(adjustment) losses. Breakdown losses are categorised as time losses and quantity losses due to equipment breakdown or failure. When there is change in the product then the time consumed during that changeover is associated with set-up losses. Speed losses includes (3) idling and minor speed losses as well as (4) reduced speed losses. When there is a temporary malfunction or machine is in the idling position, the loss of time is associated with speed loss. Every equipment has a designed speed and there is actual operating speed, the difference in these two speeds is referred to as the reduced speed loss. Quality losses includes (5) quality defects and reworks along with (6) reduced yield during start-up. Figure 1 presents the losses. Malfunctioning production equipment can cause quality defects and reworks. The reduced yield losses are due to loss of yield from machine start-up to machine stabilization (Nakajima, 1988).
Figure 1 Six Big Losses categorised by Nakajima(1988)
A production suffers from losses and breakdowns which lower the efficency and productivity.The bottleneck of the production could be a single equipment, tool or a human. Hence OEE is a method to measure those losses and is not only focused to the whole line but individual parts of the line aswell. This enable analyzing the losses and the causes for the losses (Klabusayova, 2014). The more common way of representing downtime losses, speed losses and quality losses is in terms of availability, performance and quality. The breakdown,
Do
w
nt
im
e
Lo
ss
es
(1) Breakdwons (2) Set-UpSpe
ed
Losse
s
(3) Idling and Minor Stoppages (4) Reduced SpeedQualit
y
Losse
s
(5) Quality Defects and Reworks (6)Reduced Yieldadjustment and setup losses belong to the availability faction. While the speed losses are related to the performance ratio, and lastly the rework and yield losses belong to the quality ratio. For instance, when performing planned maintenance, unplanned maintenance, setup or improvements it stops the equipment which decreases the availability. As long as the equipment is available for usage it does not affect the availability. Performance is on the other hand defined as how much was done compared to what was planned. Therefore, speed losses as small stoppage or low productivity does affect the performance ratio. When running a production there can be quality losses which can be defined as scrap, default products, defects or rework, which increases the quality losses (Puvanasvaran, 2013).
TCT=Total Calendar Time
CLT OT=Opening Time NWT T LT=Loading Time SBT Tim
NLT=Net Loading Time
DT OpT= Operation Time
PLT NOpT= Net Operating Time
QRT VT=Valuable Time
Equipment’s
Losses Equipment Working Time Equipment Independent Losses Not ascribable to equipment External losses not ascribable to system
Figure 2 OEE losses clasification adapted from Zammari (Zammori, Braglia, & Frosolini, 2011) CLT= Closing Time; NWT= Non-Working Time; SBT= Stand by Time DT= Down Time (Big Losses 1-2) PLT= Time Losses due to reduced performance (Big Losses 3-4) QRT= Time Losses due to Quality Rate (Big Losses 5-6)
The Figure 2 explains the time break-up of Total calendar time (TCT). The Closing time (CLT) is the time for holidays, festivities, exceptional events etc. Non-Working time (NWT) is the time lost due to lack of demand, stock-outs, strikes, line overhauls etc, Stand by time (SBT) is the time lost due to planned maintenance, starving, blocking, on-line quality control, handling, loading etc., down time(DT) is lost time due to failures, reactive maintenance, recalibration etc., performance losses(PL) is time consumed in micro stoppages, start-up, reduces speed, regulation, cleansing etc. and finally the Quality rate (QR).The major losses are divided into equipment dependent and equipment independent losses. The equipment dependent time losses are such due to failure, set-up, defects etc. while the equipment independent time losses are starvation, stock-out, lack of demand etc. The closing time (CLT), non-working time (NW) and standby time (SBT) are under the equipment independent category. Down time (DT), performance loss time (PLT) and QR (quality rate) are under the category equipment dependent time losses (Zammori, Braglia, & Frosolini, 2011).
𝑂𝐸𝐸 =)*+*,*-"*'$#($#!"#$%&'$#($# = ./∗23/./∗1/=23/ 1/ ... (1)
VT=Valuable Time, NLT=Net Loading Time, CT=Cycle Time
Here VT is the fraction of time during which the equipment has worked under optimal conditions. NLT is the fraction of time during which the equipment is scheduled to produce and CT is the standard time needed to process one item (Zammori, 2015).
More commonly OEE is represented as
𝑂𝐸𝐸 = 𝐴 ∗ 𝑃 ∗ 𝑄 … (2)
A= Availability Rate, P=performance Rate, Q= Quality Rate of output
Zammori (2011) has proved that Eq. (1) and Eq. (2) are coherent with each other.
Operating Time (OpT)= NLT-DT … (3)
Net Operating Time (NOpT)=OpT-PLT … (4)
Valuable time (VT)=NOpt-QRT … (5)
From eq. (1) OEE= 1/ 23/ = '(# 23/∗ 2'(/ '(# ∗ 1/ 2'(/ = )23/56/23/ * )'(/573/'(/ * )2'(#58)/2'(# * = )23/56/23/ * )9:../23/ * )1 −6<9:* = 𝐴 ∗ 𝑃 ∗ 𝑄 … (6) Where,
MI = total number of manufactured items DF=total number of defective items
2.2 Uncertainty in Production Environment
Any unpredictable event in the production environment that disturbs the operations and the performance of the enterprise is called uncertainty (Koh & Saad, 2002). Ho (1989) has categorised uncertainty in two broad groups namely 1) environmental uncertainty and 2) system uncertainty. Environmental uncertainties pertain to uncertainties beyond the production process which includes demand uncertainty and supply uncertainty. System uncertainty is associated to the production process which includes quality uncertainty, production lead time uncertainty, failure of production system, operation yield uncertainty and changes to product structure (Ho, 1989). The focus of this research is the production process related uncertainties therefore system uncertainty is considered only.
Uncertainties can be related to disturbances at the shop floor such as resource breakdowns and random production lead times. The availability of the machines is going to vary a lot due to breakdown times. The loss of time due to breakdown of machines, set-up of machines and scrap becomes the key factor for increase in production lead times (Azizi, bin Ali, & Ping, 2015).
Researchers have explored the uncertainty associated with data collection methods at the shop floor (Rößler & Abele, 2013; Sonmez, Testik, & Testik, 2018). The current state analysis begins with the data collection from different machines. The data collection methods are predominately manual and semi-automatic, and the quality of data in these methods is usually not up to the mark and leads to inaccurate conclusions (Rößler & Abele, 2013).When operators are involved in data collection on the shop floor there are sources of uncertainty as the data recording process is itself disturbance in the operation cycle, for example the operator may feel overburdened with minor stoppages or answering short questions, the self-written logs are also error prone (Bokranz & Landau , 2006).
Table 1 Uncertainty in production environment
Uncertainty in production environment Reference
Resource breakdowns Azizi, bin Ali, & Ping, 2015 Production lead times Azizi, bin Ali, & Ping, 2015
Data collection methods Sonmez, Testik, & Testik, 2018; Bokranz & Landau , 2006; Rößler & Abele, 2013 Categorisation of losses Rößler & Abele, 2013;Zammori, 2015 Data collection period Zammori, Braglia, & Frosolini, 2011 Changing product mix Roessler & Abele, 2015
Capacity uncertainty Fazil Pac, Alp, & Tan, 2009 Labour Uncertainty Fazil Pac, Alp, & Tan, 2009
Quantity uncertainty Clay Whybark & Gregg Williams, 1976
Another cause for uncertainty may arise from the categorisation of losses i.e. the loss is associated to which parameter of OEE (Zammori, 2015). Even if the semi-automatic data collection systems being used there will always be need of a human being to categorise the losses (Rößler & Abele, 2013).
The definition of data collection period is also a source of uncertainty. Different time horizons may reflect different trends in OEE, the daily value of OEE would be highly uneven due to day to day variability of the manufacturing process. In another scenario if the OEE values are taken on a monthly or quarterly timeframe , it converges to an average value and the variability of the process is concealed (Zammori, Braglia, & Frosolini, 2011).
Changing product mix when a variant of the product is produced on the same production line the changeover time must be considered, in relation to this changeover time there will be more effects on machine, tools or services. This may lead to fluctuations in OEE and fuzziness (Roessler & Abele, 2015).
The maximum amount of production that can be achieved by using external or internal resources in known as capacity. Capacity can be considered in terms of machinery as well as workforce (labour). Absenteeism, sickness and fatigue can be potential reasons for labour shortage. To meet the demands of increased capacity, companies opt for outsourcing, renting equipment, hiring contingent workers etc. However, this need for external capacity may not be met always due to lack of available quantity or quality hence it leads to capacity uncertainty both in labour as well as machinery (Fazil Pac, Alp, & Tan, 2009).
Quantity uncertainty can be viewed from supply side as well as from demand side. Supply side uncertainty occurs when there is shortage of material, scrap occurs or when production overrun occurs. Demand side uncertainty occurs when there is changes in the master production schedule to match the changes in the customer orders or demand forecasts (Clay Whybark & Gregg Williams, 1976)
2.3 HTO approach
Any manufacturing process is a complex web which has interactions between process tools, materials, machines, people, departments, companies, and processes (Scott & Pisa, 1998). Many a time an isolated view of these interdependent activities is taken into consideration which results in inefficiency due to lack of coordination in deploying these resources, therefore it becomes inevitable to focus attention beyond an individual equipment to overall performance of the factory. The goal is to have a highly efficient integrated system instead of brilliant individual equipment (Oechsner, Pfeffer, Pfitzner, & Binder, 2003).
To gain a better understanding of such a system a different approach is required. Therefore, an approach called HTO (Human, Technology, Organisation) is used in this paper to have a better understanding of the underlying reasons of uncertainty as shown in Figure 3. HTO is an approach to understand the complex systems from a systems perspective ( Karltun, Karltun, Berglund , & Eklund, 2017).
Figure 3 Human, Technology and Organisation elements as presented by Carayon(2006)
It establishes the interactions and interdependencies of the three included elements namely Human, Technology and Organisation (Carayon, 2006). The HTO concept finds its application in many contexts as explored by Karltun et al. (2017). This concept can also help to put the different reasons of fluctuations in OEE in a right perspective.
2.4 Total productive Maintenance
Today’s manufacturing companies are facing rapid changes in process and technology development but also customer expectations are changing. This has increased the competitiveness and forced them to continuously improve their processes and technologies. The importance of flexibility, quality and delivery speed has become crucial in order to stay competitive on the global market. Focusing on the overall quality and performance improvements within the organization is an important factor to stay competitive. Organizations have shown lack of interaction between quality and maintenance management. Maintenance has not been considered as a competitive factor; they have therefore put less effort in improving the maintenance strategy. This has contributed to low availability of equipment’s and machines, increasing downtimes of the technical systems but also affected the overall quality negatively. Whenever the downtimes, availability and quality failures have increased, the delivery performance has been affected negatively as well (Ahuja & Khamba, 2008).
Maintenance is commonly considered to have a less rate of return and therefore not prioritized. Improving the maintenance plan and strategy could easily reduce the maintenance costs and improve the level of productivity. The organizations do not realize the impact maintenance have on fulfilling their objectives. A good maintenance plan and structure could eliminate waste and increase overall performance of an organization. Bringing value for the end customer is also one of the main achievements of an optimal maintenance because, maintenance affects the costs, materials, tools, machines, equipment’s and manpower. All those aspects are related to costs and quality which have a great impact on the end customer. In order to have an optimal maintenance and including all people and departments in a company the philosophy “total
Human
Organisation
Technology
productive maintenance” was introduced. TPM as it is also called, was introduced as a system to improve and maintain processes, people, machines and equipment’s which add value to the end customer and the business. Total productive maintenance is used to set a strategic maintenance which in includes all people within an organization and is implemented to improve the effectiveness of the whole organization. In order to include people, the mindset and the culture must be changed through the implementation of TPM (Jain, Bhatti, & Singh, 2014).
As mentioned earlier, total productive maintenance contributes to effective production and improves competitiveness. TPM also has an impact on improving the overall equipment effectiveness, by improving the availability, quality and decrease rework. OEE and TPM is therefore strongly connected. Through TPM an organization could decrease the scrap rate, improve the productivity both on human and technology level but also decrease downtimes. The core value of TPM is to include everyone in the maintenance practices (Jain, Bhatti, & Singh, 2014). In TPM there are eight pillars as shown in Figure 4 Eight pillars of Total productive maintenance that together contributes to higher labour productivity, decreased costs for maintenance and less stoppages and downtimes. Total productive maintenance is a system of maintenance that covers all parts of an equipment, which are connected to it as manufacturing, people and planning for instance. Therefore, the main goal of TPM is to obtain zero defects, zero breakdowns and zero rework (Jain, Bhatti, & Singh, 2014).
Figure 4 Eight pillars of Total productive maintenance (Jain, Bhatti, & Singh, 2014)
Adesta et.al (2018) has explained the eight pillars of TPM in their research involving evaluation of eight pillars as:
Autonomous maintenance stresses making equipment operators responsible for carrying out basic maintenance of the equipment, this results in equipment becoming more reliable and a sense of responsibility is felt by the operators ( Adesta, Prabowo, & Agusman, 2018)
Planned maintenance involves scheduling the maintenance plan based on the historical failure rate of the equipment. Whenever there is less production orders maintenance can be planned to avoid time loss.
Autonomous
maintenance maintenanceFocused
Safety, health & environment Office TPM Quality maintenance Development management Education & Training Planned maintenance
Education and Training helps to bridge the knowledge and skill gap using on the job training for employees. Employees acquire skills required for problem solving.
Development management involves the design of the new equipment using the lessons learned from the TPM activities. The new equipment can make use of its full potential in less time. Focussed/Continuous improvement emphasises on use of cross-functional teams for improvement activities. This kind of mindset among workers enhances problem solving attitude. PDCA (Plan, do, check, act) is a tool predominantly used to facilitate continuous improvement.
Quality maintenance has to do with inbuilt quality in the equipment to minimize the defects. This results in considerable reduction in the rejections and because of this profit increases. TPM in Office cover the administrative functions under TPM and helps the support functions to understand the importance of improvement induced by TPM
Safety, Health and environment provides working environment characterised by safety as priority.
2.5 Fuzzy Logic and its industrial use cases
In real world scenarios there are many situations when there are no clear boundaries, in such situations the application of classical set is restricted. This led to introduction of fuzzy logic. We can take an example to understand the need of fuzzy logic e.g. It is easy to identify the class of animals dogs, horse, birds etc. and at the same time one can easily exclude rocks, rivers, sea from this class, but when it comes to classify the bacteria or starfish etc. there is ambiguity (ZADEH, 1965). To address this ambiguity Zadeh (1965) proposed the fuzzy set of numbers. In the words of the Zadeh (1965):
“A fuzzy set is a class of objects with a continuum of grades of membership. Such a set is characterized by a membership (characteristic) function which assigns to each object a grade of membership ranging between zero and one” (ZADEH, 1965).
As defined in earlier section the characteristic function of a crisp set assigns a value of either 1 or 0 to each individual element in the universal set X, in this way crisp set differentiates between members and the non-members of the crisp set. The generalization of such a function gives values assigned to the elements in a specified range which represents the degree of belongingness or in other words the degree of membership of that element to the set-in question. This function is known as membership function and most commonly used range is unit interval [0,1]. Now using the definition of membership function, we can write the fuzzy set in mathematical terms as:
A fuzzy set 𝐹. in a universe U is characterised by membership function 𝜇<= (𝑢),which associates each element 𝑢 in U with a real number in the interval [0,1]. The function allows various degree of membership for the elements of given set. Here the nearer the value of 𝜇<= (𝑢) to 1, the higher the grade of membership of 𝑢 in 𝐹. (Sonmez, Testik, & Testik, 2018).
There are many types of membership functions in use, e.g. triangular, trapezoidal, gaussian etc. as presented in Figure 5 Most commonly used are triangular (Tfn) and Gaussian (Gfn) majorly because of their flexibility in representing vague entities. The triangular functions are known
to be less accurate and flexible but at the same time the loss of precision is less hence the choice can be neutral between Tfn and Gfn (Zammori, 2015).
Figure 5 Different type of membership functions using Fuzzy Logic Toolbox from MATLAB
In the beginning fuzzy logic was used in areas such as economics, social sciences to deal with uncertainties brought by unclear and vague information, later fuzzy logic also found its applications in the engineering fields (Wood & Atonsson, 1989).
There are increased number of components and interconnections in a production system, this makes it hard to accurately analyse the system performance (Dengiz, Sahin, & Atalay, 2019). Therefore, the use of fuzzy logic in industrial context has been prevalent in recent times (Sharma, Kumar, & Kumar, 2005;Zammori, 2015;Rößler & Abele, 2013;Sonmez, Testik, & Testik, 2018;Dengiz, Sahin, & Atalay, 2019)
Dengiz et.al (2019) applied fuzzy logic in a lead-acid battery manufacturing company for computing the availability in fuzzy terms. Their approach helped to fetch more detailed information where a complex system behaviour existed. The scarce availability of historical data is compensated by defining it as fuzzy membership functions.
Sonmez et.al (2018) took a PVC extrusion process as case study in an environment where there were uncertain production speeds and stoppage durations caused inflated/deflated OEE numbers. This approach helped to quantify the uncertainty in durations with limits.
Röbler and Abele (2013) used fuzzy analysis in a production environment where plungers were being made for pneumatic cylinders. They have considered uncertainty in OEE analysis. The case study resulted in transparent and more reliable results. This helped to exploit the optimization potential of the production system.
Sharma & Kumar (2005) used fuzzy logic to form a suitable maintenance strategy. The study reflected how vague, imprecise and ambiguous information converted into numerical terms helps to form most informative and efficient strategy. An industry which suffered from frequent failures due to gears in their equipment was taken into consideration.
Zammori (2015) has taken a coil winding process in a manufacturing firm to address the OEE fluctuation using LR fuzzy numbers. This approach helped to assign the share of overall manufacturing fluctuation to the specific cause. It acted as a support tool for SMED (single minute exchange of dies- a setup reduction technique) improvement effort. This research is
motivated using the work of Zammori as the approach is much more suitable in the case company considering the fact that it addresses the fluctuations in OEE.
It’s important to understand the basic fuzzy logic and its related terminology that is presented in next section.
2.6 Fuzzy Overall Equipment Effectiveness (FOEE)
The concept of Fuzzy Overall Equipment Effectiveness (FOEE) was proposed by Zammori (2015) to extend the capabilities of OEE by capturing the day to day fluctuations to which manufacturing process are subjected. Roessler and Abele also highlighted the use of fuzzy logic to mathematically include variability and fuzziness of the process and also coping with the fluctuations (Roessler & Abele, 2015).The core of this concept is usage of fuzzy logic to evaluate OEE. In this research we are using FOEE provided by Zammori (2015) in the framework for addressing fluctuation of OEE. As explained in the earlier section about the equipment dependent and equipment independent losses, FOEE represents these losses as LR fuzzy numbers. The broad outline for the calculation is as following:
According to Zammori (2015) the steps for FOEE calculations are: Step1: Decompose the input fuzzy numbers
Step2: Transform the 𝛼 𝑐𝑢𝑡𝑠 into an array of their boundary elements Step3: Evaluate functional expression
Step4: Transform and recompose the output
For details of these steps’ reader is referred to the appendix 6.
The calculations for FOEE are driven from above mentioned steps however the actual application of FOEE is done using following framework provided by Zammori (2015) in his paper:
Identifying important losses
Multi-skilled focussed groups should be formed to identify the losses and corrective actions must be formed. The identification of losses having greatest undesirable impact on the overall performance helps to avoid irrelevant and ineffective solutions. To achieve this FOEE has the capability to calculate the degree of influence of individual loss.
Evaluating corrective actions
The evaluation of corrective action must be done in terms of effectiveness and efficiency to achieve positive results. FOEE also provides this ability to calculate the effectiveness and the efficiency of the corrective action (Zammori, 2015).
Choosing corrective actions
After the evaluation it becomes easy to compare the corrective actions. It can be done by using the degree of influence to rank the losses in order of criticality. The effect of each corrective action can be estimated by getting the reduction in the time loss. This can be done in two ways either by using linguistic variables such as ‘High’, ‘Medium’ and ‘Low’ and expert can be directly consulted as well. FOEE can be calculated for each corrective action and the corrective action which maximises the value of FOEE can be selected for implementation.
Method and approach
This chapter presents the methodological approach used in this study. Further presenting the research design used and the different data collection methods used in order to answer the research questions.
3.1 Research design
To ensure an effective strategy to address the research problems a suitable research design was chosen. Therefore, this section will present how the research design was outlined and under which underlying methodological considerations that was taken for this study. This research focus on one kind of machine process line, and by that the results can be investigated by applying them to additional cases in other settings (Williamson, 2002). The validity of this thesis is to be verified after examining the answers to the research questions and research is designed in a way that all the research questions are answered by combination of data from different data collection techniques.This has been presented in the discussion on methods chapter to address the validity and reliability of the research.
3.1.1 Single case study
This thesis uses a combination of previous research knowledge with new topics that have not been touched in a broad sense. The research related to fuzzy overall equipment effectiveness and its usage in food industry has not been studied, and how FOEE is related to variability. Therefore, doing a case study is suitable to combine previous research knowledge with new undiscovered research. Whereas case studies are a suitable research method to discover new knowledge and building connections between different areas (Vissak, 2010). Therefore, this method is appropriate for theory building for these research questions that is outlined in this study.
1. What are the reasons for fluctuations in Overall equipment effectiveness in a production process?
2. How can fluctuations in Overall equipment effectiveness be reduced and controlled? 4. How the concept of fuzzy overall equipment effectiveness be used to reduce and control
the fluctuation in OEE?
A single case study is a research method which contributes to a deep understanding of a problem or a case and contributes to increase the capability of the current theory. Therefore, this method is considered as a qualitative research method (Zhou & Creswel, 2012). When dealing with a single process as it is in this case, it is preferable to use the single case study method. Because this method is suitable when working with a single process or location (Jasti & Kodali, 2014). Although this study is focusing on single case study not to generalize rather testing theory in a new setting as in this case is the food industry. Furthermore, this study is of an exploratory nature and which allow a deep understanding of this phenomena. A multiple
case study is not used in this research since it takes a huge amount of time and data. Since this study takes place at one company within their production line, the single case study is preferred for this research (Yin, 2018).
A case study is a common method used when testing a theory, as in this study where testing how FOEE can be evaluated in a food industry. The method does test, challenge and develop the theory, which is the same case in this study. Evaluating FOEE is expected to test and develop the theory since there is no documentation of FOEE in food industries (Marques, Camacho, & de Alcantara, Caio, 2015). In this study a case study is a suitable tool to test the theory. A case study can fulfil one of its research goals which is theory testing, hence in this case there is one chosen situation within the company’s production with a usage of a theory. When testing the theory an amount of data and information is needed, therefore different data collection methods and techniques are used in order to do that. As a case study contributes to a deeper understanding, it also creates a way for testing theories in a specific location. As in this study were the theory of FOEE is evaluated in a new context. By testing the theory is a new context or setting it contributes to building of the current theory regarding FOEE (Løkke & Sørensen, 2014).
3.1.2 The selection of case
The case in this study was chosen based on the area of research the researchers were interested in, which was OEE. The method is widely used in industries today and has a high recognition of its importance. Researchers have been developing the new concept FOEE which is a more specific method used to overcome fuzziness in the production processes. There is no research done in the food industry where FOEE is tested or implemented. Therefore, this study aims to contribute to research expanding FOEE in a food industry (Zammori, 2015). Furthermore, the method is new and there are a lot of areas to discover and test. The food industry that was chosen for this study is struggling with their fluctuating OEE levels. The company uses systems for categorizing and calculating OEE, which is an advantage for this study. The software program is deployed to calculate the OEE parameters and a dashboard is displayed. This dashboard provides the visual information which makes it easy to interpret results. Appendix 7.7 shows the snapshots of the dashboard. This facilitated the understanding between the company and the researchers for this area of research.
3.2 Literature review
Literature review is a research method or strategy that is used to collect current knowledge regarding a subject and insights for future research and topics. It is used to present a summarized framework of current research and what has been done in previous research for a specific topic. A literature review also provides an understanding of a new research are of a topic which have been suggested in earlier research. It can be used to guide the researcher into a specific topic of interest. While doing a literature review different research gaps are found which can guide the researcher into a new phenomenon or problem to focus on (Rowe, 2014). A literature review process starts with a research question or topic of interest which the researcher follows when performing the review. By having a topic of interest when starting a literature review it supports the researcher to narrow the search. While doing a literature review the researcher analyze, criticize and create a summary of the results from the literature that has been analyzed and criticized (Baker, 2016). In order to find the topic of interest, the hermeneutic circle can be used. The hermeneutic circle is a systematic approach to contribute
to explanatory understanding. The idea of a hermeneutic circle method is to provide a framework for the literature search (Boell & Cecez-Kecmanovic, 2010).
Figure 6 Stages of the hermeneutic circle (Boell & Cecez-Kecmanovic, 2010)
Figure 6 shows all the steps. The first step in the hermeneutic circle is to search for literature and start with an area or topic of interest without being to specific or narrowed. Being to specific or narrowed might exclude interesting articles or reviews that might be valuable. When searching for documents there are different strategies to exclude irrelevant literature, a common strategy is field searching. When doing field searching, different factors that can adjusted in order to find relevant literature. For instance, by excluding some document types as books or specify the language that is relevant and understandable. This will contribute to effective literature searching and target more relevant literature. Another way of excluding irrelevant literature is by using terms as “AND”, “OR” and “NOT” which will help target relevant literature to the area of interest. The hermeneutic circle includes a step named “sorting” which means using citations to rank the results of the literature search. This step is not relevant for this research since the literature used are a couple of years old. Ranking using citations is helpful when using old literature to identify publications that has been used extensively, which is not relevant in this case (Boell & Cecez-Kecmanovic, 2010).
Next step is to analyze the results of the literature search, by reading the abstract and the title to get an understanding if it is relevant. The literature that is potentially interesting and useful for the research is selected for further investigation. If the literature that has been found is not interesting or desired, then the process starts from step one again until the desired documents is found. These selected documents are to be read in the next step to better understand them. While reading the documents, the comparison can begin between all the documents. Different concepts or methods is compared between different documents, and different results are analyzed as well. This is done in order to gain an understanding and to find new related theories or search terms. Hence the references are used to search for more relevant documents, this can also be called snowballing. The snowballing technique is used to trace more relevant documents. Also, by using citation references it can lead to interesting documents which are related to the topic of interest. This is a way of refining the search and targeting the desired documents and theories. This process is an evidence of how documents that might not been interesting or excluded are at the end included in the results of the search process (Boell & Cecez-Kecmanovic, 2010). Search Sorting Select Read Identify Refine
3.3 Process mapping – Current status analysis
When working with different lean tools or methodologies in a production, it is necessary to establish a map of the process. It is done to acquire a whole picture of a process line and by that receive a better understanding of the process. The process mapping is also used when implementing a lean manufacturing method. When doing a process map, the whole process is being described into steps where the wastes are identified. Also, to better understand how different activities during the process are being executed and handled. By doing a current status analysis of the current process, different problems within the production become visible. This gives a better understanding of where the company are today and in what direction they actually where heading. Basically, the process mapping allows a comparison between how the process perform compared to what is planned (Klabusayova, 2014). The authors Barbrow and Hartline (2015) mentions the advantages with process mapping and its functionality. A process mapping allows a visual view over the process of a production and the actions that are executed. A process map can be designed in different ways based on the process and the need. Therefore, a process map is not a standard tool, its rather a flexible tool that can be designed in different ways. A process map is a critical first step when working with process improvements.
Focusing on the production line and understanding its process in this case company is the first step in order is to decrease the stoppages which increases the productivity (Kamble & Wankhade, 2018; Barbrow & Hartline, 2015). The authors Prasad, Kumar and Prakash (2015) mentions the importance of wholeness of an organization to improve productivity in different parts of the organization and not only one. Therefore, the process that is considered in this study is not the only factor considered, rather it is the structure of the system which collect the data from the machines that is considered (Prasad, Kumar, & Prakash, 2015)
As mentioned before there are different ways of doing process mapping, where flowchart is a central type of process mapping. A flowchart is basically designed as different shapes that are connected to each other following a line. The shapes can look different, as for instance circles, rectangular, cylinder and as triangles. Each type of shape or figure represent an element that is part of the process flow, for instance, a rectangular form action. Each shape is connected with a line or arrow which represent a sequential process flow. In each shape the type pf action or element is described with few chosen words (Barbrow & Hartline, 2015).
3.4 Observation
When working with process improvement or problem solving it can be useful to use different techniques and tools. These tools and techniques can be used to collect different types of data in order to get a clear overview and to better understand different situations. Finding the root cause is the goal in order to improve and therefore, one must understand the problem first. A useful tool that is effective to use is observation, which means observing different situations or phenomena. The reason behind choosing the observation as a tool was to gain a picture of the company’s production. Also, the reason was to see the production in its natural form, daily routines, people’s behavior and activities. The first observation was done without any biases or perceptions. For an observation to have a qualitative outcome it was important not to be biased and have perceptions. The first observation was an unstructured observation as the authors Arumugam, Antony and Douglas (2012) characterize this type of observation. The agenda with the first observation was to receive as much information as possible of the production (Arumugam, Antony, & Douglas, 2012).
The second observation was well planned and prepared, the authors Arumugam, Antony and Douglas (2012) characterize this type of observation as structured. The reason is because as the authors Arumugam, Antony and Douglas (2012) mentions the importance to understand that observation is more than just observing. Interviews was done before the observation in order to understand the functionality of the processes within the production. So, the purpose of the observation was clear and known before the execution of the observation. Since observation is a method for collecting data, everything observed was written down and documented. A method that was also used when observing the production at the company, was repeating why five times at every situation that was not clearly understood. This contributed to better understanding of different situations and more useful data. Doing an observation at different occasions and over different times can contribute to qualitative data since changes in behavior, activities and routines can occur. Therefore, the observations took place in over periods of time and in different times during their working days (Arumugam, Antony, & Douglas, 2012).
3.5 Interview
An Interview is a method used to collect information and data, where the different types of interviews can be qualitative and quantitative. The questions asked during an interview can also be quantitate and qualitative depending on how the questions is asked. An open question will have an open answer which is considered as qualitative. Whilst a closed question will have a closed and quantitative answer. For an example asking questions that are specific with yes or no as an answer will not provide useful data or information. As the authors Noonan and Doody (2013) mentions that talking is natural which makes interviews a useful method to better understand people and situations. Interview as a method was chosen for this research to contribute to discussions and qualitative answers. Handing a paper with questions will not be the same as having an interaction with the participant and asking questions. Therefore, the way the research is designed will determine the quality of the outcome (Noonan & Doody, 2013). Since the research questions are exploratory in nature, this research applied both structured, unstructured and semi-structured interview approaches. (Saunders, Lewis., & Thornhill, 2012). Figure 7 illustrates how the different interview types complement each other and target the participants from different angles in order to receive as qualitative information and answers as possible.
Figure 7 The three types of interviews (the interview types complement each other) (Saunders, Lewis., & Thornhill, 2012)
Interview Structured interview Semi-structured interview Unstructured interview
Table 2 presents the different interviews, from what department the participants are from, their role and how much time the interview was held with each participant. In order to hold an interview with each of the participants, different times and days was needed to be planned since they work in different departments and have different times.
Table 2 Interview Characteristics
Sr No. Department Role Interview Time
1 Production Continuous improvement engineer 45 Min
2 Production Technical Manger 45 Min
3 Production Machine Operator 45 Min
4 Quality Quality Engineer 45 Min
3.5.1 Semi-structured interview
A common interview type that was used to collect data in this research is a semi-structured interview type. This type of interview is commonly used when doing a qualitative research according to Noonan and Doody (2013). The name semi-structured may speak for itself, where it is a flexible type with a mix of both structured and unstructured interview types. The researcher has questions prepared but is not to specific with the order when asking them to the participant. Also, the researcher using this type of interview can add more questions while doing the interview. Performing the interviews at the company a lot of different situations and issues appeared and additional questions was added to the participant. Being able to add questions and set the planned questions according to the situation are the reason why semi-structured interviews contribute to qualitative research. During the semi-semi-structured interview at the company, different situations and answers were not clear. This created more questions for the participant in order to understand, which provided a deeper understanding for this research. This interview type was useful when visiting the company for the first time, because it is an unknown setting and the situations that might emerge is unpredicted (Noonan & Doody, 2013).
3.5.2 Structured interview
Starting with a semi-structured interview eased the planning for the structured interview. The semi-structured interview contributed to a good understanding of the company, their processes and the challenges they face. Therefore, starting with the semi-structured interview provided a good foundation for the structured interview. A structured interview is unlike semi-structured interview, specific, planned, follow a structure and the questions are prepared from before and followed in the planned order. Each question is asked to the participant or participants and answered accordingly. Following this interview type it enabled a lot of useful data and an
answer for each question. This structure contributed to easier documentation, analyze and comparison of the received data. The authors Noonan and Doody (2013) mentions the advantages with using a structured interview for easier data collection and easier to analyze the received information. The researcher can also control the interview through following the structure and the time plan which contributes to an efficient use of the time (Noonan & Doody, 2013).
3.5.3 Un-structured interview
When a research is taking place at an unfamiliar company it is difficult to know what questions to ask and the different competence the employees have. Therefore, the unstructured interview type was an asset for this research. To understand the present status of a company it becomes difficult to ask specific questions since the researchers have no knowledge about the new company, they are performing their research at. At that situation an unstructured interview is suitable with open questions, which provides background data for the researches. This will enable the participants to develop their answers and not be restricted by the question. According to Noonan and Doody (2013) the unstructured interview type contributes to rich and qualitative data (Noonan & Doody, 2013). The unstructured interview is an informal type and serve the exploratory purpose to gather in-depth information (Saunders, Lewis., & Thornhill, 2012).
3.6 Survey (Ranking Question)
Survey research deals with collection of primary data from all parts of the population. While surveying a small population it can be performed with all the elements of the population. Descriptive survey is a type of survey which is concerned with fact gathering. Under descriptive survey method electronic questionnaire is one of the data collection technique. In this type of survey Ranking can be used in closed ended questions (Williamson, 2002).In ranking question survey, the respondents are presented with response choices and are asked to rank them based on the criteria mentioned in the question and their preference (Zikmund, Carr, Babin, & Griffin, 2013).
3.7 Expected reliability and validity of the research
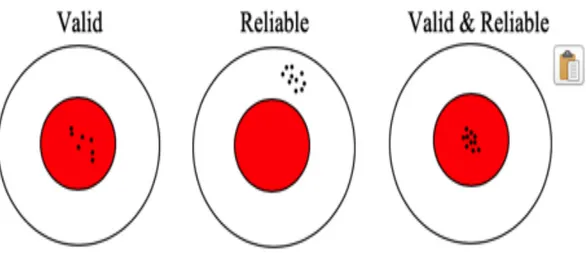
Considering validity and reliability is important while doing research, which means that the research must be taken into consideration whether it is reliable and/or valid. There are different criteria for what can be considered as valid and reliable. A valid research is defined as trustworthy or correct and is usually better proven when doing quantitative research than qualitive research. To ensure validity in a research the process of what the methods or tools was used and if they were used correctly as shown in The Figure 8 demonstrates that validity is fulfilled if the used method is used correctly where the red area is the target for the method to fulfil. For instance, performing a survey which is to collect the age of people living in a village. The questions within the survey should be asking about the respondents age to be considered as valid, because it will actually generate the answer that is asked for (Hayashi Jr, Abib, & Hoppen, 2019).
Figure 8 Demonstration of validity and reliability (Yin, 2018)
A reliable research is if you replicate the same method, the researcher should receive the same results. When it comes to the reliability of the thesis which involves a single case, the results might be similar if same type of study is conducted in different settings but in in this study, there are more focus on getting the analytical generalizability than statistical generalizability. The difference between the analytical and statistical generalizability is that analytical attempts to connect the findings from a specific case to a theory. While statistical generalizability is the opposite, using the result from a sample and apply it to a population. Which as mentioned before is not the case in this research, here the findings are linked with a theory. Since the company has parallel running production lines producing the same products, the results of this study can have its applicability to those lines as well (Yin, 2018).
Findings and Analysis
This chapter presents the findings from the case company and presents the data from the methods and techniques that was used in this study. Further this chapter will outline the calculations and results from the used methods OEE and FOEE.
4.1 Process mapping
The process map was done to provide a better understanding over the production line and an overview of the different parts of it. The process map was created and designed based on how the authors Barbrow and Hartline (2015) has presented it. Where every shape and figure present what type of action that is done and the colours is to differentiate the actions from each other. Basically, the colour itself has no decided purpose rather than differentiating the figures and ease for the reader to see the differences between the actions and figures (Barbrow & Hartline, 2015).
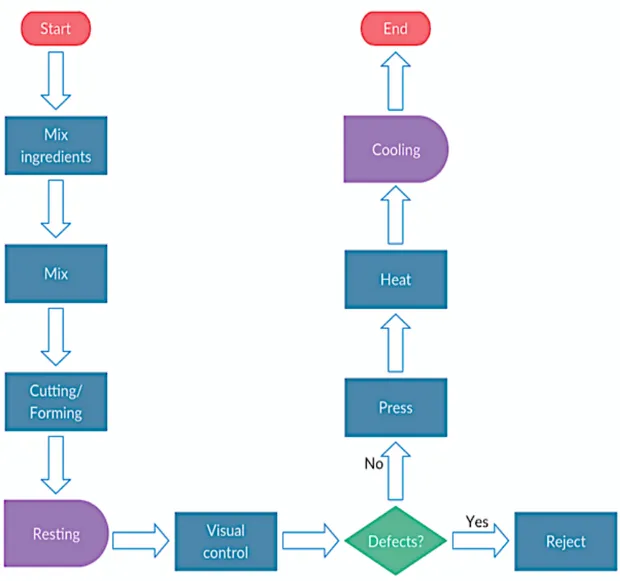
Figure 9 illustrates the steps in the actual The first step presents the action “start” which present the starting point of the production line. As shown in Figure 9 symbol for start is in the shape of an oval and has the colour red to differentiate it from the other figures as mentioned before. So, it is a symbol of which triggers an action which sets the process into movement. The second step of the line is the ingredients comes down from different pipes and mixes into a dough. When the dough is mixed completely it passes through a cutting/forming process which converts the dough into small buns. These steps are actions and have the shape of a rectangular in the process map. After the dough is cut and formed it rests for a set time. The resting is defined as a delay which is why it has a shape of a truncated capsule. After that there is a visual control where all the buns are checked through a scanner which rejects the doughs that are not in the correct shape. The defects step is a decision point where the machine takes a decision which is why it has a different shape. If the buns are not acceptable, they are rejected into a box, but if they are accepted, they become pressed and heated. Lastly, after being heated they are cooled in order to be packed and sealed. The end stage which is shaped the same as the starting point is because they both have the same purpose, start and stop of a process. That is where the production line ends (Barbrow & Hartline, 2015).
Figure 9 Flow chart over the baking process machine T4 (Barbrow & Hartline, 2015)
In order to improve the productivity of the production line it is important to understand the productions functionality and its process. Since productivity is defined as the ratio between input and output the process in between becomes crucial to understand. The case company DELTA is planning to increase their productivity by decreasing stoppages and breakdowns. As the productivity is becoming a crucial competitive factor the company must also improve their productivity in order to stay competitive in the market.
4.2 Observation
The first observation was done at the production line to see how it is operating in daily routines. The observation contributed to an understanding of the process and drawing a process map as shown in figure 8. It also eased the planning of the interviews as a prior knowledge lead to better formation of questions. The production facility and production process were observed and analysed, which is a crucial point for preparing the actual study. Hence it was important to understand how the plant is built, understanding the layout, different functions and its overall processes. During the observations the three different production lines were shown and explained.