CESIS Electronic Working Paper Series
Paper No. 337
The Influence of Diversity on the Formation, Survival and
Growth of New Firms
Mikaela Backman Janet Kohlhase
December, 2013
The Royal Institute of technology Centre of Excellence for Science and Innovation Studies (CESIS)
1
The Influence of Diversity on the Formation, Survival and Growth of New
Firms
Mikaela Backman1
Janet Kohlhase2
Abstract
Our paper investigates how diversity of the labor force influences the rate of new firm formation and the performance of new firms in urban areas. A diversified labor force within the firm and in the external environment influences the formation, survival and growth of firms. We explore these issues with both aggregate data at the municipal level and individual data at the firm level for the years 1993-2010. We measure diversity using entropy measures that account for a wider range of differences than is typically used. Our empirical analysis finds a positive influence of diversity of the labor force on the rate of new firm formation at the municipal level. At the level of an individual firm, we find that the diversity of the firm’s labor force is positively associated with the survival and growth of new firms. Our results add to the literature on the workings of agglomeration economies through variations in human capital, information spillovers and innovation.
Key words: diversity; labor force, education, occupation, industry, new firms; formation, survival, growth
JEL-codes: C31, C33, L25, L26, R10
1
Corresponding author, Centre of Excellence for Science and Innovation Studies (CESIS) Jönköping International Business School, P.O. Box 1026, SE-551 11, Jönköping, Sweden, Centre for Entrepreneurship and Spatial Economics (CEnSE), Royal Institute of Technology, Mikaela.Backman@jibs.hj.se.
2
2
1. Introduction
As the flow of individuals across country borders increases, women increase their participation in the labor force across many different sectors, and more elderly individuals stay in the labor force, firms and regions are bound to become more diverse in terms of their labor force. This is the starting point of our paper where the intention is to analyze the impact of diversity on new firm formation as well as the development of new firms in terms of survival and growth. The paper thereby contributes to the current discussions on the economic effects of a diverse labor force.
The role of new firms for economic thriving and development is hard to dispute since new firms contribute to employment growth, productivity growth, and innovations (Baumol 2002; van Praag and Versloot 2007). Benefits stretch beyond the firm itself. There are numerous studies focusing on how a diverse labor force in terms of the individual’s background, i.e. cultural diversity, influence new firm formation (Lee et al. 2004; Audretsch et al. 2010; Niebuhr 2010; Cheng and Li 2012). This paper adds to the existing literature by adding the role of labor force diversity in terms of education and occupation to the analysis of new firm formation. In addition, the diversity aspect is incorporated in the analysis of the survival and growth of new firms. The role of labor force diversity has been somewhat overlooked in previous studies analyzing firm performance. Those studies that have examined diversity and firm performance have mainly focused on racial diversity or the gender composition of the management team.
The empirical design is split in two parts. The first uses a regional approach where the effect of diversity (in terms of overall diversity, educational diversity, occupational diversity, share of immigrants, and industry diversity) on the rate of new firm formation is analysed. This is done to capture the effect of the external environment and how it effects the formation of new firms. In the next step diversity within the firm is analysed, i.e. the internal aspect is captured.
3
The focus is how diversity within the firm influences the probability of surviving and also the growth of these firms. The sample we analyse contains almost all new establishments in year 2001, approximately 63,000. The results show that diversity has a positive influence on the rate of new firm formation as well as on the survival and growth of new firms. Hence, a heterogeneous external as well as internal labor force is beneficial for the formation, survival and growth of new firms. These results give insights into factors which explain agglomeration forces. Larger locations tend to more diverse and can hence benefit from the positive effects from a diverse labor force.
The remainder of this paper covers the theoretical arguments for why diversity may influence new firm formation and firm performance (section 2). Section 3 covers the method and description of variables followed by the empirical results and analysis in section 4. Section 5 concludes the paper.
2. Diversity and entrepreneurship
Resources in different locations vary in their composition, dispersion, and turnover. Some sites are characterized by an abundance of important input factors such as labor, capital, information, financial resources, and material. It is not only the scale but also the scope of factors that matters. Norton (1992) finds three main reasons why multiplicity and richness of a specific economic milieu (agglomeration diversity) bring benefits to firms. A central location offers (1) a diversified supply of various producer services, (2) a regional network for information flows about new pro-duction techniques, products, customers, and suppliers, and (3) a large and differentiated supply of labor. Our paper focuses on the last reason. A diverse labor force can work as a signal of a milieu of creativity and openness which attracts human capital. The entry barrier may also be lower in these types of regions making it easier to attract able and talented individuals with
4
various backgrounds. In such a diverse environment innovation and new ideas may be promoted and valued, increasing the rate of new firm formation. A diverse labor force may also positively affect the rate of information exchange and flow facilitating innovation and start-ups (Lee, et al. 2004).
Jacobs (1961) argued that locations that are open and diverse have the ability to attract able individuals leading to a higher level of innovation and creativity, highly correlated with the births of new firms. Regional diversity in itself is also argued by Jacobs as fostering new firm formation and innovations. Even though new ideas are important to be able to create new firms, equally important are the recipients of new ideas. A diverse group of individuals in terms of individual characteristics (gender, age, and background) as well as inherited and learned abilities is more likely to value these ideas differently. Hence, the probability that some see the new ideas as profitable ventures and will act on this and start a new firm is increased. Desrochers (2001) strongly argues for the positive influence from diversity on start-ups since individuals of diverse background are capable of creating new and novel combinations of existing knowledge and technology that is manifested in new firms. The studies by Lee (2001) and Lee et al. (2004) support these hypotheses. The authors find a positive relationship between diversity and the level of regional innovativeness as reflected in measures such as patents (Lee 2001) and new firm formation (Lee, et al. 2004).
To have a diverse labor force in terms of the background of the individual, referred to as cultural diversity, can enhance the rate of new firm formation. Immigrants that are new in a country may be more prone to start a firm or become self-employed due to discrimination, lack of language proficiency and lack of networks and business contacts (Yoon 1997). They also may have a higher tendency to be risk takers. Immigrants might not have the business network but often have strong networks and ties within their ethnic groups, this ties and connections proved
5
helpful in providing further contacts and financial support for immigrants in Silicon Valley (Saxenian 2000). These aforementioned factors lie at the individual level but may also be translated to the regional level where the share of immigrants has been found to be positively associated with the rate of new firms formation (Reynolds et al. 1995; Saxenian 2000; Kirchhoff et al. 2002; Cheng and Li 2012). The authors emphasize the increased demand for more niched services and products as the labor force become more diverse (pull factors) as well as the lack of employment possibilities for immigrants (push factors).
New firm formations may also vary according to industry structure. Jacobs (1969) highlights the importance of knowledge spillovers but emphasizes sources of knowledge from outside the firm and its core industry. In this case, variety and diversity of closely located industries are important for enhancing a firm’s performance, so-called Jacobs’ externalities. A wider range of diversity in production activities as well as in skills and occupations in a location may foster more opportunities to find markets or customers. Again these forces may work to enhance new firm formation (Reynolds, et al. 1995). The first hypothesis tested in this paper focuses on the regional level where we examine if new firm formation is positively associated with a higher regional level of diversity. Diversity is measured through several dimensions such as industry diversity, share of immigrants and the diversity in the labor force in terms of age, gender, background, educational attainment and occupational profile.
Moving to the firm level, studies have found that firms with a diverse work force tend to perform better than firms facing more uniform work forces (Watson et al. 1993; Tallman and Li 1996; Richard 2000; Page 2007). A diverse work force with a variety of opinions has been found to form better-quality decisions. Thus, a heterogonous workforce may provide better decision-making and problem-solving through the use of a wider range of perspectives and a more critical analysis of issues (Jackson 1992).
6
The knowledge creation model by Berliant and Fujita (2008; 2009) focuses on agent heterogeneity. The authors state that knowledge creation is optimized when there is a balance between common and differentiated knowledge. Common knowledge is created when individuals meet over a long period and as the common knowledge is increased they become less productive. Similar, two individuals that are very heterogeneous can be less productive as they do not share a common knowledge base. The degree of suitability among individuals depends therefore on the level of common and exclusive knowledge. In terms of diversity these studies emphasize the heterogeneity in knowledge, embodied in individuals, in creating new and successful ideas. An employee’s ethnicity may serve as a proxy for her networks, affiliations, beliefs and perspectives. This as well as the experience of the individual gives insights into the differentiated knowledge embodied in the individual.
The perspective of intra-firm decision-making, problem solving and knowledge creation leads us to our second hypothesis where we examine if the survival and growth of new firms is positively associated with a higher degree of intra-firm labor force diversity. Diversity is measured through the diversity in the labor force in terms of age, gender, background, educational attainment and occupational profile.
3. Data, variables and empirical results
To empirically test the relationship between diversity and new firm formation, survival and growth, the empirical approach is divided into two parts. The first part investigates how regional diversity influences the rate of new firm formation at the municipal level using a fixed-effects model for the period 1993 to 2010. The independent variables in focus are entropy measures composed of the characteristics of the individuals in the region and share of immigrants. The second part of the empirical analysis uses firms as the unit of observation. Using a Heckman
7
selection model, the composition of the new firms’ labor forces are analyzed to see the impact on the firms’ survival and growth.
3.1 Regional level
The dataset used in the regional empirical estimation originates from Statistics Sweden and covers variables at the municipal level for the period 1993 to 2010.3 The new firm formation variable is constructed by Statistics Sweden and uses firm-level data aggregated to the municipal level. Only firms with economic activity are analyzed for each year, i.e. firms that report value-added taxes (VAT) and/or payroll taxes. A firm is registered as a new firm if a new organization number is identified and the majority of the employees are new, i.e. if they did not work in the firm before the organization number was changed.4 New firms that arise due to division of firms or mergers of already existing firms where the majority of employees are the same as previous years are not registered as new firms. Thus, spin-offs and/or mergers are registered as new firms given that they substantially change their composition of employees. By using these criteria only actual new active establishments given the employee composition are included in the sample. Meaning that, we are able to capture the level of entrepreneurship in the municipality.
The number of new firms is standardized by the number of individuals in the labor force following the labor market approach suggested by Audretch and Fritsch (1994).5 The labor market approach is justified by the fact that mostly individuals and not firms create new firms. And the new firms are often established close to the individuals’ residences (Mueller and Morgan 1962; Evans and Jovanovic 1989; Sorenson and Audia 2000).
3
The data set has restricted public access.
4
The two following conditions are met: (number of common employees year t and t+1)/(number of employees in t+1) <0.5 and (number of common employees year t and t+1)/(number of employees in t) <0.5
5
The ecological approach where the number of new firms is standardized by the total number of firms in a municipality has also been tested with similar results.
8
The explanatory variables describe the characteristics of the labor force in the municipality. We choose to measure diversity of the labor force using various entropy measures. Entropy measures have many features which makes them suitable for measuring firm diversity. One feature is the decomposable nature of the indexes and perhaps more important is the weighting structure. The weights in an entropy measure decrease in absolute terms as the share in a category increases. The entropy measure differs from the often used Herfindahl-index. A small increase in the number of individuals in the category that constitutes the majority makes a small difference for the entropy value while a small increase in an under-represented category increases the entropy value. A Herfindahl index would be more sensitive, and change in value, if there were a small change in the number of individuals in the largest category and not sensitive to the under-represented categories (Jacquemin and Berry 1979; Kwoka 1985). The entropy measure is also more responsive to changes within a given group than are other measures; the entropy measure grows higher as diversity increases given a fixed number of individuals (White 1982).
The same kind of weighting cannot be applied to more simple diversity measures where each category is entered as a variable in a regression. Nevertheless, another measure of regional diversity is the share of inhabitants born outside Sweden (Immigrants). This is included to capture the direct and isolated effect of immigrants in the economic environment and have been used in several studies. The entropy measures and immigrant variables are constructed using population registrar data aggregated to the municipal level.
The first variable of regional diversity takes into account the dimensions of gender, age, and ethnicity of the inhabitants. Individuals are separated into three age, two gender and two
9
ethnicity categories.6 An entropy measure (Theil index) is used to define the diversity and is presented in Equation 1:
∑
( ) (1)
where i represent the number of inhabitants, s represents the municipality and c represents the category that an individual can belong to depending on gender, age, and ethnicity. A more diversified municipality has a higher entropy value. The distribution of this entropy value ranges from zero to ( ).
Labor force diversity is also captured by the composition of the inhabitants’ educational profiles (Education diversity) and occupation profiles (Occupation diversity). Both are measured by summarizing what is termed “unrelated variety” and “related variety”. Unrelated variety is measured at a higher aggregation level and gives an indication of the variety of education or occupational orientation. It shows how a municipality is diversified in terms of different types of activities. Related variety is a weighted sum of entropy at a finer level of aggregation within each higher level aggregation, i.e. variety within education or occupational groups (Hackbart and Anderson 1975; Jacquemin and Berry 1979; Frenken et al. 2004; Frenken et al. 2007). The measurements of the unrelated (UV) and related variety (RV) are presented in Equations 2 and 3.
∑ ( ) (2)
∑ where ∑ ( ) (3)
where G is the number of educational/occupational categories at the higher aggregation level (two-digit), is the share of total employment at the higher level in the municipality s, is the number of education/occupation at the finer aggregation level (three-digit) and is the
6
10
employment share at the three-digit level i within each two-digit level. Due to the decomposable nature of the entropy measure the unrelated and related variety can be summed to form the total education or occupation diversity. The total diversity is then the weighted average diversification within each education/occupation category plus the diversification across education/occupation categories (Theil 1972; Jacquemin and Berry 1979). A higher value indicates more diversification.
Diversity can also be measured through the industrial structure of employment. The diversity of the municipal industrial structure is represented by the sum of the two entropy measures: unrelated and related variety (Industry diversity) described in Equation 2 and 3. Unrelated variety is measured at the two-digit SIC code level and related variety is a weighted sum of entropy at the five-digit level within each two-digit industry.
New firms may arise in environments that are booming and/or already have a large demand and this is captured by including variables that measure the change in demand (∆demand) and the economic size (Size) of the municipality (Armington and Acs 2002; Sutaria and Hicks 2004a; van Stel and Suddle 2008). The intensity of human capital—the share of highly educated individuals—may foster knowledge spillovers and can be used as valuable inputs by new firms (Johansson and Wigren 1996; Malmberg et al. 1996; Malmberg and Maskell 1997; Parker 2004; Karlsson and Backman 2011). The human capital variable is however highly correlated with the size variable and is therefore not included in the regression analysis. Another labor market factor is the unemployment rate (Unemployment rate) that can have an ambiguous effect on new firm rate formation. It can work as a pull factor since the individual does not have another occupation. It can however also work as a push factor since a high rate of unemployment indicate that the economy is suffering and might have a lower demand and market potential (Binks and Jennings 1986; Audretsch et al. 2001; Parker 2004; Sutaria and Hicks 2004b). The
11
industrial structure in a municipality affects the new firm formation rate where locations with on average larger firms, in terms of number of employees, (MES) have a hampering effect. A larger number of small establishments can also be an indicator of diversification, following Reynolds et al. (1995). Local competition (Firms per capita) might work as a growth stimulus since local it fosters innovation and information spillovers. Further, an increase in the number of firms given the population should facilitate knowledge spillovers (Porter 1990; Ciccone and Hall 1996). Table 1 gives a short description of the chosen variables and summary statistics at the regional level, where we have a total of 4760 observations (17 years for each of 280 municipalities). There are currently 290 municipalities in Sweden but due to changes over time only 280 municipalities can be traced over the chosen time period.
Table 1 Description of variables and summary statistics, regional level (N = 4760, n = 280 cities)
Indicator Description Exp.
Sign
Mean St.dev
Dependent variable
Number of new firms standardized by the number of individuals in the labour force,
in municipality s at time t 0.012 0.004
Independent variable Labor force
diversity
Entropy measure, based on age, gender and origin
(equation 1) + 2.073 0.121
Education diversity
Entropy measure, unrelated and related varieties of
education at municipal level (equations 2 and 3) + 3.845 0.325
Occupation diversity
Entropy measure, unrelated and related varieties of
occupation at municipal level (equations 2 and 3) + 3.699 0.148
Immigrants Share of inhabitants born outside Sweden + 0.137 0.074
Industry diversity
Sum of unrelated and related variety of industries
(equations 2 and 3) + 3.906 0.674
∆demand Annual change in the sum of the inhabitants’ wages, in
million SEKa + 139.79 869.79
Size Access to wages, in thousand SEKb + 1.35e7 2.13e7
Unemployment rate
Unemployment rate, proportion of labour force
registered as unemployed +/- 0.046 0.022
MES Mean establishment size (# employees) - 7.171 2.232
Firm per capita Number of firms divided by the population + 0.062 0.020
a Calculated as the wages that the inhabitants that live in the municipality earn.
b Calculated as the accessibility to wages (what the inhabitants that live in each municipality earn). The accessibility measure is compiled by the intra-municipal, inter-regional and extra-regional accessibility to wages accounting for
12
distance decay effects, following Johansson et al. (2002; 2003). Thus, accessibility to wages is intended to capture the market potential in each location.
A robust Hausman test favors the fixed effects over the random effects model. The variables show however low variance over time (less than 5%) compared to the between-variance over municipalities. Hence, these variables are semi-fixed. In such circumstances, fixed effects models can work poorly: inefficient parameter estimates for the semi-fixed variables with large standard errors (Cameron and Trivedi 2009). Hence, the fixed effects capture most of the effect since there is limited variation over time. Given this, a random effects model is also estimated.7 Since the fixed effect model captures variation over time for each municipality it can be considered as capturing the short or medium run (considering the time-period). The random effects estimation, on the other hand, captures the long run effects as it captures variation across municipalities (Durlauf and Quah 1999; Rodríguez-Pose and Tselios 2012). In this setting the models are not substitutes but rather complements.
We tested for spatial autocorrelation, and found none. Using Pesaran and Friedman’s test of cross-sectional dependence, we did not reject the null hypotheses of cross-sectional independence (De Hoyos and Sarafidis 2006). Table 2 presents the estimation with the Labor
force diversity, Education diversity measure and Industry diversity with all control variables. For
robustness checks, the other diversity measures are presented in Table 3. In Table 3 only the diversity variables are presented while the control variables are suppressed; the signs and significance of the control variables are however robust across the different estimations. The separation is motivated by the high correlation between the labor force diversity measure and the
7 While comparing the pooled OLS and random-effects models, the null hypothesis of no variance across municipality in the Breusch-Pagan Lagrange multiplier test was rejected. Hence, the test works in favor of the random-effects model.
13
share of immigrants in a municipality. The occupation diversity is estimated separately due to data restriction, this variable is only registered from 2002 to 2010.
As a robustness test we used an instrument variable approach where the share of immigrants in 1990 was used as an instrument for the share of immigrants and overall diversity (Labor force diversity) over the time period. The results are similar and not significantly different from the results presented in Table 2 and 3. The validity of the instrument is driven from policy reasons. In 1991 the government changed the rules allowing immigrants to settle wherever they wanted; before this change immigrants were allocated by the government to different municipalities. Thus, the share of immigrants in 1990 should be exogenous. The relevance condition is verified by significant results in the first-stage equation and by high F-values (all are above 10) meaning that the null hypothesis of weak instruments can be rejected.
14
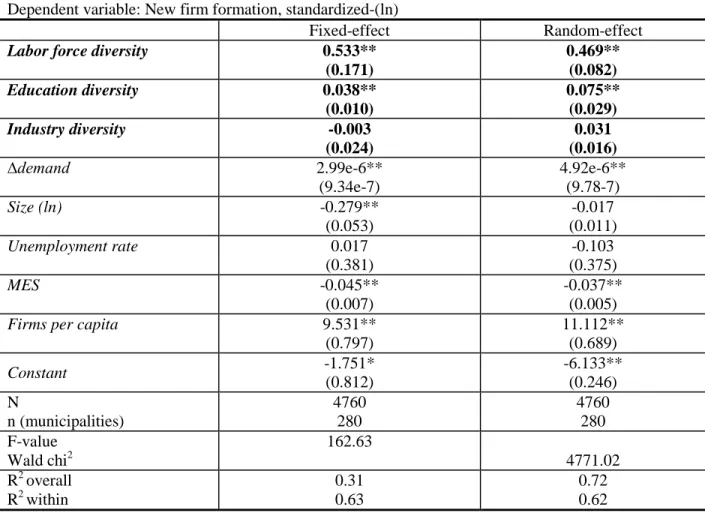
Table 2 Diversity and new firm formation, regional level, fixed- and random- effects Dependent variable: New firm formation, standardized-(ln)
Fixed-effect Random-effect
Labor force diversity 0.533**
(0.171) 0.469** (0.082) Education diversity 0.038** (0.010) 0.075** (0.029) Industry diversity -0.003 (0.024) 0.031 (0.016) ∆demand 2.99e-6** (9.34e-7) 4.92e-6** (9.78-7) Size (ln) -0.279** (0.053) -0.017 (0.011) Unemployment rate 0.017 (0.381) -0.103 (0.375) MES -0.045** (0.007) -0.037** (0.005)
Firms per capita 9.531**
(0.797) 11.112** (0.689) Constant -1.751* (0.812) -6.133** (0.246) N n (municipalities) 4760 280 4760 280 F-value Wald chi2 162.63 4771.02 R2 overall R2 within 0.31 0.63 0.72 0.62
Notes: ** significant at one per cent, * significant at five per cent. Standard errors in parentheses, clustered at the municipality-level. The estimations include year dummies.
Table 3 Robustness check, alternate diversity measures and new firm formation, regional level, fixed- and random- effects
Dependent variable: New firm formation, standardized-(ln)
Fixed-effect Random-effect Occupation diversity 0.076 (0.105) -0.050 (0.042) Immigrants 0.393 (0.219) 0.421** (0.102)
Notes: ** significant at one per cent, * significant at five per cent. Standard errors in parentheses, clustered at the municipality-level. Each of the variables capturing the diversity of the municipality;
Occupation diversity and Immigrants are estimated separately. The estimations include the same
regressors as in Table 2 plus year dummies in the case of Immigrants. For Occupation diversity the
Industry diversity is dropped due to high bivariate correlation. In addition, in the case of Occupation diversity only the years 2002 to 2010 can be used due to data restriction.
The results confirm a positive relationship between diversity in a municipality and the new firm formation rate at the municipal level, confirming the first hypothesis. In the next step
15
we will examine the different measures of diversity and how they influence the rate of new firm formation. The overall diversity of the inhabitants in the municipality in terms of age, gender and background, and the educational diversity have a positive effect on new firm formation. These results are robust across different estimation methods, i.e. fixed- and random-effects model.
The share of immigrants positively influences the rate of new firms, but only in the random effects model. It is insignificant in the fixed effects model. The lack of significance in the fixed effects model is most likely caused by the low variance over time in this variable. Compared to the other diversity measures the immigrants share has half the variance over time. The positive influence on new firm formation confirms other studies examining cultural diversity (Audretsch, et al. 2010; Niebuhr 2010; Cheng and Li 2012). The industry diversity, used to capture Jacobs externalities (where knowledge spillovers emerge from outside a firm’s core industry and enhance a firm’s performance or enhance the conditions for new firm formation) is insignificant. Hence, the industrial diversity tends to be less important when creating favourable conditions for new firms. In addition, since there is no information regarding each new firm and which core sector it belongs to and in which municipalities some sectors are over-represented, the variable might not fully capture the extent of knowledge spillovers. The variable capturing diversity in terms of occupational categories is also insignificant. The occupation diversity is only measured for 2002 to 2010 (due to data restrictions) but it is not the time period as such that is driving the results. The other diversity variables, Labor force diversity, Education diversity, and
Immigrants, are positive and significant when estimated for the same period. Thus, the
occupational diversity as such does not seem to create beneficial conditions for new firm formation. Looking at the magnitude of the diversity measure by measuring the elasticities we observe that the overall diversity (Labor force diversity) has the largest influence followed by the
16
Education diversity, and last Immigrants.8 The elasticity of the overall diversity is approximately 0.25 whereas the elasticity of the Education diversity, and Immigrants ranges around 0.01 to 0.03. hence, the overall level of diversity has the strongest influence on new firm formation among the diversity measures.
All in all, the results highlight the benefits of having a diverse set of inhabitants in terms of background, age (experience), gender and education in terms of new firm formation. These relationships work through many channels. First, a more heterogeneous set of inhabitants may create an economic environment where ideas are created and transmitted. Second, a diverse population may create a tolerant atmosphere attractive to innovative and human capital-rich individuals. Third, the probability that any individual will see an economic opportunity as a profitable venture may increase if a region is comprised of many different set of individuals. Fourth, by having a more diverse population more economic opportunities for niched services and products may be produced.
The control variables follow the normal expectations where an increase in demand and the number of firms per capita increases new firm formation. The mean establishments size decreases the rate of new firm formation. The only unexpected result is the negative influence of the size variable. The result has been found in previous studies on Swedish new firm formation (Andersson and Koster 2011). The result may be driven by the fact that the rate of new firm formation is high in many small municipalities in the north of Sweden. The correlation between the size and overall diversity is approximately 0.60 (the highest bivariate correlation among the variables in the estimations) meaning that larger locations also tend to have a higher degree of diversity.
17
3.2 Firm level
The dataset used at the firm level also originates from Statistics Sweden and has restricted access. The dataset is built on employee-employer matched data where there is detailed information about the firm as well as the employees of the firm. New firms are defined as those with a new organization number and a new set of employees following the same definition as Statistics Sweden explained in the previous section. The firms are identified in 2001 and followed over three years (to 2004), five years (to 2006) and nine years (to 2010).
We analyze the growth of firms in terms of the number of employees using the framework of a two-step Heckman selection model. The two-stage estimation procedure explicitly accounts for the problem of selection bias (Heckman 1979). If sample selection exists but is ignored, OLS regression estimates will be biased and inconsistent. In our analysis the selection occurs if the firm has survived over the analyzed time period. The selection equation indicates that the growth of firms is only present for those firms that survive. Thus, the selection bias is used and modeled in estimating the outcome equation, i.e. in the growth equation. By including information about a firm’s survival in the outcome model, we correct for the selection bias in the estimation.
Diversity is often measured only using ethnicity of employees (Yoon 1997; Lee 2001). By adding more variables that measure the within-firm diversity, our framework allows a richer analysis to be performed leading to new knowledge about the influence of diversity. Diversity can also be thought of as differences in age, gender, education or occupation structures.
The overall (within) firm diversity is measured by an entropy measure (Theil index), presented in Equation 4, following the same structure as the overall diversity in the municipality presented see Equation 1. The gender, age, and ethnicity of the employees are taken into account where individuals are separated into three age, two gender and two ethnicity categories:9
9
18
∑ ( ) (4)
where e represents the number of employees, i represent the firm and c represents the category that an individual can belong to depending on gender, age, and ethnicity. A more diversified work place has a higher entropy value. The work force diversity within a firm can also be thought of in the dimension of education (Education diversity) and occupation (Occupation diversity). Educational and occupation diversity is also measured through an entropy measure, presented in Equations 2 and 3, but is here measured at the firm instead of the municipal level. Another measure of firm diversity captures the background of the individual employee (Immigrants) and is measured as the share of employees with a foreign background.
The initial size of the firm is likely to influence the survival and growth of a firm (Size). In order to allow for nonlinear effects, a quadratic term is included (Size2). The initial size has been used in many studies (Simon and Bonini 1958; Hymer and Pashigian 1962; Singh and Whittington 1975; Hall 1987; Petrunia 2008; Teruel-Carrizosa 2010). The knowledge and skills of the employees in the firm are measured through the share of employees within the firm with a bachelor degree or more (education), and by their accumulated experience (experience) (Davis et al. 1996; Andersson and Noseleit 2011). We further control for industry by adding an industry dummy (Industry). The economic environment is captured at the municipal level and includes the same variables used in regional empirical context (see Table 1) plus one capturing the specialization level at the two-digit SIC level. To capture the local clustering of new firms (Local
new firm formation), the number of new firms divided by the total number of firms measured at
the SAMS level (Small Areas for Market Statistics) are used. There are approximately 9200 SAMS in Sweden, compared to 290 municipalities, and they roughly have 1000 inhabitants.
19
Thus, the geographical size differs. All explanatory variables are from 2001, the starting period in our analysis. Table 4 gives an overview of the firm-level variables and summary statistics.
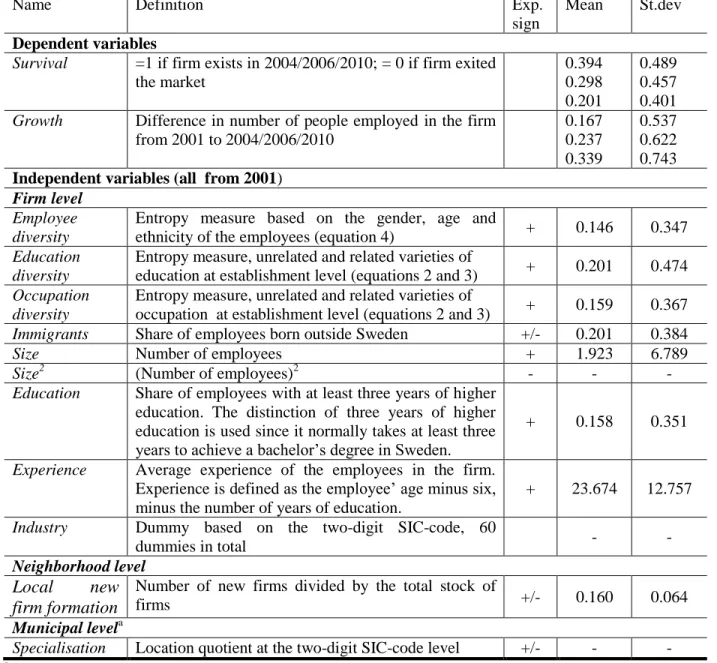
Table 4. Description of variables and summary statistics, firm level (N=61,973)
Name Definition Exp.
sign
Mean St.dev
Dependent variables
Survival =1 if firm exists in 2004/2006/2010; = 0 if firm exited the market 0.394 0.298 0.201 0.489 0.457 0.401
Growth Difference in number of people employed in the firm from 2001 to 2004/2006/2010 0.167 0.237 0.339 0.537 0.622 0.743
Independent variables (all from 2001)
Firm level
Employee diversity
Entropy measure based on the gender, age and
ethnicity of the employees (equation 4) + 0.146 0.347
Education diversity
Entropy measure, unrelated and related varieties of
education at establishment level (equations 2 and 3) + 0.201 0.474
Occupation diversity
Entropy measure, unrelated and related varieties of
occupation at establishment level (equations 2 and 3) + 0.159 0.367
Immigrants Share of employees born outside Sweden +/- 0.201 0.384
Size Number of employees + 1.923 6.789
Size2 (Number of employees)2 - - -
Education Share of employees with at least three years of higher education. The distinction of three years of higher education is used since it normally takes at least three years to achieve a bachelor’s degree in Sweden.
+ 0.158 0.351
Experience Average experience of the employees in the firm. Experience is defined as the employee’ age minus six, minus the number of years of education.
+ 23.674 12.757
Industry Dummy based on the two-digit SIC-code, 60
dummies in total - -
Neighborhood level
Local new
firm formation
Number of new firms divided by the total stock of
firms +/- 0.160 0.064
Municipal levela
Specialisation Location quotient at the two-digit SIC-code level +/- - -
a The estimations also include the variables from Table 1 but are not reported here
The following table shows the relationship between diversity within and outside the firm for firm survival and growth. A two-step Heckman selection model is used for the three different changes, from 2001 to the years 2004, 2006 and 2010. By looking at the number of observations,
20
censored and uncensored observations we observe that the total sample is slightly less than 62,000 firms. Hence, there were about 62,000 firms in 2001 that were classified as being new. Out of these 24,409 (39%) new firms survive in the very short term, 2001 to 2004. The number of new firms that survive in the short term, 2001 to 2006, is 18 478 (30%) and 12 457 (20%) firms survive over the medium term, 2001 to 2010.
By using firms as the unit of observation it is not possible to test for spatial covariance since we do not have the exact location of each firm. Hence, we cannot construct a weight matrix. The spatial dependence between municipalities is however reduced by using a market potential measure (Size) where the influence from surrounding locations is incorporated by using an accessibility measure (Andersson and Gråsjö 2009).
21
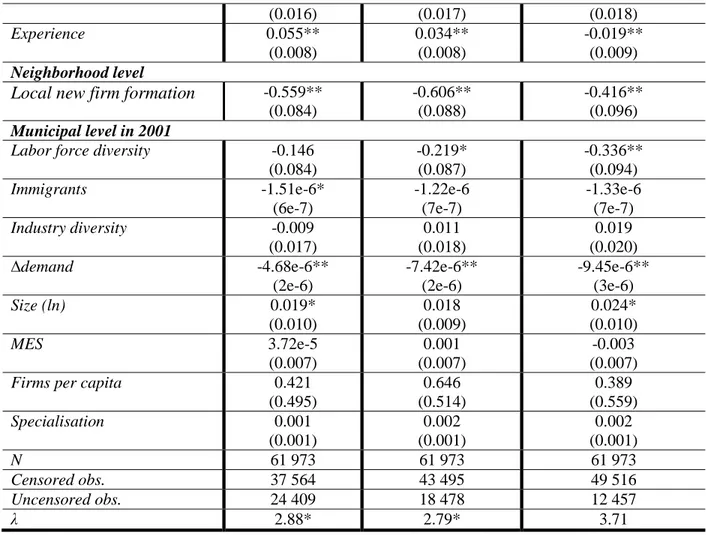
Table 5. Influence of diversity on the survival and growth of new firms, 2001, Heckman selection
Variable 2001 to 2004 2001 to 2006 2001 to 2010
Dependent variable: ∆employment between 2001 and 2004/2006/2010
Firm level in 2001 Employee diversity 0.740* (0.340) 0.797* (0.394) 1.202 (0.699) Immigrants -0.276* (0.110) -0.347* (0.151) -0.499 (0.277) Size 0.008 (0.006) 0.010 (0.006) 0.017 (0.015) Size2 -3.74e-5 (3e-5) -4.00e-5 (3e-5) -5.87e-5 (5e-5) Education 0.010 (0.049) 0.011 (0.053) 0.014 (0.078) Experience (ln) 0.021 (0.047) -0.045 (0.037) -0.205** (0.049) Neighborhood level
Local new firm formation -1.316**
(0.479) -1.557** (0.576) -1.755** (0.732) Municipal level in 2001
Labor force diversity -0.349
(0.256) -0.491 (0.307) -0.957 (0.618) Immigrants -2.74e-6 (2e-6) -2.45e-6 (2e-6) -4.14e-6 (3e-6) Industry diversity 0.001 (0.049) 0.063 (0.053) 0.087 (0.083) ∆demand -1.09e-5 (7e-6) -1.68e-5 (9e-6) -2.65e-5 (2e-5) Size (ln) 0.038 (0.029) 0.036 (0.031) 0.066 (0.053) MES 0.004 (0.019) 0.013 (0.020) 0.011 (0.030)
Firms per capita 0.633
(1.432) 1.201 (1.573) 1.150 (2.317) Specialisation 0.005 (0.004) 0.006 (0.004) 0.007 (0.006) Dependent variable: dummy variable 1=if the firm existed in 2004/2006/2010, 0 = exited the market
Firm level in 2001 Employee diversity 0.470** (0.019) 0.467** (0.019) 0.468** (0.020) Immigrants -0.132** (0.015) -0.163** (0.015) -0.173** (0.017) Size 0.010** (0.002) 0.012** (0.002) 0.013** (0.002) Size2 -3.65e-5** (8e-6) -3.87e-5** (8e-5) -4.19e-5** (7e-6) Education 0.022 0.024 0.015
22 (0.016) (0.017) (0.018) Experience 0.055** (0.008) 0.034** (0.008) -0.019** (0.009) Neighborhood level
Local new firm formation -0.559**
(0.084) -0.606** (0.088) -0.416** (0.096) Municipal level in 2001
Labor force diversity -0.146
(0.084) -0.219* (0.087) -0.336** (0.094) Immigrants -1.51e-6* (6e-7) -1.22e-6 (7e-7) -1.33e-6 (7e-7) Industry diversity -0.009 (0.017) 0.011 (0.018) 0.019 (0.020) ∆demand -4.68e-6** (2e-6) -7.42e-6** (2e-6) -9.45e-6** (3e-6) Size (ln) 0.019* (0.010) 0.018 (0.009) 0.024* (0.010) MES 3.72e-5 (0.007) 0.001 (0.007) -0.003 (0.007)
Firms per capita 0.421
(0.495) 0.646 (0.514) 0.389 (0.559) Specialisation 0.001 (0.001) 0.002 (0.001) 0.002 (0.001) N 61 973 61 973 61 973 Censored obs. 37 564 43 495 49 516 Uncensored obs. 24 409 18 478 12 457 λ 2.88* 2.79* 3.71
Notes: ** denotes statistical significance at the 1-percent level, * at the 5-percent level. Standard errors in parentheses. The regression models also include industry-dummies. The size variables have been centered to avoid the problem of multicollinearity (Smith and Sasaki 1979).
Table 6. Robustness check, different measures of firm diversity and their influence on firm survival and growth, new firms in 2001, Heckman selection
Variable 2001 to 2004 2001 to 2006 2001 to 2010
Dependent variable: ∆employment between 2001 and 2004/2006/2010
Education diversity 0.530* (0.228) 0.456* (0.189) 0.502 (0.296) Occupational diversity 0.489* (0.230) 0.599* (0.282) 0.656 (0.351) Dependent variable: dummy variable 1=if the firm existed in 2004/2006/2010, 0 = exited the market
Education diversity 0.402** (0.016) 0.405** (0.016) 0.413** (0.016) Occupational diversity 0.358** (0.022) 0.347** (0.022) 0.352** (0.022)
Notes: ** denotes statistical significance at the 1-percent level, * at the 5-percent level. Standard errors in parentheses. The same regressors excluding Employee diversity as in Table 5 (except for the regressor
Education when estimating the effect from the Education diversity variable) have been used and they are
23
The motivation for using a Heckman model is supported by the significant Heckman’s lambdas in the different estimations (in the case of the medium term estimation, 2001 to 2010, the lambda is significant at the eight percent level). The significant lambdas indicate that there is a selection bias since the error terms are correlated across the different estimations (the output and selection model). OLS estimates would be inconsistent.
We start by analyzing how diversity influences firm growth (in terms of number of employees). The diversity measures (Employee diversity, Education diversity and Occupation
diversity) have a positive influence on the growth of firms for the very short term (three years
from 2001 to 2004) and the short term (five years, from 2001 to 2006). For the medium term (nine years, from 2001 to 2010) none of the diversity measures show any significant influence on the growth of firms. One possible explanation is that when individuals have worked longer together their common knowledge becomes larger and crowds out the individual diversified knowledge. As this happens the productivity of the group may decrease, supporting the theoretical reasoning in Berliant and Fujita (2008; 2009).
Overall we find the same influence from the diversity measures on the survival of firms as in the case of the growth of firms. The diversity measures (Employee diversity, Education
diversity and Occupation diversity) positively influence the probability to survive. In the case of
survival, the diversity measures increase the probability to survive even in the medium term (nine year period, 2001 to 2010). Hence, our results confirm previous studies that diversity is beneficial for firm performance (Jackson 1992; Watson, et al. 1993; Tallman and Li 1996; Richard 2000; Page 2007). Hence, firms with more diverse employees, whether it is in the composition of age, gender and background or the educational or occupational structure increases the likelihood to survive as well as the firm growth. A diverse set of individuals (in all the above mentioned aspects) is more likely to bring in different set of knowledge and skills through their
24
differentiated experience and education. Hence, the knowledge base and knowledge creation is likely to be larger, compared to a more homogenous firm, positively influencing the status and performance of the firm.
Even though the overall diversity measure, Employee diversity, incorporated the background of the individual it is also interesting to observe the isolated effect from different variables. In this paper we focus on the share of immigrants as this aspect is common when talking about the diversity of individuals. We have also tested the share of females (negative and significant); these results are available on request. The share of immigrants has a negative influence on the growth of firms (for the very short and short term). Further, having a larger share of immigrants decreases the probability to survive regardless of the studied time period. These results might be driven by language difficulties, less knowledge about the business climate, less access to business networks or pure discrimination in terms of customers-response and access to financial capital. Most previous studies have focused on the management level where immigrants tend to increase firm performance, especially in the US.
Comparing the magnitude of the estimates by calculating elasticities of growth with respect to the independent variables, we observe that the elasticities for the different diversity measures are very similar. Typically they range from -0.01 to 0.05 where the overall employee diversity and education diversity show the largest elasticities and the elasticities with respect to the share of immigrants are the lowest.
The estimations have been performed on new firms in 2001; and we have performed several robustness checks. The same estimations have also been performed using the whole sample of firms and the already existing firms in 2001. The results differ for the already existing firms in terms of the diversity measures where the firm diversity negatively influences the firm
25
growth and the share of immigrants and the municipal diversity has a positive influence on firm growth. For firm survival the results are robust. These results are available on request.
These results are for all new firms of various sizes. The diversity can of course have different impact across different size categories. For example, the influence of diversity in firms with only one employee is for natural reasons not present. The results from Table 5 and 6 holds for firms with two to ten employees while the influence from the diversity variable is lower or insignificant for firms with more than ten employees.
The only control variable in the growth equation that is significant is the level of new firms at the neighborhood level. This variable negatively influences the growth of firms irrespective of the studied time period. We interpret this variable as capturing the very local competition level, in the neighborhood. When the competition is fierce measured through the level of new firm formation in the same location, the new firms that survive may be less likely to grow. It is interesting to see that these local agglomeration forces do not tend to exist for new firms in terms of their ability to grow. This might be driven by the reduced level in demand for the new firm. New firms, compared to the existing firms, are perhaps more sensitive to changes in demand and level of competition since they have not been able to build up a network of customers, suppliers and are therefore more vulnerable. Firms in different industries face different growth opportunities and ambition which are not captured in this measure.
Turning to the selection equation, whether the firms survive or not, more variables are found to influence the probability of surviving. All variables at the firm and neighborhood level show the same impact over the three different time periods. Larger firms tend to have a higher probability of surviving, even though the effect is marginally decreasing. Firms with more accumulated experience e.g. have older employees overall, has a higher probability of surviving in the very short term and in the short term. In the medium term the effect is actually negative,
26
and decreases the probability of surviving. As in the case of firm growth, the level of local new firm formation has a negative influence on the probability of surviving. In more competitive environments fewer firms are likely to survive. At the municipal level there is some inconsistency in our findings on how different variables influence the probability of surviving over different time periods. Firms located in regions with a high level of overall diversity (in terms of age, gender and background) have a lower probability of surviving in the short and medium term. The share of immigrants however, only lowers the probability of surviving in the very short term. These two variables may also capture the competition level but in this case at the municipal level. Regions with a heterogeneous population foster new firm formation, increasing the level of competition which may make it harder for the firms to survive. The change in demand negatively influences the survival of firms across all time frames. The size variable on the other hand has a positive impact in the very short term and in the medium term. These results imply that large locations are favorable for firm surviving, perhaps because they offer a larger market. The municipalities that are growing fast on the other hand decrease the probability of surviving. Hence, there is a difference in the influence from size in terms of level and growth effect.
4. Conclusions
As more countries and regions become increasingly integrated, the flow of capital, products and most importantly, individuals, will increase. At the same time, a larger share of women is entering occupations and industries that previously have been male dominated. In addition, older individuals are engaged in the labor market and work longer. All these factors combined lead to regional economic environments with a more heterogeneous population. This paper analyses the effect from diversity within firms, in terms of employees, and in the external environment, in term of the inhabitants, effect the formation, survival and growth of new firms in Sweden. New
27
firms are suitable to analyze since new firms are likely to mirror the capacity of the population to value and assess new ideas as profitable ventures--and these ideas are realized in the birth of new firms. The focus on diversity and new firms also adds knowledge to the existing literature which normally focuses on more limited measures of diversity than we use here. Concomitant with our in-depth measures of diversity is our ability to examine issues at the firm level. Using a restricted data set allows us to analyze each firm’s internal labor force. We are able to examine the extent to which employee diversity affects the probability of a firm’s survival and its growth.
Our empirical work is divided in two parts. The first part focuses on the regional level. We investigate how diversity in terms of overall diversity, educational diversity, occupational diversity, share of immigrants, and industry diversity influence the rate of new firm formation at the municipal level for the period 1993 to 2010. The results confirm a positive relationship between a diverse set of inhabitants in terms of background, age (experience), gender and education in a municipality and the new firm formation rate.
The second part of the empirical analysis uses new firms as the unit of observation. Here we examine how work-force diversity in terms of age, gender, background, education and occupation influences the probability of survival and growth. The firm-level results show that diversity has a positive influence on the rate of new firm formation as well as on the survival and growth of new firms. Thus, we can conclude that having access to a diverse set of individuals, both in the local urban economy and within the firm itself is beneficial to firms’ economic outcomes. Individuals with different backgrounds, age, gender, experience and knowledge may view economic opportunities and new ideas differently. Hence, it is more likely that one individual views a new idea as a base for a profitable firm. Within the firm, different sets of individuals may bring differentiated knowledge that increases the total amount of knowledge within the firm and also speeds up the production of knowledge.
28
The results in this paper also bring some insight into the positive benefits of agglomeration forces. Overall, we have a larger diversity in denser and larger cities. The diversity in itself in these regions contribute positive to firm formation, survival and growth that is positive for the whole region. These diverse regions become incubators for new firms. Even though we imply a positive effect from diversity on the formation, survival and growth of new firms, diversity might not be the answer or key to everything. It is important to recognize that too much diversity might not be beneficial for firm performance as there is no common ground (knowledge) to stand on and use as a starting point.
To further explore the role of diversity on firm behavior, researchers could compare existing firms with new firms and examine the differences and similarities. Different sets of sectors and regions could be explored since the conditions for the formation, survival and growth of firms may differ across space and type of industry.
29
References
Andersson, M., and Gråsjö, U. (2009). Spatial dependence and the representation of space in empirical models. Annals of Regional Science, 43(1), 159-180.
Andersson, M., and Koster, S. (2011). Sources of persistence in regional start-up rates—evidence from Sweden. Journal of Economic Geography, 11(1), 179-201.
Andersson, M., and Noseleit, F. (2011). Start-ups and employment dynamics within and across sectors. Small Business Economics, 36(4), 461-483.
Armington, C., and Acs, Z. J. (2002). The Determinants of Regional Variation in New Firm Formation. Regional Studies, 36(1), 33 - 45.
Audretsch, D., Dohse, D., and Niebuhr, A. (2010). Cultural diversity and entrepreneurship: a regional analysis for Germany. The Annals of Regional Science, 45(1), 55-85.
Audretsch, D. B., Carree, M. A., and Thurik, A. R. (2001). Does Entrepreneurship Reduce Unemployment? : Tinbergen Institute Discussion Paper Series TI 2001–074/3.
Audretsch, D. B., and Fritsch, M. (1994). On the measurement of Entry Rates. Empirica, 21(1), 105-113.
Baumol, W. J. (2002). The Free-market Innovation Machine: Analyzing the Growth Miracle of
Capitalism. Princeton: Princeton University Press.
Berliant, M., and Fujita, M. (2008). Knowledge creation as a square dance on the Hilbert cube.
International Economic Review, 49(4), 1251-1295.
Berliant, M., and Fujita, M. (2009). Dynamics of knowledge creation and transfer: The two person case. International Journal of Economic Theory, 5(2), 155-179.
Binks, M., and Jennings, A. (1986). Small firms as a source of economic rejuvenation. In J. Curran, J. Stanworth and D. Watkins (Eds.), The Survival of the Small Firm Vol. 1: The
Economics of Survival and Entrepreneurship (pp. 19-37). Aldershot, UK: Gower.
Cameron, A. C., and Trivedi, P. K. (2009). Microeconomics Using STATA. Revised Edition. Texas: Stata Press.
Cheng, S., and Li, H. (2012). New firm formation facing cultural and racial diversity. Papers in
Regional Science, 91(4), 759-774.
Ciccone, A., and Hall, R. E. (1996). Productivity and the Density of Economic Activity.
American Economic Review, 86(1), 54-70.
Davis, S. J., Haltiwanger, J., and Schuh, S. (1996). Small business and job creation: Dissecting the myth and reassessing the facts. Small Business Economics, 8(4), 297-315.
De Hoyos, R. E., and Sarafidis, V. (2006). Testing for cross-sectional dependence in panel-data models. The Stata Jornal, 6(4), 482-496.
Desrochers, P. (2001). Local Diversity, Human Creativity, and Technological Innovation.
Growth and Change, 32(3), 369-394.
Durlauf, S. N., and Quah, D. T. (1999). The new empirics of economic growth. In T. J. B. and W. M (Eds.), Handbook of Macroeconomics (Vol. 1, pp. 235-308). Amsterdam: Elsevier. Evans, D. S., and Jovanovic, B. (1989). An Estimated Model of Entrepreneurial Choice under
Liquidity Constraints. Journal of Political Economy, 97(4), 808-827.
Frenken, K., Van Oort, F., and Verburg, T. (2007). Related Variety, Unrelated Variety and Regional Economic Growth. Regional Studies, 41(5), 685-697.
Frenken, K., Van Oort, F., Verburg, T., and Boschma, R. A. (2004). Variety and Regional Economic Growth in the Netherlands (Vol. December). Utrecht: Utrecht University, Section of Economic Geography, Papers in Evolutionary Economic Geography (PEEG) No 0502.
30
Hackbart, M. M., and Anderson, D. A. (1975). On Measuring Economic Diversification. Land
Economics, 51(4), 374-378.
Hall, B. (1987). The Relationship between Firm Size and Firm Growth in the US Manufacturing Sector. Journal of Industrial Economics, 35, 583-606.
Heckman, J. J. (1979). Sample Selection Bias as a Specification Error. Econometrica, 47(1), 153-161.
Hymer, S., and Pashigian, P. (1962). Firm Size and Rate of Growth. Journal of Political
Economy, 70(6), 556-569.
Jackson, S. (1992). Consequences of group composition for the interpersonal dynamics of strategic issue processing. Advances in Strategic Management: A Research Annual, 8, 345-382.
Jacobs, J. (1961). The Death and Life of Great American Cities. New York, NY: Random House. Jacobs, J. (1969). The Economy of Cities. New York, NY: Random House
Jacquemin, A. P., and Berry, C. H. (1979). Entropy Measure of Diversification and Corporate Growth. Journal of Industrial Economics, 27(4), 359-369.
Johansson, B., Klaesson, J., and Olsson, M. (2002). Time distances and labor market integration.
Papers in Regional Science, 81(3), 305-327.
Johansson, B., Klaesson, J., and Olsson, M. (2003). Commuters’ non-linear response to time distances. Journal of Geographical Systems, 5(3), 315-329.
Johansson, B., and Wigren, R. (1996). Production Milieu and Competitive Advantages. In D. F. Batten and C. Karlsson (Eds.), Infrastructure and the Complexity of Economic
Development (pp. 187-212). Berlin: Springer-Verlag.
Karlsson, C., and Backman, M. (2011). Accessibility to human capital and new firm formation.
International Journal of Foresight and Innovation Policy, 7(1/2/3), 7-22.
Kirchhoff, B. A., Armington, C., Hasan, I., and Newber, S. (2002). The influence of R&D expenditures on new firm formation and economic growth. Washington and Kansas City: Office of Economic Research, The National Commission on Entrepreneurship and Kauffman Center for Entrepreneurial Leadership.
Kwoka, J. E. J. (1985). The Herfindahl index in theory and practise. Antitrust Bulletin,
30(Winter), 915-947.
Lee, S. Y. (2001). Entrepreneurship and business development among African Americans, Koreans, and Jews: exploring some structural differences. In C.-G. H. R (Ed.), Migration,
Transnationalization, and Race in a Changing New York (pp. 258-278). Philadelphia:
Temple University Press.
Lee, S. Y., Florida, R., and Acs, Z. (2004). Creativity and Entrepreneurship: A Regional Analysis of New Firm Formation. Regional Studies, 38(8), 879-891.
Malmberg, A., and Maskell, P. (1997). Towards an explanation of regional specialization and industry agglomeration. European Planning Studies, 5(1), 25-41.
Malmberg, A., Sölvell, Ö., and Zander, I. (1996). Spatial Clustering, Local Accumulation of Knowledge and Firm Competitiveness. Geografiska Annaler, Series B, Human
Geography, 78(2), 85-97.
Mueller, E., and Morgan, J. N. (1962). Location Decisions of Manufacturers. American
Economic Review, 52(2), 204-217.
Niebuhr, A. (2010). Migration and innovation: Does cultural diversity matter for regional R&D activity? Papers in Regional Science, 89(3), 563-585.
Norton, R. D. (1992). Agglomeration and Competitiveness: from Marshall to Chintz. Urban
31
Page, S. E. (2007). The Difference: How the Power of Diversity Creates Better Groups, Firms,
Schools, and Societies. Princeton, NJ: Princeton University Press.
Parker, S. C. (2004). The Economics of Self-Employment and Entrepreneurship. Cambridge: Cambridge University Press.
Petrunia, R. (2008). Does Gibrat’s Law Hold? Evidence from Canadian Retail and Manufacturing Firms. Small Business Economics, 30(2), 201-214.
Porter, M. E. (1990). The Competitive Advantage of Nations. London, UK: Macmillan.
Reynolds, P. D., Miller, B., and Maki, W. R. (1995). Explaining regional variation in business births and deaths: U.S. 1976–88. Small Business Economics, 7(5), 389-407.
Richard, O. C. (2000). Racial Diversity, Business Strategy, and Firm Performance: A Resource-Based View. Academy of Management Journal, 43(2), 164-177.
Rodríguez-Pose, A., and Tselios, V. (2012). Individual earnings and educational externalities in the European Union. Regional Studies, 46(1), 39-57.
Saxenian, A. (2000). Silicon Valley’s New Immigrant Entrepreneurs Working Papers, Center for
Comparative Immigration Studies, University of California. San Diego.
Simon, H. A., and Bonini, C. P. (1958). The Size Distribution of Business Firms. The American
Economic Review, 48(4), 607-617.
Singh, A., and Whittington, G. (1975). The Size and Growth of Firms. The Review of Economic
Studies, 42(1), 15-26.
Smith, K. W., and Sasaki, M. S. (1979). Decreasing Multicollinearity: A Method for Models with Multiplicative Functions. Sociological Methods & Research, 8(1), 35-56.
Sorenson, O., and Audia, P. G. (2000). The Social Structure of Entrepreneurial Activity: Geographic Concentration of Footwear Production in the United States, 1940-1948.
American Journal of Sociology, 106(2), 424-462.
Sutaria, V., and Hicks, D. A. (2004a). New firm formation: Dynamics and determinants. Annals
of Regional Science, 38(2), 241-262.
Sutaria, V., and Hicks, D. A. (2004b). New firm formation: Dynamics and determinants. The
Annals of Regional Science, 38(2), 241-262.
Tallman, S., and Li, J. (1996). Effects of International Diversity and Product Diversity on the Performance of Multinational Firms. The Academy of Management Journal, 39(1), 179-196.
Teruel-Carrizosa, M. (2010). Gibrat’s law and the learning process. Small Business Economics,
34(4), 355-373.
Theil, H. (1972). Statistical Decomposition Analysis: With Applications in the Social and
Administrative Sciences. Amsterdam: North-Holland.
van Praag, M. C., and Versloot, P. H. (2007). What is the value of entrepreneurship? A review of recent research. Small Business Economics, 29(4), 351-382.
van Stel, A., and Suddle, K. (2008). The impact of new firm formation on regional development in the Netherlands. Small Business Economics, 30(1), 31-47.
Watson, W. E., Kumar, K., and Michaelsen, L. K. (1993). Cultural Diversity's Impact on Interaction Process and Performance: Comparing Homogeneous and Diverse Task Groups. The Academy of Management Journal, 36(3), 590-602.
White, A. P. (1982). A Note on Market Structure Measures and the Characteristics of Markets That They "Measure". Southern Economic Journal, 49(2), 542-549.
Yoon, I. (1997). On My Own: Korean Businesses and Race Relations in America. Chicago: University of Chicago Press.