http://www.diva-portal.org
Postprint
This is the accepted version of a paper published in Entrepreneurship: Theory & Practice. This paper has been peer-reviewed but does not include the final publisher proof-corrections or journal pagination.
Citation for the original published paper (version of record):
Baù, M., Pittino, D., Chirico, F., Backman, M., Klaesson, J. (2019)
Roots to grow: Family firms and local embeddedness in rural and urban contexts
Entrepreneurship: Theory & Practice, 43(2): 360-385
https://doi.org/10.1177/1042258718796089
Access to the published version may require subscription. N.B. When citing this work, cite the original published paper.
Permanent link to this version:
1
Roots to Grow:
Family Firms and Local Embeddedness in Rural and Urban Contexts
Massimo BaùCentre for Family Enterprise and Ownership (CeFEO)
Jönköping International Business School - Jönköping University P.O. Box 1026 SE-551 11 Jönköping, Sweden
Tel: +46 36 10 18 13 massimo.bau@ju.se Francesco Chirico
Centre for Family Enterprise and Ownership (CeFEO)
Jönköping International Business School - Jönköping University P.O. Box 1026 SE-551 11 Jönköping, Sweden
Tel: +46 36 10 18 32 francesco.chirico@ju.se
Daniel Pittino
Centre for Family Enterprise and Ownership (CeFEO)
Jönköping Inter Jönköping International Business School - Jönköping University P.O. Box 1026 SE-551 11 Jönköping, Sweden
danniel.pittino@ju.se +46 36-10 18 25 Mikaela Backman
Centre for Entrepreneurship and Spatial Economics (CEnSE)
Department of Economics
Jönköping International Business School - Jönköping University, Sweden mikaela backman@ju.se
+46 36-10 17 46 Johan Klaesson
Centre for Entrepreneurship and Spatial Economics (CEnSE)
Jönköping International Business School - Jönköping University P.O. Box 1026 SE-551 11 Jönköping, Sweden
johan.klaesson@ju.se +46 36-10 17 52
Acknowledgments: We are indebted to the editor, James Chrisman, and the two anonymous
reviewers as well as the organizers and participants of the TOFE Conference at the
University of St. Gallen for their insightful and developmental feedback. We would also like to thank Jönköping International Business School, the Centre for Family Enterprise and Ownership (CeFEO) and the related CeFEO workshop and participants for their support and valuable suggestions received during the development of the present manuscript.
2
Roots to Grow!
Family Firms and Local Embeddedness in Rural and Urban Contexts
AbstractThe present study analyzes the nexus among business growth, ownership structure and local embeddedness – i.e., the involvement of economic actors in a geographically bound social structure – in rural and urban contexts. This work combines regional economics with studies on family business and firm growth and uses a coarsened matched sample of privately held Swedish firms. The findings indicate that family firms benefit more than non-family firms from local embeddedness and as such they achieve higher levels of growth and that this effect is more pronounced in rural areas. Research implications are shared in the conclusion section.
Keywords: business growth, local embeddedness, urban-rural contexts, family firms.
Previous research – particularly within the field of regional studies – has addressed the influence of local embeddedness, which is the involvement of economic actors in a
geographically bound social structure (Granovetter, 1973; Hess, 2004), on a number of firm-level outcomes (e.g., Huggins, 2010; Johannisson, Ramirez-Pasillas, & Karlsson, 2002; Watts, Wood, & Wardle, 2006; Welter, 2011), such as innovation (Huggins & Thompson, 2014), knowledge sharing (Huggins & Johnston, 2009), new venture creation (Breitenecker et al., 2017) and firm growth (Audretsch & Dohse, 2007; Dahl & Sorenson, 2012).
However, until recently (e.g., Bird & Wennberg, 2014; Backman & Palmberg, 2015), there has been little cross-fertilization between regional studies and the family business literature. Thus, our understanding of the link between family firms –characterized by some degree of family involvement in ownership and management (Miller, Le Breton-Miller, Lester, & Cannella, 2007) – and the regional economic context remains quite limited (Stough et al., 2015). This research gap is not a trivial issue, given the importance and potentially crucial role of local embeddedness in family firms’ behavior (e.g., Berrone, Cruz, & Gómez-Mejia, 2012; Bird & Wennberg, 2014; Zellweger, Nason, Nordqvist, & Brush, 2013) and the key contribution of family firms to GDP and job creation in different regional contexts worldwide (e.g., Basco, 2015; Bjuggren, Johansson & Sjogren, 2011; Memili, Fang, Chrisman, & De Massis, 2015; Astrachan & Shanker, 2003).
3
This paper aims to fill this gap by investigating local embeddedness and family firm growth in rural and urban contexts. We focus on business growth because it has been proven to be among the key drivers of macroeconomic regional development (e.g., Carree & Thurik, 2003; Huggins & Thompson, 2014). Moreover, family firms’ attitude toward growth is subject to a recent ongoing debate (e.g., Backman & Palmberg, 2015; Bird & Wennberg, 2014; Bird & Zellweger, 2016; Bjuggren, Daunfeldt, & Johansson, 2013) that deserves further attention from the family business research community (e.g., Miller, Steier, & Le Breton-Miller 2016). Using data covering privately held firms in Sweden in the 2004-2013 period, we assess family firms’ growth compared to that of non-family firms and how this difference is contingent on the local embeddedness of the firm and the rural-urban context in which the firm operates. Our findings indicate that family firms benefit from local
embeddedness more than non-family firms and that this effect is more pronounced in rural areas.
Thus, our study makes several contributions. First, our work focuses on business growth, which, although important, is a relatively new research topic in relation to family firms (see, e.g., Casillas, Moreno & Barbero, 2010). In particular, our results provide insights into the theoretical mechanisms underlying the phenomenon of growth in family companies. Second, we contribute to the ongoing debate about the family’s effect on firm outcomes by
considering local embeddedness as a further intervening factor that helps explain the mixed findings in the previous literature (e.g., Miller, Minichilli & Corbetta, 2013; Wagner, Block, Miller, & Schwens, 2015). Third, combining regional studies with the family business
literature, we answer the call for a deeper understanding of the contribution of family firms to regional economic development and of the effects of the regional context on firm behavior and outcomes (Stough et al., 2015). Fourth, we contribute to the field of regional economics by detailing the importance of considering the impact of the spatial dimension (i.e., the urban
4
versus rural context) jointly with firm-level variables that account for family involvement and territorial embeddedness. More specifically, we contribute to the literature on urban versus rural firm growth (Tunberg, 2014) by investigating whether a rural context, properly leveraged by firm-level behaviors, can maximize the benefits of local embeddedness in specific organizational forms. Fifth, we contribute to the empirical studies on firm-level growth in family firms using a comprehensive dataset that includes both micro and small firms, whereas most previous studies have tended to exclude smaller companies due to identification constraints (Backman & Palmberg, 2015).
THEORETICAL FRAMEWORK
The existing literature on embeddedness (Granovetter; 1973) suggests that economic activities can be properly understood only if we consider the involvement of business
organizations in systems of interpersonal relationships and broader social structures. Various forms of embeddedness can be identified according to the prevailing dimension in the
formation of relationships and social structures (Granovetter, 1973; Grabher, 1993). In particular, economists and economic geographers have long been interested in the spatial distribution of economic activity and in factors that can explain location patterns. The relationship between location and economic activity can be interpreted using the specific concept of local embeddedness, which is defined as the involvement of economic actors in a geographically delimited network and/or institutional setting (Granovetter, 1973; Hess, 2004).
Local embeddedness is particularly important for business growth (see e.g., Davidsson & Wiklund, 2006) because it shapes the basic conditions that support productivity and
competitiveness (Jacobs, 1969; Thompson, 1965). The crucial role of local embeddedness has been highlighted with respect to firm outcomes at the local and regional/domestic levels (e.g., Cooke, Clifton, & Oleaga, 2005; Cooke, 2007) and competitiveness at the international scale
5
(e.g., Al-Laham & Souitaris, 2008). In particular, local embeddedness favors contacts with customers and suppliers in a geographic area (e.g., Cooke, 2007) and facilitates access to tangible assets, such as technology and a skilled labor force, and intangible assets, such as localized knowledge. Localized knowledge is characterized largely by being tacit; thus, it is difficult to codify, transfer and replicate. Therefore, localized knowledge can play a central role in building a firm’s competitive advantage (Grant, 1991; Nonaka, 2008; Spender, 1993). The local context may also favor the pursuit of expansion strategies in international markets, as local institutions and linkages often help to develop legitimacy and capabilities that can sustain firms’ international competitiveness (e.g., Al-Laham & Souitaris, 2008; Peng, Lee, & Wang, 2005).
The translation of localized knowledge and resources into competitive advantage depends crucially on the capacity of the firm to assimilate, utilize and exchange such resources, and this, in turn is related to the firm’s pre-existing knowledge, organizational processes and strategies (Cohen and Levinthal, 1990). The implications of local embeddedness vary also according to the type of region in which a firm is located. Regions are heterogeneous, and the levels of economic activity, development and resources differ substantially within a given region. Economic activities and resources are indeed unevenly distributed across space within a country. This uneven distribution leads some locations to be characterized by an abundance of resources and others by a scarcity of resources, as reflected in the urban-rural spatial context. Urban regions are larger and denser than rural regions, and they present advantages in terms of (1) a diversified supply of various producer services; (2) a regional network for information flows regarding new production techniques, products, customers, and suppliers; and (3) a large and differentiated labor supply (Norton, 1992).
Local embeddedness is a particularly important feature of family firms. As shown, for example, by Bird and Wennberg (2014: 424), “family businesses are more embedded within
6
the regional community than their non-family counterparts,” which in turn affects their strategic choices. Family firms are organizations in which ownership is concentrated within a family, with multiple family members involved in business operations while striving to maintain intra-organizational family-based relatedness (Arregle, Hitt, Sirmon, & Very, 2007; Miller, et al., 2007). Given these features, family business owners are particularly sensitive to organizational longevity, and therefore, they often emphasize the preservation of durable relationships with local stakeholders both through the establishment of cohesive internal communities involving employees (e.g., Miller, Lee, Chang, & Le Breton-Miller, 2009; Pittino, Visintin, Sternad, & Lenger, 2016) and through the creation of connections with external actors (Arregle et al., 2007). Family firms’ higher local embeddedness is linked to family owners’ non-economic goals (Chrisman, Chua, Pearson, & Barnett, 2012). These goals are often related to strengthening a firm’s community citizenship, to the preservation of binding and long-term ties with local stakeholders and to the contribution to the economic and social development of the area in which the company is located (e.g., Berrone et al., 2012; Berrone, Cruz, Gómez-Mejia, & Larraza-Kintana, 2010; Deephouse & Jaskiewicz, 2013).
Next, we argue that whereas certain features of family firms inhibit firm growth in comparison to non-family firms, local embeddedness and the rural context positively moderate and thus counterbalance this negative effect.
HYPOTHESES DEVELOPMENT Family Firms and Business Growth
Business growth is considered a key factor of the creation of wealth and employment (Davidsson & Wiklund, 2006). As several reviews highlight (e.g., Davidsson, Achtenhagen, & Naldi, 2010; Delmar, 1997; Gilbert, McDougall & Audretsch, 2006; Shepherd & Wiklund, 2009; Wiklund, 1998), research on this topic has focused on both the antecedents and
7
outcomes of growth, yet empirical evidence is somehow conflicting (Davidsson & Wiklund, 2006; Shepherd & Wiklund, 2009; Achtenhagen, Naldi, & Melin, 2013). However, one rather established fact in this area of research is that growth outcomes are affected by firm owners’ preferences (e.g., Cliff, 1998; Wiklund, Davidsson, & Delmar, 2003; Wiklund, Patzelt, & Shepherd, 2009).
In particular, previous studies have suggested that in the pursuit of non-financial goals (Chrisman et al., 2012), family owners tend to be more risk averse than non-family firms with regard to growth opportunities (e.g., Bjuggren et al., 2013; Daily & Dollinger, 1992;
Hamelin, 2013). For instance, Gómez-Mejía et al. (2007) find that family owners are loss averse in terms of threats to their socioemotional wealth, even if this aversion means accepting a greater probability of below-target performance. Put differently, avoiding non-financial losses has a greater weight than pursuing non-financial gains. Additionally, growth often implies the participation of external investors or a reliance on debt financing or equity
funding, which are likely to diminish the capacity of the family to exert control over the business (Chrisman & Patel, 2012; Gómez-Mejia et al., 2014). For instance, although obtaining debt financing does not dilute the family’s ownership of a firm, lenders often impose restrictive covenants and reporting requirements (Smith & Warner, 1979), which again reduce the family’s decision-making discretion and, overall, the family’s non-financial wealth endowment, such as family identity and the potential perpetuation of the family dynasty (Gómez-Mejia, Cruz, Berrone, & De Castro, 2011; Hoskisson, Chirico, Zyung, & Gambeta, 2017).
In contrast, non-financial considerations are less pronounced among non-family firms – for example, in firms dominated by an entrepreneurial team with no family ties in the business – which are less likely to face the non-financial-financial trade-offs related to growth (Chrisman & Patel, 2012). These firms may find non-financial considerations to be
8
less salient and frame their strategic choices around financial criteria, which in turn may affect growth. Indeed, existing research suggests that compared to family firms, non-family firms are less emotionally attached to the business and more financially motivated (Miller, Le Breton-Miller, & Scholnick, 2008). Thus, they favor strategies of rapid growth in sales through quick expansion by using leverage, building up cash reserves, and attracting external equity investors (Miller et al., 2011). Thus, we propose the following:
Hypothesis 1: Family firms exhibit lower business growth than non-family firms.
Local Embeddedness and Business Growth
We also predict that as local embeddedness increases, family firms are more likely than their non-family counterparts to take advantage of localized knowledge and resources and further enhance them through training and socialization processes supported by their rich tacit knowledge and (family) firm-specific assets (Block & Spiegel, 2013). As argued by Bird and Wennberg (2014) and Chirico, Ireland, and Sirmon (2011), family firms indeed possess a superior capacity to leverage local resources and networks. In fact, they often build their competitive advantage by relying not only on tacit knowledge and the network-embedded resources available within the business (Carnes & Ireland, 2013; Habbershon & Williams, 1999; Sirmon & Hitt, 2003) but also and most importantly on those outside of the business (Bird & Wennberg, 2014; Chirico et al., 2011; Miller & Le-Breton Miller, 2005).
First, we argue that the superior capacity of family versus non-family firms to exploit the benefits of higher local embeddedness derives from the fact that the utilization of social capital is often a distinctive component of a family firm’s strategy (e.g. Zahra, 2010). In family firms, social relationships are indeed the building blocks of the family organizational structure (Arregle et al., 2007) and are characterized by long-term generalized reciprocity and trust among firm members (Long & Mathews, 2011; Pearson & Marler, 2010). In this
9
offers to the firm in terms of interactions between individual family members and the business. These features tend to be replicated outside of the firm, thus creating an environment that facilitates the use and exchange of knowledge and resources with the external network of local stakeholders on the basis of informal and trust-based interactions (Miller, Lee, Chang, & Le Breton-Miller, 2009; Lester & Cannella, 2006; Peake, Cooper, Fitzgerald, & Muske, 2015) sustained by family members’ personal commitment and
personalized business relationships (Carney, 2005; Gedajlovic & Carney, 2010) and through the dissemination of the family business’ values and norms in the local community (Arregle et al. 2007; Benavides-Velasco, Quintana-García, & Guzmán-Parra, 2013; Danes et al. 2009).
Second, family firms are more likely than non-family firms to exploit the benefits of higher local embeddedness because they obtain both financial and non-financial utilities from such behavior. More specifically, increasing levels of local embeddedness may help family firms to reconcile the trade-off between the pursuit of financial and non-economic goals, thus sustaining business growth at a higher rate than the growth of non-family firms – whose focus is on financial utilities only. For instance, in the context of increasing local
embededness the preservation of non-financial goals of family firms may motivate future-oriented financial strategies that prioritize the business’ long-term continuity in the community by maximizing current growth opportunities (e.g., Zahra, Hayton, & Salvato, 2004; Miller et al., 2009). That is, when local embeddedness is high, the pursuit of business growth helps family firms to achieve not only higher financial returns but also help them to fulfill their non-economic preferences, for instance, in terms of family reputational concerns, a feeling of responsibility towards local stakeholders and the economic development of the territorial community, and the desire for a long-term presence in the local community
10
that family firms exhibit lower business growth than non-family firms, we contend that as local embeddedness increases, family firms achieve higher levels of growth. Formally:
Hypothesis 2: Local embeddedness positively moderates the relationship
between family involvement and business growth in such a way that as local embeddedness increases, the growth of family firms increases at a higher rate than the growth of non-family firms.
Local Embeddedness in Urban versus Rural Contexts
In rural areas, knowledge externalities are less frequent, and firms face less demand for their products in both their immediate surrounding environment and in adjacent non-metropolitan regions (e.g., Duranton & Puga, 2004). Moreover, rural areas often lack important resources needed for firm growth, such as skilled labor and/or financial capital, or at least the supply of these production factors is less diversified in rural regions than in larger and denser urban regions, which often offer the most favorable conditions (Backman, 2013). These factors may tend to lower the average firm growth in rural areas relative to that of firms located in more urban settings (Tunberg, 2014).
The firm-region nexus is further influenced by the level of firm linkage – that is, the extent to which a firm depends on and interacts with its rural-urban surroundings – and what the local community can offer in terms of economic opportunities (Dicken & Malmberg, 2001). Davidsson and Honig (2003) find that small firms located in a rural context are heavily reliant on the resources and knowledge that can be accessed through friends and family. Consistent with that result, Meccheri and Pelloni (2006) establish that in rural areas, firm outcomes depend strongly on the firm’s human capital and social local anchoring. Thus, especially in rural areas where resources are scarcer (Uzzi, 1997), local embeddedness may become more relevant for the identification and exploitation of growth opportunities.
Extending this argument to the comparison between a family and non-family firm, we postulate that in rural areas the advantage of family firms in leveraging locally embedded knowledge and resources for growth is particularly pronounced. Arregle et al. (2007) explain
11
that family firms are characterized by “network closure”; that is, a family firm's network is characterized by densely rather than sparsely connected ties. As discussed above, compared to non-family firms, family firms tend to build stronger and more durable relationships with the local community, which can provide them with critical knowledge and resources for firm growth. This phenomenon is particularly valid for rural areas, “where families have the possibility to form alliances and build close connections with the community and are exposed less to the anonymity of urban areas” (Bird & Wennberg, 2014: p. 425).
Additionally, given that rural firms often rely on informal relationships (Felzensztein, Gimmon, & Carter, 2010) and on financing through friends and family who are in close proximity (Davidsson & Honig, 2003; Meccheri & Pelloni, 2006) while emphasizing community-level shared values and norms as a platform for knowledge exchange (Falk & Kilpatrick, 2000; Summers, 1986), family firms have an important advantage over non-family firms in this regard because of their informal and trust-based relationships and their strong local roots in the region (Astrachan, 1988; Block, 2010; Fitzgerald et al., 2010). Hence, we predict that the positive moderating effect of local embeddedness on the relationship between family involvement and business growth is further enhanced in rural areas compared to urban areas. In formal terms:
Hypothesis 3: The positive moderating effect of local embeddedness on the
relationship between family involvement and business growth will be more pronounced in rural contexts than in urban contexts.
METHODS Research Design
To test our hypotheses, we use detailed micro-data from Statistics Sweden. The data cover individuals and privately held firms for the years 2004 to 2013 and are structured as matched employee-employer longitudinal data. We excluded firms with only one employee (i.e., individuals who are self-employed) during the period considered. We further limited our sample to independent companies (by excluding firms controlled by other organizations) of
12
which the information of who are the owners of the companies was available. We also excluded firms established in 2004 (i.e. the matching year) given that we could not calculate business growth in the first year of existence of a firm. Finally, we considered companies with complete information in the studied period. Thus, by utilizing this dataset, we cover a population of over 40,000 privately held companies.
Variables and Measures
Business Growth. Following previous studies (e.g., Delmar, Davidsson, Gartner, 2003),
we measured business growth as relative (percentage) sales growth (i.e., [salest – sales t-1]/salest-1)1. There is a one-year lag between the measure of the dependent variable and all independent and control variables.
Family Firm Measure. We adopt a binary measure of family firms. We define family
firms as those in which two or more family members own and manage the company2 (Miller
et al., 2007), either in a household (spousal couple) or in a biologically linked family (i.e., father, mother, and children who live in the same or another household) (see also Wennberg, Wiklund, Hellerstedt, & Nordqvist, 2011; Wiklund, Nordqvist, Hellerstedt, & Bird, 2013). Thus, the variable is coded as "1" when the company is a family firm and "0" otherwise.
Local Embeddedness. We focus on capturing owners’ embeddedness within a location.
Following Dahl and Sorenson (2012), we measure local embeddedness as the log of the average number of years that the owners have lived in the municipality in which the firm is located.
Firm Context – Rural versus Urban. Following the work of Westlund, Larsson and
Olsson (2014) and Nilsson (2015), Swedish municipalities are separated into two categories. The first category is the urban context, which includes both metropolitan and urban
1 To avoid outliers, the sale values are trimmed at the 1st and 99th percentiles. 2 Family members working part-time were also considered.
13
municipalities that supply a large variety of services to the individuals and firms that are based in the location. The second category is the rural context, which includes rural and sparsely populated rural municipalities that host a limited range of services. The variable takes the value of 1 for the rural context and 0 for the urban context.
Covariate Controls
First, because owners’ age may affect firm growth (Hambrick & Mason, 1984), we controlled for the average age of all owners. Second, we controlled for the human capital within the firm, calculated as the ratio of employees with a graduate education, given that the intensity of high-human-capital workers leads to stronger firm outcomes (Colombo & Grilli, 2005; Ganotakis, 2012; Moretti, 2004; Pennings, Lee, & Witteloostuijn, 1998). Third, we controlled for the log of total assets as the amount of prior investments might effect firm growth (Anand & Singh, 1997). Fourth, we controlled for high- and low-discretion slack, given their
potential effects on firm growth (George, 2005). High-discretion slack was measured as the level of cash reserves, whereas low-discretion slack was measured as the debt-to-equity ratio (George, 2005). Following Chen (2008), we standardized these two measures and summed them to obtain a general slack index. Fifth, we controlled for firm performance in terms of Return on Assets (ROA)3 (Wales, Parida, & Patel, 2013). Sixth, we controlled for
environmental dynamism and munificence (Keats & Hitt, 1988), which may influence firm growth (Bradley, Shepherd, & Wiklund, 2011). Munificence is measured by averaging the regression coefficients of a given industry’s (four-digit NACE code) sales over a five-year period. Dynamism is calculated as the average of the standard errors of the regression slopes for the sales regression equations used in calculating industry munificence over a five-year period (see Keats & Hitt, 1988). Seveth, we controlled for the log of the population living in each Swedish municipality, as it captures the potential agglomeration benefits that may
14
increase firm growth (Audretsch & Dohse, 2007; Baptista & Preto, 2011; Raspe & Oort, 2008). Eight, we calculated the location quotients (LQ) to control for the match between the firm’s specialization at the two-digit SIC code level and the specialization of the municipality in which the firm is located (Boix & Trullén, 2007). LQ measures the relative specialization for a municipality in relation to the reference unit, in this case, the rest of Sweden. The LQ compares the employment share of a specific sector in the municipality to the rest of the country, as described in Equation 1. Thus, a value of one indicates that the municipality has the same share of industry employment as the rest of the country. A value above one
indicates a higher industry share compared to the rest of the country (over-representation), and a value below one indicates a lower share compared to the rest of the country (under-representation). A higher value indicates a higher level of specialization and has been
confirmed in previous studies to correlate with higher firm outcomes (Gabe & Kraybill, 2002; Wennberg & Lindqvist, 2010). Finally, to control for time dependency, the log of time was also incorporated into the analyses (Box-Steffensmeier & Jones, 2004) 4.
(1)
Data Analysis
We relied on coarsened exact matching (CEM) to improve the balance between the treated (family) and control (non-family) groups (Blackwell, Iacus, King, & Porro, 2009; Iacus, King, & Porro, 2011). CEM improves the estimation of causal effects using a monotonic, imbalance-reducing matching method that mitigates selection bias, causal estimation error, inefficiency and model dependence (Blackwell et al., 2009). We used the “k2k” matching technique, which prunes observations from a CEM solution within each stratum until the
4 Due to the high correlaton between generational involvement and the family firm dummy, we did not control for the number of family generations involved in the business (Sciascia, Mazzola & Chirico, 2013).
15
solution contains the same number of treated and control units within all strata, enabling compensation for the differential strata sizes.
Specifically, we matched on four variables capturing the age of a firm5, firm size in terms of number of full time employees, the municipality in which the firm is located and the industry in which the firm operates (at the two-digit SIC level) in the year 2004 and followed the companies in the subsequent years. Young and small firms can be affected by the liability of newness and smallness, which can affect firm growth (Hannan & Freeman, 1977). In addition, different municipality locations and industries may encourage companies to be more or less positioned for growth (Eisenhardt & Schoonhoven, 1990; Hoover & Vernon, 1959). Given that coarser matching may reduce the value of matching when adjusting for
differences across the case and control groups, we opted for a finer-grained exact matching for number of employees and industry in which Stata forces CEM to avoid coarsening the matching variables (Blackwell et al., 2009; Iacus et al., 2011). The treatment variable is a binary variable that distinguishes family firms from non-family firms. The matching
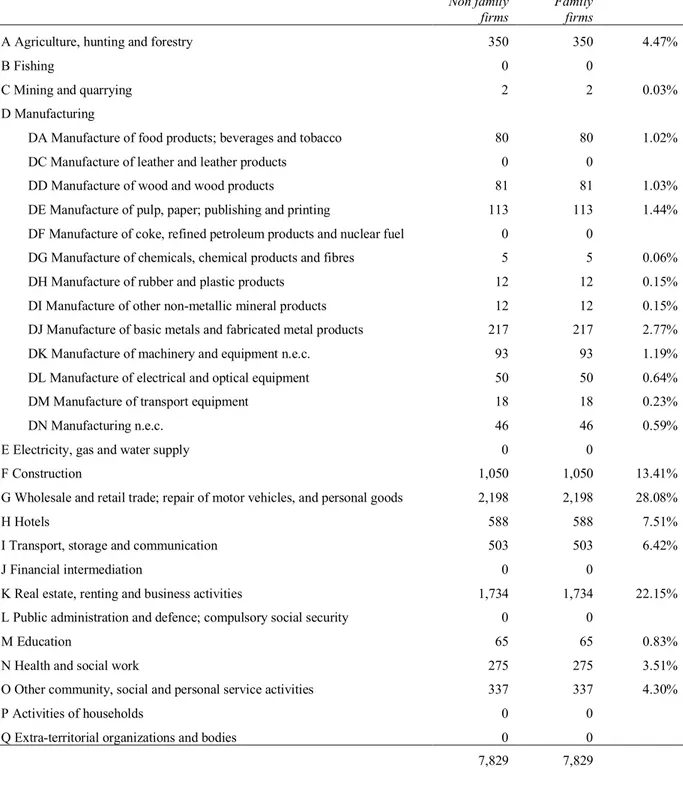
procedure yielded a final matched sample of 15,658 companies (7,829 family firms and 7,829 non-family firms). The means (M), standard deviations (SD), minimum (Min) and maximum (Max) of the matching variables and dependent and independent variables of the study before the matching and in the year of the matching are presented in Table 1 for family (FF) and non-family firms (NFF). Additionally, Table 2 shows a breakdown of the family and nonfamily firms by industry (SNI 2002 codes).
-Insert Tables 1 and 2 about here-
EMPIRICAL RESULTS
5 Information on firm age is not available for all firms. CEM offers an approach to address missing values through “matching on missingness,” i.e., CEM treats the missing values as an additional category on which to match (Blackwell et al., 2009).
16
To test the proposed hypotheses, we used panel data analysis with a random effect
specification. The descriptive statistics and the Pearson correlation coefficients of the study’s variables are presented in Table 3. Inspection of the variance inflation factors (VIFs) and tolerance showed that multicollinearity was not a concern. Indeed, all VIF coefficients were below the cutoff of 5 (O’Brien, 2007).
-Insert Table 3 about here-
First Stage. Controlling for Endogeneity
Firm growth may also be endogenous to the unique features of family firms. In other words, factors that might influence firm growth could also influence the desirability of keeping the firm as a family business. Although we lagged the independent and control variables by one year and the matching approach addresses the most pressing endogeneity concerns (De Figueiredo, Meyer-Doyle, & Rawley, 2013; Wooldridge, 2002), we further identified two instrumental variables correlated with the family firm variable but not with the dependent variable: a) household size (average number of family members living with the owner) and b) household income (log of the average of the total incomes of family members living with the owner). In fact, a family may be more likely to maintain control of their firm when many family members are part of their household (e.g., Miller, Fitzgerald, Winter, & Paul, 1999) and when their income is high (Haynes, Walker, Rowe, & Hong, 1999). However, these two factors may not directly affect firm growth (Heck, Owen, & Rowe, 1995).
We employed a two-stage residual inclusion (2SRI) model (see Terza, Basu, & Rathouz, 2008) to control for endogeneity. In linear models, 2SRI is similar to the popular two-stage least squares (2SLS) method and is, therefore, consistent in terms of results (Terza et al., 2008: 534). Empirically a 2SRI estimator is like the linear 2SLS, except that in the second-stage regression, the endogenous variables are not replaced by the first-second-stage predictors. Instead, first-stage residuals are included as additional regressors (endogeneity score in Table
17
4). Thus, we controlled for the endogeneity score in the final analyses to mitigate any
potential endogeneity issues (Terza et al., 2008). Table 4 (Model 1) presents the results of our first stage model.
Second Stage. Hypotheses Test.
We report the findings of our analyses in Table 4. Hypothesis 1 (Table 4, Model 3) is not supported. In fact, the family firm coefficient is positive and significant, suggesting that family firms achieve higher levels of business growth than non-family firms do. Hypotheses 2 and 3 consider the moderation effects of local embeddedness and firm location,
respectively. To test Hypothesis 2, we employed a two-way interaction (Aiken & West, 1991) between the family firm and local embeddedness. The interaction term is positive and
significant (Table 4, Model 4). To interpret this result, we plotted the two-way interaction in Figure 1. In support of Hypothesis 2, the figure shows that as local embeddedness increases, the growth of family firms increases at a higher rate than the growth of non-family firms. As expected, this difference is largest when local embeddedness is high. Interestingly, Figure 1 also shows that when embeddedness is low non-family firms achieve higher levels of growth than family firms. Finally, to test Hypothesis 3, we employed a three-way interaction
(Dawson & Richter, 2006) among the family firm, local embeddedness and the rural/urban context. The interaction effect is significant (see Table 4, Model 5), and the plot of the interaction (Figure 2) confirms that the highest effect of local embeddedness on business growth occurs among family firms that operate in a rural context.
-Insert Table 4 and Figures 1 and 2 about here-
Robustness Tests
First, to test the sensitivity of our results to our matching procedure, we included the
observations dropped by CEM into the sample. Second, following previous studies (Backman & Palmberg, 2015; McKelvie & Wiklund, 2010; Shepherd & Wiklund, 2009), we used an
18
alternative measure of business growth in terms of relative employment growth. Additionally, we ran our analyses using absolute measures of sales and employees with a fixed effect specification (Backman & Palmberg, 2015). Third, we adopted a continuous measure of family involvement (Chrisman & Patel, 2012) in terms of a) the total number of family owners, i.e., family members who declared partial ownership to tax authorities, and b) the total number of family managers (e.g., Le Breton-Miller, Miller, & Lester, 2011). Given that these measures converged by loading together as a single factor, we built a composite
measure of family involvement by summing the standardized values of the two measures (see Finkelstein, 1992; Martin, Gómez-Mejia, & Wiseman, 2013 for a similar procedure). Fourth, we used an alternative measure of local embeddedness that captures top managers’
embeddedness within a location (i.e., the number of years that managers have lived in the municipality in which the firm is located). In all the above cases, the results were
substantially similar to those reported in the main analyses. Yet, the three interaction effect with the top managers’ embeddedness measure was significant at p=.081. Additionally, as an alternative proxy for embeddedness, we counted the number of years a firm has spent in the same municipality since 1990 (first data available on this variable). As expected, the plot showed that within highly embedded companies, family firms operating in rural areas are those that achieve the highest level of growth. Finally, we tested for nonlinear relationships and found no empirical support.
DISCUSSION
Our results highlight the importance of the local context for the growth of family versus non-family firms. Regarding non-family firms’ general attitude towards business growth, the lack of support for the first hypothesis suggests that family firms may instead opt to preserve future non-financial wealth through increasing current revenues (e.g., Gómez-Mejia et al., 2014; Hoskisson et al., 2017). Additionally, as the level of embeddedness increases, family firms
19
may be further motivated to grow because of their commitment to local stakeholders and communities. Family firms appear to be more capable than non-family firms to translate spatially embedded resource endowments into growth performance, suggesting their superior ability to benefit from “favorable community attitudes” (Bird & Wennberg, 2014; p. 433). Family firms better use locally embedded knowledge and resources to build a competitive advantage based on tacit knowledge and firm-specific capital, which in turn translates into superior growth. In particular, Figure 1 shows that the positive effect of increasing local embeddedness on business growth is higher among family firms in comparison to non-family firms. Non-non-family firms seem thus to derive lower benefits than non-family firms from increased local embeddedness (see Figure 1). One possible explanation for this result could be related with the quality of relationships established at the local level. For example, it might be that non-family firms are less able to develop valuable social capital from the relationships with their stakeholders. For example, if exchanges are restricted, as opposed to generalized (e.g. Daspit et al., 2106) – i.e. they privilege the transactional/market dimension over the relational one, the embeddedness might be less beneficial to achieve positive firm outcomes. However, our measure of embeddedness does not allow to capture the quality of the
relationships, and this represent a limitation of the present study, which is further discussed in the concluding section.
Finally, we find support for Hypothesis 3, which predicts that locally embedded
connections and bonds are particularly important for family firms versus non-family firms in rural contexts, where weak infrastructure and the low density of the population and of economic activities make it more difficult for all types of firms to attract resources, find inputs, and access information and knowledge. In such conditions, it becomes even more important to effectively leverage the available resources. Figure 2 shows that the positive effect of local embeddedness on business growth is strongest among family firms operating
20
in a rural context. This evidence suggests that the ‘roots to grow’ are important and family firms gain “localized” competitive advantages in rural contexts, using their local social connections and networks to attract human capital, knowledge-based assets and financial capital (Backman & Palmberg, 2015).
Contributions
Our study has relevant theoretical implications for family business research. First, our work represents one of the first recent attempts to study business growth and the contextual conditions affecting business growth in family firms (e.g., Casillas & Moreno, 2010; Casillas et al., 2010; Eddleston et al., 2013). In contrast to our predictions and the existing literature (e.g., Arregle et al., 2013; Colombo et al., 2014), our results show that family firms grow more than non-family firms. Additionally, in terms of growth, family firms benefit more from the embeddedness within the local community than non-family firms (Bird & Wennberg, 2014; Backman & Palmberg, 2015). As such, our work furthers the idea that family firms strongly leverage tacit knowledge and firm-specific resources in their strategic conduct (e.g., Chirico et al., 2011) and rely on external social relationships to address resource scarcity and resource deployment issues (Kim, Im, & Slater, 2013; Sirmon & Hitt, 2003). Thus, we offer interesting insights for future studies exploring the family, business and environmental mechanisms that lead to positive outcomes for family firms.
Second, we contribute to the literature on non-economic goals in family firms (e.g., Chrisman et al., 2012; Gómez-Mejia, et al., 2007) by theorizing that the level of local embeddedness may be a dimension that affects the trade-off between economic and economic goals, with this trade-off waning when the pursuit of community-related non-economic goals is also a way to build resources that support the family business’s
competitive advantage. Third, we add to the field of regional economics by investigating whether local embeddedness in a rural context can function as a substitute for external
21
economies, such as the agglomeration benefits and positive externalities that are present in an urban context. In an urban region of sufficient size, spatially bounded markets function more effectively. One reason for this effect is the sheer size of the market, and another is the diversity of resources in a large market as a result of different fixed costs and indivisibilities. Thus, markets for labor, ideas and fixed resources give rise to matching, learning and sharing effects, all of which benefit firms that can obtain these positive externalities in a larger urban market. In a smaller, more rural region, the above effects are much more limited. One way to achieve similar effects in a smaller rural location is by relying not on the market process to the same extent but instead on locally embedded network exchanges. The value added of greater local embeddedness is that actions can be coordinated and result in efficiency gains that offset the lack of agglomeration gains that can be obtained in a larger market. The observed effects provide interesting extensions to both theoretical arguments and empirical evidence in favor of the prevalence of family firms in low-resource-intensive environments (Carney, 2005) and in regions that are economically depressed or that feature lower levels of development (Chang, Chrisman, Chua, & Kellermanns, 2008).
Finally, by combining regional studies and the family business literature, we answered the call for further research to combine the two fields (e.g., Stough et al., 2015) and provided a way to (1) better understand the contribution of family businesses to growth in various types of local contexts (e.g., Welter, 2011) and (2) investigate the issue of firm-level heterogeneity and behavior in the context of regional studies (e.g., Maskell, 2001; Block & Spiegel, 2013).
Limitations and Directions for Future Research
The present study has also several limitations that indicate important directions for future research. First, an aspect that is not fully explored in the present study is how local
embeddedness differs across industries. In this study, we match for industry; however, to understand the differences in a more profound way, firms of different industries should be
22
analyzed separately. This separate analysis can certainly be combined with the regional context, where, for example, knowledge-intensive firms may be more reliant on being located in a urban setting. Second, due to data limitations, we did not measure local embeddedness through actual owners’ network contacts in a region. However, we agree with Dahl and Sorenson (2012: 1063), who note that although embeddedness may be measured by directly observing whether owners have close personal contacts in a region, owners’ tenure in the region represents a better measure of embeddedness. Specifically, “one must worry about the meaning of relationships. At issue is the fact that people select into them. Differences in the quality or number of connections available to individuals might therefore reflect individual-level heterogeneity rather than random variation in their relationships. Measuring these connections directly raises a reflection problem that could bias the estimates.” Yet, future research may assess local embeddedness utilizing also measures accounting for the quality of the relationships (e.g. restricted versus generalized social exchanges between a firm and its community; Daspit et al., 2016). A further limitation of our measure of local embeddedness is that it may not account for the network that previous family generations may pass down to current owners. This topic may represent a promising area of future research in connection to family business succession, given the need to transfer social networks across generations nd since embeddedness in a community is considered an important factor of successor selection (see Cabrera-Suárez, Saa-Pérez, & García-Almeida, 2001; Steier, 2001). Third, our measure of family firms does not take into account the amount (percentage) of family ownership of the firm. As such, our family firm sample might include firms where the majority of owners are non-family investors or exclude firms where family mangers are not present due to the fact that the firm is in later generations of family control. Fourth, another underexplored issue is related to the potential shifts in localizations of family and non-family firms over time and whether such shifts may be affected by the level of local embeddedness. By analyzing
23
localization patterns and their determinants, future studies may contribute to the existing literature on firm localization. Fifth, this study is conducted for Swedish firms; it would be interesting to observe whether similarities or differences exist across specific countries. Finally, an interesting finding that may deserve future investigation is the positive relationship between local embeddedness and owners’ age and their effects on business growth. In particular, the negative effect of owners’ age on growth is in line with previous evidence that family firms with long-tenured family owners exhibit lower growth propensity (e.g., Zahra, 2005). Yet, future research may explore whether local embeddedness has a diminishing or increasing effect on growth over time, thus suggesting a non-linear relationship.
In summary, we believe that our study provides important insights and has the potential to stimulate further work on the interesting but underexplored topic of local embeddedness and rural-urban contexts for business growth in family versus non-family firms.
24
TABLE 1: Matching variables, dependent and independent variables before the match and in the year of the match (2004).
Pre-match (N = 45,282) Post-match (N = 15,658)
Non family firms Family firms Non family firms Family firms
Firm age M: 6.41 SD: 3.54 Min: 2 Max: 14 M: 7.76 SD: 3.79 Min: 2 Max: 14 M: 6.31 SD: 3.54 Min: 2 Max: 14 M: 6.64 SD: 3.55 Min: 2 Max: 14 Firm size (number
of employees) M: 7.72 SD: 12.33 Min: 2 Max: 335 M: 9.23 SD: 13.26 Min: 2 Max: 547 M: 5.86 SD: 5.55 Min: 2 Max: 119 M: 5.86 SD: 5.55 Min: 2 Max: 119 Local embeddedness M: SD: 9.39 5.92 Min: 0 Max: 15 M: 10.45 SD: 5.66 Min: 0 Max: 15 M: 9.49 SD: 5.90 Min: 0 Max: 15 M: 10.25 SD: 5.68 Min: 0 Max: 15 Firm context (rural=1) M: SD: 0.32 0.47 Min: 0 Max: 1 M: 0.41 SD: 0.49 Min: 0 Max: 1 M: 0.33 SD: 0.47 Min: 0 Max: 1 M: 0.37 SD: 0.48 Min: 0 Max: 1 Business growth (relative sales growth) M: 0.13 SD: 0.39 Min: -0.92 Max: 3.75 M: 0.09 SD: 0.31 Min: -0.94 Max: 3.77 M: 0.14 SD: 0.50 Min: -0.92 Max: 3.75 M: 0.12 SD: 0.45 Min: -0.94 Max: 3.77
25
TABLE 2: Distribution of the firms per each industry (SNI 2002) in the year of the match (2004).
Non family
firms Family firms
A Agriculture, hunting and forestry 350 350 4.47%
B Fishing 0 0
C Mining and quarrying 2 2 0.03%
D Manufacturing
DA Manufacture of food products; beverages and tobacco 80 80 1.02%
DC Manufacture of leather and leather products 0 0
DD Manufacture of wood and wood products 81 81 1.03%
DE Manufacture of pulp, paper; publishing and printing 113 113 1.44%
DF Manufacture of coke, refined petroleum products and nuclear fuel 0 0
DG Manufacture of chemicals, chemical products and fibres 5 5 0.06%
DH Manufacture of rubber and plastic products 12 12 0.15%
DI Manufacture of other non-metallic mineral products 12 12 0.15%
DJ Manufacture of basic metals and fabricated metal products 217 217 2.77%
DK Manufacture of machinery and equipment n.e.c. 93 93 1.19%
DL Manufacture of electrical and optical equipment 50 50 0.64%
DM Manufacture of transport equipment 18 18 0.23%
DN Manufacturing n.e.c. 46 46 0.59%
E Electricity, gas and water supply 0 0
F Construction 1,050 1,050 13.41%
G Wholesale and retail trade; repair of motor vehicles, and personal goods 2,198 2,198 28.08%
H Hotels 588 588 7.51%
I Transport, storage and communication 503 503 6.42%
J Financial intermediation 0 0
K Real estate, renting and business activities 1,734 1,734 22.15%
L Public administration and defence; compulsory social security 0 0
M Education 65 65 0.83%
N Health and social work 275 275 3.51%
O Other community, social and personal service activities 337 337 4.30%
P Activities of households 0 0
Q Extra-territorial organizations and bodies 0 0
26
TABLE 3: Correlation matrix and summary statistics (2004-2013).
Mean S.D. 1. 2. 3. 4. 5. 6. 7. 8. 9. 10. 11. 12. 13. 14. 15. 16. 17. 18. 19. 20. 21. 22.
1. Business growth (sales) 0.07 0.32
2. Family firm (dummy) 0.60 0.49 0.00
3. Local embeddedness 12.75 7.51 -0.04 0.08
4. Firm context (rural=1) 0.36 0.48 -0.02 0.04 0.20
5. Owners' age 48.85 9.19 -0.12 0.05 0.18 0.05
6. Firm human capital 0.11 0.22 0.04 -0.04 -0.10 -0.20 0.04
7. Firm total assets 4,384.87 5,568.54 0.06 0.07 -0.02 -0.01 0.04 0.06
8. Firm slack 0.01 0.11 0.06 0.03 0.01 -0.03 -0.02 -0.01 0.43 9. Firm performance 2.61 18.95 0.16 0.15 -0.06 -0.06 -0.04 0.13 0.16 0.12 10. Industry dynamism 1.00 0.00 0.00 0.02 -0.05 -0.01 0.04 0.01 0.12 -0.10 0.03 11. Industry munificence 0.98 0.03 -0.04 -0.00 0.02 -0.01 0.03 0.07 0.05 -0.04 0.01 0.02 12. Municipality size 177,124.88 262,129.80 0.02 -0.07 -0.20 -0.44 -0.05 0.28 0.01 0.03 0.06 0.01 0.04 13. Location quotients 1.44 2.35 0.00 0.01 0.04 0.10 0.01 -0.02 0.07 0.03 -0.02 0.04 0.02 -0.05 14. Firm age 10.42 4.63 -0.16 0.10 0.22 0.05 0.38 -0.04 0.14 0.05 0.06 -0.01 0.12 -0.03 0.04
15. Firm size (# employees) 6.69 7.50 0.08 0.06 -0.07 -0.07 -0.07 0.07 0.45 0.35 0.15 -0.00 -0.06 0.09 0.01 0.05
16. Time (log) 1.35 0.74 -0.12 0.12 0.27 0.02 0.21 0.01 0.11 0.04 0.04 -0.03 0.06 0.00 0.02 0.60 0.06
17. Business growth (employees) 0.06 0.29 0.27 0.00 -0.03 -0.01 -0.09 0.01 0.01 0.01 0.01 0.00 -0.02 0.00 -0.01 0.03 0.11 -0.01
18. Sales 8,798.27 13,053.17 0.10 0.05 -0.08 -0.05 -0.04 0.02 0.67 0.32 0.19 0.10 0.04 0.06 0.00 0.04 0.60 -0.00 0.01
19. Family involvement (continuous) 0.00 1.89 0.00 0.82 0.02 0.01 0.00 0.02 0.12 0.07 0.17 0.02 0.00 -0.02 0.01 -0.13 0.14 0.18 -0.00 0.11
20. Top managers’ embeddedness 8.27 8.95 -0.03 0.04 0.54 0.10 0.10 -0.06 -0.11 -0.04 -0.02 -0.06 0.02 -0.10 0.02 0.08 -0.09 0.05 -0.01 -0.13 0.00
21. # years of a firm in the same municipality 11.74 5.70 -0.14 0.06 0.34 0.09 0.40 -0.07 0.11 0.06 0.01 -0.03 0.11 -0.03 0.04 0.08 -0.00 0.06 -0.12 0.03 0.04 0.18
22. Household income (log) 8.07 0.54 0.00 0.15 -0.06 -0.11 0.12 0.23 0.25 0.10 0.23 0.06 0.04 0.10 -0.01 0.11 0.14 0.40 -0.03 0.19 0.16 -0.06 -0.02
23. Household size 2.12 0.63 -0.01 0.23 0.09 0.02 0.10 -0.00 0.02 -0.00 -0.01 -0.02 -0.01 -0.06 0.02 0.90 -0.02 1.00 -0.01 -0.00 0.18 0.05 0.06 0.40
27
TABLE 4: 2SRI. Family firm, local embeddedness, firm context and business growth (2004-2013).
First stage Second stage
1. 2. 3. 4. 5.
Firm owner’s age 0.863*** -0.170*** -0.173*** -0.174*** -0.174***
(0.184) (0.009) (0.009) (0.009) (0.009)
Firm human capital -1.193*** 0.017* 0.018* 0.018* 0.018*
(0.174) (0.008) (0.008) (0.008) (0.008)
Firm total assets 0.233*** 0.018*** 0.018*** 0.018*** 0.018***
(0.030) (0.001) (0.001) (0.001) (0.001) Firm slack 0.148 0.098*** 0.097*** 0.097*** 0.097*** (0.218) (0.013) (0.013) (0.013) (0.013) Firm performance 0.011*** 0.004*** 0.004*** 0.004*** 0.004*** (0.001) (0.000) (0.000) (0.000) (0.000) Industry dynamism 19.878+ -0.392 -0.287 -0.289 -0.291 (11.224) (0.548) (0.548) (0.548) (0.548) Industry munificence 1.887** -0.185*** -0.185*** -0.186*** -0.187*** (0.646) (0.041) (0.041) (0.041) (0.041) Municipality size -0.373*** -0.000 -0.001 -0.001 -0.001 (0.034) (0.001) (0.002) (0.002) (0.002) Location quotients -0.001 0.001 0.001 0.001 0.001 (0.014) (0.001) (0.001) (0.001) (0.001) Log of time 0.944*** -0.048*** -0.049*** -0.049*** -0.049*** (0.024) (0.002) (0.002) (0.002) (0.002) Family firm 0.007* -0.003 0.002 (0.003) (0.006) (0.007) Local embeddedness 0.009*** 0.004 0.005* (0.001) (0.002) (0.002)
Firm context (rural) -0.006 -0.006 0.010
(0.005) (0.010) (0.013)
Family firm ´ Local embeddedness 0.007** 0.005+
(0.002) (0.003)
Family firm ´ Firm context -0.015* -0.043**
(0.006) (0.015)
Local embeddedness ´ Firm context 0.004 -0.003
(0.003) (0.005)
Family firm ´ Local embeddedness ´ Firm context
0.012*
(0.006)
Household income (Instrumental variable) 1.026***
(0.110)
Instrument Household size (Instrumental variable) 3.302*** (0.096) Endogeneity score -0.002* -0.002** -0.002** -0.002** (0.001) (0.001) (0.001) (0.001) Wald Chi2 4,557.00 7,005.13 7,049.88 7,056.16 7,065.42 Prob > Chi2 0.000 0.000 0.000 0.000 0.000 N 15,658 15,658 15,658 15,658 15,658 + p<0.1; * p<0.05; ** p<0.01; *** p<0.001
28
FIGURE 1: Local embeddedness and business growth among family and non-family firms.
FIGURE 2: Local embeddedness, rural and urban contexts and business growth among family and non-family firms.
29
REFERENCES
Achtenhagen, L., Melin, L., & Naldi, L. (2013). Dynamics of business models– strategizing, critical capabilities and activities for sustained value creation. Long Range Planning, 46(6), 427-442.
Aiken LS, West SG. 1991. Multiple Regression: Testing and Interpreting Interactions. SAGE Publications: Newbury Park, CA.
Al-Laham, A., & Souitaris, V. (2008). Network embeddedness and new-venture
internationalization: Analyzing international linkages in the German biotech industry. Journal of Business Venturing, 23(5), 567-586.
Anand, J., & Singh, H. (1997). Asset redeployment, acquisitions and corporate strategy in declining industries. Strategic Management Journal, 99-118.
Arregle, J. L., Batjargal, B., Hitt, M. A., Webb, J. W., & Tsui, A. S. (2013). Family Ties in Entrepreneurs’ Social Networks and New Venture Growth. Entrepreneurship Theory and Practice, 39(2), 313-344.
Arregle, J. L., Hitt, M. A., Sirmon, D. G., & Very, P. (2007). The development of organizational social capital: Attributes of family firms. Journal of Management Studies, 44(1), 73-95.
Astrachan, J. H. (1988). Family firm and community culture. Family Business Review, 1(2), 165-189.
Astrachan, J. H., & Shanker, M. C. (2003). Family businesses’ contribution to the US economy: A closer look. Family Business Review, 16(3), 211-219.
Audretsch, D. B., & Dohse, D. (2007). Location: A Neglected Determinant of Firm Growth. Review of World Economics, 143(1), 79-107.
Backman, M. (2013), Regions, Human Capital and New Firm Formation, JIBS dissertation series No. 086, Jönköping International Business School, Jönköping Backman, M., & Palmberg, J. (2015). Contextualizing small family firms: How does the
urban–rural context affect firm employment growth? Journal of Family Business Strategy, 6(4), 247-258.
Baptista, R., & Preto, M. T. (2011). New firm formation and employment growth: regional and business dynamics. Small Business Economics, 36(4), 419-442. Basco, R. (2015). Family business and regional development—A theoretical model of
regional familiness. Journal of Family Business Strategy, 6(4), 259-271.
Benavides-Velasco, C. A., Quintana-García, C., & Guzmán-Parra, V. F. (2013). Trends in family business research. Small Business Economics, 40(1), 41-57.
Berrone, P., Cruz, C., & Gómez-Mejia, L. R. (2012). Socioemotional wealth in family firms: Theoretical dimensions, assessment approaches, and agenda for future research. Family Business Review, 25(3), 258-279.
Berrone, P., Cruz, C., Gómez-Mejia, L. R., & Larraza-Kintana, M. (2010).
Socioemotional wealth and corporate responses to institutional pressures: Do family-controlled firms pollute less?. Administrative Science Quarterly, 55(1), 82-113. Bird, M., & Wennberg, K. (2014). Regional influences on the prevalence of family
versus non-family start-ups. Journal of Business Venturing, 29(3), 421-436. Bjuggren, C. M., Daunfeldt, S. O., & Johansson, D. (2013). High-growth firms and
family ownership. Journal of Small Business & Entrepreneurship, 26(4), 365-385. Bjuggren, C. M., Johansson, D., & Sjögren, H. (2011). A note on employment and gross
domestic product in Swedish family-owned businesses: A descriptive analysis. Family Business Review, 24(4), 362-371.
Blackwell, M., Iacus, S., King, G., & Porro, G. (2009). Cem: Coarsened exact matching in Stata. Stata Journal, 9(4), 524.
30
Block, J. (2010). Family management, family ownership, and downsizing: Evidence from S&P 500 firms. Family Business Review, 23, 109-130
Block, J. H., & Spiegel, F. (2013). Family firm density and regional innovation output: An exploratory analysis. Journal of Family Business Strategy, 4(4), 270-280. Boix, R., & Trullén, J. (2007). Knowledge, networks of cities and growth in regional
urban systems. Papers in Regional Science, 86(4), 551-574.
Box-Steffensmeier, J. M., & Jones, B. S. (2004). Event history modeling: A guide for social scientists. Cambridge, UK: Cambridge University Press.
Bradley, S. W., Shepherd, D. A., & Wiklund, J. (2011). The importance of slack for new organizations facing ‘tough’environments. Journal of Management Studies, 48(5), 1071-1097.
Breitenecker, R. J., Harms, R., Weyh, A., Maresch, D., & Kraus, S. (2017). When the difference makes a difference–the regional embeddedness of entrepreneurship. Entrepreneurship & Regional Development, 29(1-2), 71-93.
Cabrera-Suárez, K., De Saá-Pérez, P., & García-Almeida, D. (2001). The succession process from a resource-and knowledge-based view of the family firm. Family Business Review, 14(1), 37-46.
Carnes, C. M., & Ireland, R. D. (2013). Familiness and innovation: Resource bundling as the missing link. Entrepreneurship Theory and Practice, 37(6), 1399-1419.
Carney, M. (2005). Corporate governance and competitive advantage in
family-controlled firms. Entrepreneurship theory and practice, 29(3), 249-265. Carree, M. A., & Thurik, A. R. (2003). The impact of entrepreneurship on economic
growth. In Handbook of entrepreneurship research (pp. 437-471). Springer US. Casillas, J. C., & Moreno, A. M. (2010). The relationship between entrepreneurial
orientation and growth: The moderating role of family involvement. Entrepreneurship and Regional Development, 22(3-4), 265-291.
Casillas, J. C., Moreno, A. M., & Barbero, J. L. (2010). A configurational approach of the relationship between entrepreneurial orientation and growth of family firms. Family Business Review, 23(1), 27-44.
Chang, E. P., Chrisman, J. J., Chua, J. H., & Kellermanns, F. W. (2008). Regional economy as a determinant of the prevalence of family firms in the United States: A preliminary report. Entrepreneurship Theory and Practice, 32(3), 559-573.
Chen W-R. 2008. Determinants of firms' backward- and forward-looking R&D search behavior. Organization Science 19(4): 609-622.
Chirico, F., Ireland, R. D., & Sirmon, D. G. (2011). Franchising and the family firm: Creating unique sources of advantage through “familiness”. Entrepreneurship Theory and Practice, 35(3), 483-501.
Chrisman, J. J., Chua, J. H., Pearson, A. W., & Barnett, T. (2012). Family involvement, family influence, and family-centered non-economic goals in small firms.
Entrepreneurship Theory and Practice, 36(2), 267-293.
Cliff, J. E. (1998). Does one size fit all? Exploring the relationship between attitudes towards growth, gender, and business size. Journal of business venturing, 13(6), 523-542.
Cohen, W. M., & Levinthal, D. (1990). Absorptive capacity: A new perspective on learning and innovation, Administration Science Quarterly 35, 128–152.
Colombo, M. G., & Grilli, L. (2005). Founders’ human capital and the growth of new technology-based firms: A competence-based view. Research Policy, 34(6), 795-816. Colombo, M. G., De Massis, A., Piva, E., Rossi-Lamastra, C., & Wright, M. (2014).
31
Empirical Evidence from High-Tech Industries. Journal of Small Business Management, 52(2), 226-245.
Cooke, P. (2007). Social capital, embeddedness, and market interactions: An analysis of firm performance in UK regions. Review of Social Economy, 65(1), 79-106.
Cooke, P., Clifton, N., & Oleaga, M. (2005). Social capital, firm embeddedness and regional development. Regional Studies, 39(8), 1065-1077.
Dahl, M. S., & Sorenson, O. (2012). Home Sweet Home: Entrepreneurs' Location Choices and the Performance of Their Ventures. Management Science, 58(6), 1059-1071.
Daily, C. M., & Dollinger, M. J. (1992). An empirical examination of ownership structure in family and professionally managed firms. Family Business Review, 5(2), 117-136.
Danes, S. M., Lee, J., Amarapurkar, S., Stafford, K., Haynes, G., & Brewton, K. E. (2009). Determinants of family business resilience after a natural disaster by gender of business owner. Journal of Developmental Entrepreneurship, 14(04), 333-354.
Daspit, J. J., Holt, D. T., Chrisman, J. J., & Long, R. G. (2016). Examining family firm succession from a social exchange perspective: a multiphase, multistakeholder review. Family Business Review, 29(1), 44-64.
Davidsson, P., & Honig, B. (2003). The role of social and human capital among nascent entrepreneurs. Journal of Business Venturing, 18(3), 301-331.
Davidsson, P., & Wiklund, J. (2006). Conceptual and empirical challenges in the study of firm growth. Entrepreneurship and the Growth of Firms, 1(1), 39-61.
Davidsson, P., Achtenhagen, L., & Naldi, L. (2010). Small firm growth. Foundations and Trends in Entrepreneurship, 6(2), 69-166.
Dawson, J. F., & Richter, A. W. (2006). Probing three-way interactions in moderated multiple regression: development and application of a slope difference test. Journal of Applied Psychology, 91(4), 917.
De Figueiredo R. J. P., Meyer-Doyle P., Rawley E. (2013). Inherited agglomeration effects in hedge fund spawns. Strategic Management Journal 34(7), 843-862.
Deephouse, D. L., & Jaskiewicz, P. (2013). Do family firms have better reputations than non-family firms? An integration of socioemotional wealth and social identity
theories. Journal of management Studies, 50(3), 337-360.
Delmar, F. (1997). Measuring growth: Methodological considerations and empirical results. In R. Donckels & A. Miettinen (Eds.), Entrepreneurship and SME Research: On itsWay to the Next Millennium (pp. 190-216). Aldershot, UK and Brookfield, VA: Ashgate.
Delmar, F., Davidsson, P., & Gartner, W. B. (2003). Arriving at the high-growth firm. Journal of Business Venturing, 18(2), 189-216.
Dicken, P., & Malmberg, A. (2001). Firms in territories: a relational perspective. Economic Geography, 77(4), 345-363.
Duranton, G., and Puga, D. (2004). Micro-foundations of urban agglomeration economies. In J. V. Henderson and J.-F. Thisse (Eds.), Handbook of Regional and Urban Economics (Vol. Volume 4, pp. 2063-2117). Amsterdam: Elsevier.
Eddleston, K. A., Kellermanns, F. W., Floyd, S. W., Crittenden, V. L., & Crittenden, W. F. (2013). Planning for growth: Life stage differences in family firms.
Entrepreneurship Theory and Practice, 37(5), 1177-1202.
Eisenhardt, K. M., & Schoonhoven, C. B. (1990). Organizational growth: Linking
founding team, strategy, environment, and growth among US semiconductor ventures, 1978-1988. Administrative Science Quarterly, 504-529.
32
Falk, I., & Kilpatrick, S. (2000). What is social capital? A study of interaction in a rural community. Sociologia ruralis, 40(1), 87-110.
Felzensztein, C., Gimmon, E., & Carter, S. (2010). Geographical co-location, social networks and inter-firm marketing co-operation: the case of the salmon industry. Long Range Planning, 43(5-6), 675-690.
Finkelstein, S. (1992). Power in top management teams: Dimensions, measurement, and validation. Academy of Management journal, 35(3), 505-538.
Fitzgerald, M. A., Haynes, G. W., Schrank, H. L., & Danes, S. M. (2010). Socially responsible processes of small family business owners: Exploratory evidence from the national family business survey. Journal of Small Business Management, 48(4), 524-551.
Gabe, T. M., & Kraybill, D. S. (2002). The Effect of State Economic Development Incentives on Employment Growth of Establishments. Journal of Regional Science, 42(4), 703-730.
Ganotakis, P. (2012). Founders’ human capital and the performance of UK new technology based firms. Small Business Economics, 39(2), 495-515.
Gedajlovic, E., & Carney, M. (2010). Markets, hierarchies, and families: Toward a transaction cost theory of the family firm. Entrepreneurship Theory and
Practice, 34(6), 1145-1172.
George, G. (2005). Slack resources and the performance of privately held firms. Academy of Management Journal, 48(4), 661-676.
Gilbert, B. A., McDougall, P. P., & Audretsch, D. B. (2006). New venture growth: A review and extension. Journal of Management, 32(6), 926-950.
Gómez-Mejía, L. R., Haynes, K. T., Núñez-Nickel, M., Jacobson, K. J., & Moyano-Fuentes, J. (2007). Socioemotional wealth and business risks in family-controlled firms: Evidence from Spanish olive oil mills. Administrative Science Quarterly, 52(1), 106-137.
Gómez-Mejia, L.R., Cruz, C., Berrone, P., & De Castro, J., (2011). The bind that ties: socioemotional wealth preservation in family firms. The Academy of Management Annals, 5, 653–707.
Gómez-Mejia, L. R., Campbell, J. T., Martin, G., Hoskisson, R. E., Makri, M., & Sirmon, D. G. (2014). Socioemotional wealth as a mixed gamble: Revisiting family firm R&D investments with the behavioral agency model. Entrepreneurship Theory and Practice, 38(6), 1351-1374.
Grabher, G. (1993). The weakness of strong ties: The lock-in of regional development in Ruhr area. The embedded firm: On the socioeconomics of industrial networks, 255-277.
Granovetter, M. S. (1973). The strength of weak ties. American Journal of Sociology, 78(6), 1360-1380.
Grant, R. M. (1991). The resource-based theory of competitive advantage: implications for strategy formulation. California Management Review, 33(3), 114-135.
Habbershon, T. G., & Williams, M. L. (1999). A resource-based framework for assessing the strategic advantages of family firms. Family Business Review, 12(1), 1-25.
Hambrick, D. C., & Mason, P. A. (1984). Upper echelons: The organization as a reflection of its top managers. Academy of management review, 9(2), 193-206 Hamelin, A. (2013). Influence of family ownership on small business growth. Evidence
from French SMEs. Small Business Economics, 41(3), 563-579. Hannan, M. T., & Freeman, J. (1977). The population ecology of