A i m Fo r T h e S t a r s
- I s i t w o r t h p a y i n g h i g h e r f e e s f o r f u n d s w i t h i n t h e
M o r n i n g s t a r R a t i n g
T Ms y s t e m
Master’s thesis in Corporate Finance Author: Fadilj Sadiku
Samir Cherro
Tutors: Per-Olof Bjuggren, Professor Louise Nordström, PhD Jönköping May 2011
2
Acknowledgements
Firstly, we would like to express our gratitude to our tutors Per-Olof Bjuggren and Louise Nordström for assisting and guiding us through this thesis, and for all the feedback we have received throughout this process.
We would also like to thank Peter Karlsson at Jönköping International Business School for guiding us through the statistical methods.
Furthermore, we are also thankful for the comments made by our fellow seminar students at Jönköping International Business School, for helping us improve this master thesis.
……… ………
Samir Cherro Fadilj Sadiku
3
Master-Thesis within Corporate Finance
Title: Aim For The Stars – Is it worth paying higher fees for funds within the
Morningstar RatingTM system
Author: Cherro, Samir & Sadiku, Fadilj
Tutor: Per-Olof Bjuggren and Louise Nordström Date: [2011-05-23]
Subject terms: Mutual Fund Performance, Morningstar Rating System, Total Expense Ratio, Risk-Adjusted Performance
Abstract
Morningstar is an independent provider of investment research and provide information on approximately 380 000 investment offerings about mutual funds. Morningstar are most known for their “star” rating system, which rates funds from the lowest 1-star to the highest 5-stars.
Since investors frequently use fund data provided by Morningstar, we will evaluate whether investing in funds with higher fees and higher ratings would end up with higher returns. Examinations will be made if there is a relationship between mutual fund performance and the management fees within top-rated (5-star) funds and bottom-rated (1-&2-star).
The mutual funds which are included in this thesis are United Kingdom (UK) managed and invested in three different markets; Asia-Pacific except-Japan, Europe except UK-Large Cap, and the United States (US) Market. This allows us to compare different markets at different stages of maturity.
The results clearly show that the top-rated funds within all three markets outperformed the bottom-rated funds. Furthermore, the results demonstrate that the investor in general will earn a higher return by paying a higher management fee (TER) for the top-rated funds in all regions. The results also show that the TER for the bottom-rated funds in Europe and US market is higher compared to the top-rated funds. This means that the investor will pay higher fees for funds that do not perform well.
4
Table of Contents
ACKNOWLEDGEMENTS ... 2
1 INTRODUCTION ... 6
1.1 BACKGROUND... 6
1.2 PROBLEM AND PURPOSE ... 7
1.3 LIMITATIONS ... 8
1.4 PREVIOUS STUDIES ... 8
2 INSTITUTIONAL CHARACTERISTICS ... 10
2.1 MUTUAL FUNDS ... 10
2.1.1 OPEN-END AND CLOSED-END MUTUAL FUNDS ... 10
2.2 TOTAL EXPENSE RATIO ... 11
2.3 MORNINGSTAR,INC ... 12
2.3.1 MORNINGSTAR FUND CATEGORIES ... 12
2.4 MORNINGSTAR RATINGTM SYSTEM ... 14
3 THEORETICAL FRAMEWORK... 17
3.1 MODERN PORTFOLIO THEORY ... 17
3.1.1 ACTIVE MANAGEMENT VS.PASSIVE MANAGEMENT ... 17
3.2 RISK AND RETURN ... 18
3.3 RISK-ADJUSTED PERFORMANCE MEASURES ... 19
3.4 RISK DIVERSIFICATION ... 20
3.5 RISK FREE RATE ... 21
4 DATA AND METHOD ... 22
4.1 DATA COLLECTION ... 22 4.1.1 STANDARD DEVIATION ... 23 4.1.2 SHARPE RATIO ... 24 4.1.3 TOTAL RETURN ... 24 4.1.4 MEAN RETURN ... 24 4.1.5 RETURN ON INVESTMENT ... 25
5 RESULTS AND ANALYSIS ... 26
5.1 ALL REGIONS OVERVIEW ... 26
5.2 RISK-ADJUSTED PERFORMANCE (SHARPE RATIO) VS.TER... 28
5.3 RETURN ON INVESTMENT ... 31
5.4 ASIA PACIFIC EX.JAPAN REGION ... 32
5.5 EUROPE EX.UK-LARGE CAP REGION ... 35
5.6 USMARKET ... 38
6 SUMMARY OF THE ANALYSIS ... 41
7 CONCLUSION ... 43
5 9 *LIST OF REFERENCES ... 46 10 APPENDICES ... 50 APPENDIX 1 ... 50 APPENDIX 2 ... 51 APPENDIX 3 ... 52 APPENDIX 4 ... 53
6
1
Introduction
The introduction starts with an overview of the background which will be linked with the problem and purpose. The limitations and previous studies are presented by the end of the chapter.
1.1 Background
Investing in mutual funds became increasingly popular in the 1990s. The US total net assets of mutual funds grew from USD 1.6 trillion in 1992 to USD 5.5 trillion in 1998. During the same time-frame Europe had the same increasing trend in their total mutual fund assets. Countries such as Belgium, Finland, Denmark and Ireland all increased with growth rates around 35%. UK was not an exception, the increasing popularity of investing in mutual funds year 1992 was 8, 68% of Gross Domestic Product (GDP). After six years, money invested in mutual funds increased to 21, 31% of GDP and is still growing. One fundamental reason that contributed to the popularity seemed to be the simplicity and the professional help which is associated with investing in mutual funds (Fernando et al., 2003).
A simple way of finding mutual funds is the wide range database of Morningstar. This is a frequently used tool that is helpful and reliable for the investors. (Gerrans, 2004). Morningstar created the Morningstar RatingTM were funds are rated from lowest rating 1-star to the greatest 5-stars. This rating system has helped investors worldwide to pick the best funds (Gerrans, 2004; Knuutila et al., 2006). According to Tkac and Del Guercio (2001), “… investors actually use Morningstar rating in their
decision-making” (Tkac and Del Guercio, 2001). Within this rating system, a high percentage is
invested in the 5-star rated funds. (Morningstar, 2011)
The Morningstar Rating system is also used by companies when marketing their mutual funds. Instead of marketing with their own return history of the mutual funds, the companies use Morningstar Rating system which confirms the popularity among retail investors. (Morningstar, 2011).
7
1.2 Problem and Purpose
The purpose is to evaluate if it is efficient to invest in funds with higher fees within the Morningstar Rating™ system.
Since investors frequently use fund data provided by Morningstar, it is interesting to evaluate whether investing in funds with higher fees would end up with higher returns. Research will be made whether the return will be higher if the investor buy mutual funds with higher fees than mutual funds with lower fees in the top-rated (5-star) and the bottom-rated (1&2-star) funds according to the Morningstar Rating™. We have chosen three different regions to see if the results would differ in the regions examined. The regions consist of two mature markets and one emerging market.
In order to clarify the research’s agenda, question formulations have been listed which the reader should have in mind when reading the study. The research answering the questions listed below.
Is it more efficient to invest in funds with higher fees than lower fees when looking at the 5-star rated funds and the 1&2-star rated funds?
Would the return be higher if investing in 5-star rated funds rather than in 1&2-star rated funds?
How does the Total Expense Ratio (TER) differ between the top-rated and bottom-rated funds?
The research only includes UK managed mutual funds. This due to that the UK economy is the 6th largest economy in the world (2010), and is an influential part of the world economy. (UK National Statistics 2010)
The research is based on a private investor’s perspective. Hence the examinations and analysis is to see whether it is efficient to invest in funds with higher fees compared to the funds with lower fees within the same rating category fund. Another aspect that is interesting for private investors is to see if it is efficient to invest in the higher or lower rated funds according to Morningstar Rating™. Therefore, the results from the statistical analysis will be useful for us as investors, and will also be of interest for students with a major in finance and lecturers within finance and economics.
8
1.3 Limitations
The examination of this research is focused on a timeframe of five years, 2006-2010. Although it would be more interesting for the research if we would have a longer timeframe, this would decrease our sample significantly. Due to that most of the funds, especially in Asia Pacific region that has not been into the market for longer than five years. Only UK managed funds are taken into account, currencies other than the Sterling Pound £ (GBP) is excluded.
Mutual funds with 5-, 1- and 2-star according to the Morningstar Rating™ will only be included in the research. The 5-star rated funds is seen as one category and the 1- and 2-star rated is the second category. This will allow us to compare the funds that are top-rated (5-stars) with the bottom-top-rated funds (1&2-stars).
The mutual funds are categorised according to Morningstar Rating™ stars and by Morningstar Category™. The three categories examined are listed from Morningstar Category™, Asia-Pacific except-Japan (Asia-Pacific), Europe except-UK-Large Cap (Europe), and US Market1. Since Morningstar is a world leading, widely accepted and independent investment research company, the information that has been collected can be seen as reliable. (Morningstar, 2011)
1.4 Previous Studies
Previous findings about the Morningstar RatingTM have been made of whether the rating could prospect future returns. Almblad and Hellquist (2005) made a research to examine if the future return would be higher for the higher rated funds compared to the lower rated funds. They categorised the funds according to high-, low-, and middle-risk funds. It was found that in the low risk category, the top rated funds had higher returns. However, between the star rated funds there were no significant differences in the returns. The middle risk funds did not show any relationship between the rating and the future return, hence they found out that the top rated funds performed worse than the low rated funds. In the last category with the high risk funds, they found out that some of the low rated funds had higher return than the top rated funds, therefore they believe
1 The US Market consists of 4 regions, US Large-Cap Blend Equity, US Large-Cap Growth Equity, Us
9
that the Morningstar RatingTM is to some extent ambiguous. (Almblad and Hellquist, 2005)
Studies about mutual funds performance compared to the market index were first made in the US market by William F. Sharpe (1966) and Michael C. Jensen (1968). Sharpe made an evaluation of 34 mutual funds in a 10-year timeframe (1954-1963). The Sharpe ratio method was used to evaluate the mutual funds performance. He came up with the results that it is more efficient to invest in funds with lower fees than the higher fees funds, “…the smaller a fund’s expense ratio, the better the results obtained by its
stockholders” (Sharpe, 1966). However, to properly evaluate this, Sharpe mentions that
further studies is required.
Michael C. Jensen (1968) made a performance evaluation of 115 mutual funds between 1945-1964, where data was collected between 1955-1964. He found that there is no evidence of managerial skills and thus it is inefficient to hire professional managers to take care of your investment. (Jensen, 1968)
Earlier studies regarding the correlation between fees, return and the risk-adjusted performance have been conducted with diverse results. Bechmann and Rangvid (2007), Gruber (1996) and Ennis (2005), all found that there is a negative relationship between fees and return.
Most of the previous studies have showed a negative relationship between the management fee and the return, in other words they conclude that it is not efficient to invest in funds with higher fees. However, Ippolito (1989) found opposite evidence. Ippolito made a research (1989) between 1965-1985 where he analyzed 143 mutual funds. He used the same calculations as previously mentioned Jensen. The conclusion of his study indicate that the mutual funds is consistent with optimal trading in efficient markets, which means that it is efficient to invest in funds with high fees. (Ippolito, 1989)
10
2
Institutional Characteristics
This section will present important information about mutual funds and the fees related
to it. In addition, information about the Morningstar CategoriesTM and the Morningstar
RatingTM will be presented.
2.1 Mutual Funds
Mutual funds can be defined as a pooled investment managed by professional managers, with an incentive to generate a high return. The managers within the investment companies select a group of stocks, which are sold to the investors in form of a single package. Since the investors purchase shares or portions of the fund, it makes them a shareholder of the fund. (Economywatch, 2011)
Mutual funds are seen as a low risk investment for investors who are investing for the first time. This is mainly due to the fund managers and their knowledge within their field. In this way the mutual funds are constructed for people with other day-to-day activities. Another important aspect regarding mutual funds is that the investment is risk diversified. It means that even if a particularly stock goes down within the fund, the others still have the chance of increasing the net asset value of the fund. (Mutual Fund facts, 2011)
It is also important that the investor is aware of the fees that are associated with investing in mutual funds. The investment companies express the mutual fund fees as the Total Expense Ratio (TER).
2.1.1 Open-end and Closed-end Mutual Funds
Mutual funds can be divided into two different types; open-end funds and closed-end funds. Open-end shares are purchased and sold directly from the mutual fund at the value of the net assets standing behind each share. This net value is determined once a day at a specific time. When investing in mutual funds the investor must have in mind that some mutual funds charge a fee when the investor buys a fund (front-end load) and some charge additional fees (end load) when selling shares in a fund. The back-end loads very often decrease as a function of the amount of time the investor holds the fund. (Gregoriou, 2006)
11
Closed-end funds are sold at a predetermined number of shares in the fund. The proceeds minus the cost are then taken from the sale and invested in stocks and bonds. The shares are then traded on an exchange. Closed-end funds can be compared as owning a share in a corporation, but in this case the assets of the corporation are stocks and bonds. Closed-end funds differ from the open-end funds in that the shares of a closed-end fund can sell at a discount or a premium to their net asset value. Premiums and discounts are related to the perceived quality of management and certain tax liabilities. (Gregoriou, 2006)
2.2 Total Expense Ratio
When investing in funds there are many different fees and costs involved, depending on the fund companies and the type of fund. In order to facilitate comparisons between mutual fund fees, the Total Expense Ratio (TER) has been developed. The TER includes the manager’s annual fee, and additional fees such as share registration fees, legal fees, custodian fees. The trading costs (buying and selling shares within the fund), are not included. This means that if the manager is trading more, the costs would be higher. The actively managed funds can therefore be seen as more expensive than the passive managed funds. (Farrow, 2010)
The purpose of the TER is to provide the investor with information about the total annual fees that are involved in managing a mutual fund, which is a cost to the investor. It also allows the investor to make comparisons between the fund fees in different countries, since the TER is compiled in the same way. (Morningstar, 2011)
In a study made by US and UK companies where 20 fund companies are examined (registered both in US and Europe), analyses the differences in TERs. The study clearly shows that actively managed mutual funds in USA has an average TER on 0,992 percent, while the actively managed funds in Europe has an average of 1,79 percent a year. (Moisson, 2009). According to the study, one reason for this could be that the mutual funds in the US are in average larger, which gives an advantage in the economy of scale. Another possible reason could be that managers in the US seem to have a higher focus on investing in funds with a lower TER (Khorana et al., 2008).
12
2.3 Morningstar, Inc
Morningstar, Inc is an independent provider of investment research in North America, Europe, Australia, and Asia. Morningstar provides information on approximately 380 000 investment offerings, about mutual funds, and similar media. They also provide real-time global market data on more than 4 million equities, indexes, futures, options and commodities. Morningstar have operations in 26 countries and is widely accepted in the market. (Morningstar, 2011)
Morningstar in the UK opened in London in 2000 and introduced the investing website in the following year. The Morningstar UK website includes information on more than 9,000 funds available for individual investors in the UK. The website includes independent editorial content created by analysts in Morningstar and journalists all around the world. (Morningstar, 2011)
The Morningstar website in the UK also provides products and services to advisers and institutions such as the Morningstar® Adviser Workstation™, a web-based investing planning system, and Morningstar Direct™, a web-based institutional platform providing global databases and investment research. (Morningstar, 2011)
2.3.1 Morningstar fund categories
The Morningstar Category™ is a classification system constructed by Morningstar, Inc. The Morningstar Category™ groups the funds which can be considered to be close investment alternatives, for which performance and other statistical measures are comparable. The classification system contributes to a more efficient fund selection for institutions, advisers and investors. The Morningstar categoryTM classification system has achieved a wide market acceptance, and according to Morningstar it has been designed to ensure;
Performance comparisons can be made within groupings where both volatility and return can be justifiably compared;
Statistical analysis, including ratings, within groupings can be justifiably compared;
Easy choice of competing funds and market analysis through a logical referencing scheme;
13
Analysis does not suffer from inconsistency of taxation treatment; and A classification system which is easily-understood, user-friendly,
technically-defensible, and able to be implemented within reasonable timeframes.
Asia/Pacific except Japan
Funds within the Asia/Pacific except Japan (Asia-Pacific) cover a wide geographic range. The funds are invested in any Asian nation (except Japan), and also in New Zealand and Australia. The majority of the funds are focused on export-oriented countries such as Hong Kong, Singapore, Taiwan and Korea. Since most of the countries in the Asia Pacific region are emerging markets, the funds tend to be volatile. The securities in Asia pacific region are typically account for at least 75 percent of the portfolio.
Europe except UK Large-Cap Equity
The category Europe ex-UK Large-Cap Equity (Europe) includes funds invested at least 75 percent stock assets in Europe based companies. Most of the funds are focused on regions with larger and more developed markets such as the Netherlands, Germany, France and Switzerland. The funds are also invested in smaller markets, such as the emerging markets of Eastern Europe.
US market
Morningstar have categorised the US market in to four different categories; US Large-Cap Blend Equity, US Large Value Equity, US Mid-Large-Cap Equity and US Small-Large-Cap Equity.
The funds within the US market categories are all invested in securities of companies listed in the US and securities from the US which account for at least 75 percent of the portfolio. The Large-Cap Blend Equity funds focus on portfolios that are even distributed in the stock market, in terms of size, growth rates and price. The funds are
14
primarily invested in large US companies and the funds return are often similar to those of the S&P 500 Index.
The funds in the US Large Value Equity category are characterized by low stock valuations and low growth rates. The funds are invested in big companies that are less expensive or growing more slowly than other large-cap stocks. Stocks in the top 70 percent of the capitalization of an equities market are defined as large-cap, and are often invested in energy, financial or manufacturing sectors.
US Mid-Cap Equity and Small-Cap Equity include portfolios that are mainly invested in technology, healthcare, and service sectors. Since these two categories tend to be fast-growing and richly valued, the stocks tend to be volatile.
2.4 Morningstar Rating
TMsystem
The Morningstar RatingTM for funds was introduced in 1985 and is often called the “star rating system”. The rating system was quickly established and used by investors and advisors worldwide. It is a quantitative assessment of funds past performance, which includes both, return and risk, and measures funds from 1 to 5 stars: one being the worst; five being the best. It can be seen as a tool for investors when making investment decision and includes a time period of 3, 5 and 10 years for the funds. The Morningstar RatingTM categorizes the funds based on similar bases, that they share similar risks and similar investment strategies. This makes it easier to evaluate funds within the same category and allows the investors to make better decisions when investing in the mutual funds (Morningstar, Morningstar Rating for Funds, 2010).
How the Morningstar RatingTM system works
The rating is based on the mutual funds excess return under the last 36, 60 and 120 months, and includes the funds historical volatility and the fees associated with the funds (Morningstar, Morningstar Rating for Funds, 2010).
15
When rating the funds, Morningstar use a Risk-Adjusted Return formula (MRAR), as illustrated in figure 1. [ ∑( ) ]
Figure 1, Morningstar Risk-Adjusted Return Formula (Morningstar 2010)
The y is a constant risk tolerance parameter and the rt is the monthly excess return.
When ranking the funds, Morningstar analysts have concluded that y=2 results in a mutual fund ranking that is consistent with the risk tolerance of a typical investor. The analysts then calculate the MRAR for t= 36, 60, and 120 months. If the mutual fund is younger than 36 months, Morningstar will not rate the fund. When Morningstar finished the ranking of the mutual funds, each mutual fund will be rated within a specific category according to Morningstar’s bell curve in the figure 2. (Morningstar,
Classifications, 2010).
Figure 2, Bell Curve (Morningstar, Classification, 2010)
Figure 2 shows a percentage of how many funds out of a specific category that will get the given rating. According to Morningstar, the rating will not be as affected by the market itself. They claim that the rating will rather be affected by the fund manager who is managing the fund. This implies that an unskilled manager thus will get fewer stars than a better one, given that they are affected by the same market risk.
16
Figure 3, Rating System (Morningstar, Classification, 2010)
According to Morningstar, the most important factors in their rating system are the categories, the risk-adjusted return rate and the fees. Even though their rating system is used by many investors and accepted in the branch, Morningstar state on their website that it is not an exact science. They state that the rating system should be used as a first screening process for investors, and not used as a financial tool to predict a funds future performance. (Morningstar, Classifications, 2010)
Age of fund
Overall Rating
At least three years, but less than five 100% three-year rating At least five years, but less than 10 60% five-year rating
40% three-year rating
At least 10 years 50% 10-year rating
30% five-year rating 20% three-year rating
17
3
Theoretical Framework
The following chapter introduces the theories associated with the research subject, it consists of an overview of the types of managers, and information about the risk measures.
3.1 Modern Portfolio Theory
3.1.1 Active Management vs. Passive Management
Active managers have the objectives that through combination of stock selection and market timing, to successfully outperform an investment benchmark index. By relying on information such as forecasts, analytical research, own experiences and judgments they come to a conclusion of which security to buy, hold, or sell. (Elton et al., 2007) In comparison, the passive managers believes that mispriced securities cannot be identified and therefore hold a portfolio that imitates the market, e.g. stocks that very much follow selected indexes. Passive managers generally buy each stock in an index, or alternatively various stocks in one index. By investing in mutual funds that are passive managed, the return tend to follow the index, hence they succeed to “match” the index which is their aim. (Elton et al., 2007)
The fee when investing in mutual funds that is managed by active management is usually higher than investing with passive management, Also the risk is considered higher than investing in passive managed funds. (Elton et al., 2007)
Active managers typically take advantage of buying securities that are undervalued or short sell securities that is overvalued. They believe that the market is not completely efficient, therefore the efficient market hypothesis is ignored. Passive management argues against this statement and means that as time goes by, more information will be available therefore it will be more difficult to beat the market index. “They assume that
the market is already efficient which means that the market represent all available information and there is no mispriced security, they reflect the true value, so there is no large opportunities of taking advantage of mispricing” (Elton et al., 2007)
A great advantage of active management is that the investors choose the successful managers that can beat the market and earn a high return. In other terms, the individual
18
investor has to take a risk and try to select the winning manager that will result in better returns. (Elton et al., 2007)
The benefits of the passively managed portfolio is that in the long run, the return will be good, hence you know that the expected return of your portfolio will almost reflect the market the fund is invested in. Burton Malkiel, who has researched about this subject, states “The S&P 500 Index beat approximately two-thirds of professional managed
portfolios in the 1980s and 1990s. Index funds have regularly produced rates of return exceeding those of active managers by close 2%” (Malkiel, 1999)
3.2 Risk and return
The funds are all involved with some kind of risk and expected return. The rational investor will always invest in funds with the lowest risk at the highest possible return. (Campell, 1996)
Information on mutual funds risk and return are often represented by four different statistics; alpha, beta, standard deviation and the Sharpe ratio. The beta of a fund indicates the past price volatility of the fund in relation to a standard stock market index. The beta for stock funds is usually between 0.85 and 1.05. Alpha measures the funds expected return based on the beta. A fund with a positive alpha implies that the return is higher than what was expected. A negative alpha indicates that the fund return is less than expected. (Damodaran, 2002)
The risk can be calculated in different ways but the most common used is the standard deviation. The calculation shows how the fund has fluctuated during a given time. The standard deviation should not be used by itself as a risk measure when analyzing funds. It should instead be used in conjunction with the rate of return. (Elton et al., 2007)
When investing in mutual funds, the investor generally does not have the same level of high return as investing in stocks, but a significant lower risk. The risk and return for a mutual fund strongly depends on the type of fund. For example, small capitalization funds generally own stocks of companies with less than $1 billion in market
19
capitalization, and can generate high return but carry a high risk. Another example is when investing in Large-Cap funds, which means investing in companies with market capitalization of USD 8 billion or more. This type of funds usually focuses more on income from dividends, and often offers a stable return. (Damodoran, 2002)
When choosing a fund, the investor must consider the different risks that are associated with investing in mutual funds. The basics is that the stock market tends to move in cycles, which mean that if the market drop it is likely that the value of the fund also will drop. Another risk that is associated with investing in mutual funds is when investing in foreign markets. Emerging markets tend to involve higher risks than funds that are invested in the UK. Investing in foreign countries also involves currency risk, income risk, manager risk and inflation risk, which all must be taken into consideration. (Elton et al., 2007)
3.3 Risk-Adjusted Performance Measures
Another important measure is the Sharpe ratio which measures the risk-adjusted performance for the fund. The Sharpe ratio is one of several different risk-adjusted performance measures. Some other common used measures are; Jensen’s alpha (1968) and Treynor. Jensen’s alpha compares the average return with the expected return according to the Capital Asset Pricing Model. The Treynor index is similar to the Sharpe ratio. The main difference is that the portfolios beta is considered the measure of risk as opposed to the variance of portfolios return. The Treynor index is thereby based on systematic risk, compared to the Sharpe ratio that is based on the total risk of the fund (Levine et al., 2009).
The Sharpe ratio was developed by William F. Sharpe (1966) and measures the risk-adjusted performance. The Sharpe ratio explains how much excess return an investor are receiving for the extra volatility that the investor endure for holding an asset with a higher risk. It is based on the trade-off between risk and return, which implies that the higher the ratio is, the more the fund gives in return per risk. In comparison to other ratios, the Sharpe ratio observes both systematic risk and idiosyncratic risk. The investor should therefore invest in a fund with the best combination of risk and return, which will be the most efficient fund. (Sharpe, 1966)
20
A weakness regarding the Sharpe ratio is that it sometimes can be difficult to conclude how a small difference in the ratio will affect the investor. How does for example a 0,5 difference in ratio affect the investor in GBP. (Elton et al., 2007)
3.4 Risk Diversification
The risk can be reduced through diversification, but even an optimal diversified portfolio cannot eliminate all the risk. This is due to that there are two different types of risks; the systematic risk, and the specific risk. The specific risk, also called the unsystematic risk is associated with individual assets. By adding more securities to the portfolio, the specific risk can be reduced. The systematic risk or the market risk refers to the risk common to all the securities, and cannot be diversified away. Ross et al illustrates in figure 4 how the specific risk can be reduced by increasing the securities within a portfolio. The figure also illustrates that the systematic risk cannot be diversified away after a point, the more securities invested in. This infers that at a certain point, the risk will not be reduced even if adding more securities to the portfolio. (Lintner, 1965)
21
3.5 Risk Free Rate
The risk-free rate is required when calculating the Sharpe ratio. It is assumed that by investing in a risk-free government bond, as the title says, it is without a risk. Hence by calculating the risk-free rate in the Sharpe ratio, you can see if it would be more efficient to invest in a government bond instead of a mutual fund. It is always preferred to invest in a short-term 3 month treasury-bill instead of the long-term bond. (Damodoran, 2002)
22
4
Data and Method
This section will present the progress of the funds data collection and the statistical methods used to evaluate the results of the research.
4.1 Data Collection
All fund data is collected from Morningstar’s website. The return is based on each year of five years, which gives us five different returns for each fund. In order to give us comparable results of the research, assumptions have been made:
The TER is assumed to be constant over these 5 years.
There are no transactions and sales charge.
The actual minimal initial purchase is not taken into consideration.
In the investment example, GBP 100 000 has been invested in January 2006 with no transactions during five years.
The purpose of the assumption that the TER is to be constant over the timeframe is due to that we want to examine the whole timeframe and not only the differences year by year. Since we will compare each mutual fund’s return and fee, the total fees that is taken into account is expressed as the TER. The mutual funds that did not have a given TER were therefore excluded. In this way comparisons between the funds can be made correctly.
When comparing the mutual funds between each region, to get a larger population, the following four US regions are considered as one market (US Market). The merge consist of; US Large-Cap Blend Equity, US Large-Cap Growth Equity, US Large-Cap Value Equity, and US Small-Cap Equity.
In order to acquire more efficient results and comparisons between the mutual funds and between the regions, all mutual funds that fulfill our limitations is examined in each region. Therefore, all available mutual funds in each region has been examined, which means that the whole population is tested and not only the sample of the population. The funds that did not meet our criteria’s were excluded. 118 mutual funds have been studied.
23
35 funds in Asia Pacific except Japan (Asia-Pacific)
42 funds in Europe OE Europe except UK Large-Cap (Europe)
41 funds in US Market
All mutual funds is collected and presented on a spreadsheet in Excel (Appendix 1). The funds are divided by stars and by regions, giving us three sheets with one region on each sheet2. In each sheet, the funds are divided according to their star rating. The funds rated with 5-stars are in one category and are compared with the second category that consists of funds that has 1-and 2-stars. Each fund has a yearly-based return during five years which data is collected from Morningstar. The total return and total average return for five years for each fund is calculated, also the average return for all funds is calculated each year. The TER is assumed to be constant over these five years. The average return for each fund is calculated. By this structure, it will be easier to make comparisons between the funds in the specific category and between the each two star-categories. To compare the regions, a total return and total average return calculation for each region has been made. The comparison can be read on the overview spreadsheet. To understand the relationship between the return and the management fee better, an assumption of investing £ 100 000 is made in each fund. By having the same amount of investment in each fund, it will be easier to analyze and compare the effect from the fee and the return.
4.1.1 Standard Deviation
The standard deviation formula is as following:
√[ ( ) ] Where,
= Standard deviation = Number of quarters
= Average return every quarter
2 Overview table of the regions is on appendix 1. Each specific region can be found in appendix 2, 3, and
24 = Funds return at the given time period (Elton et al., 2007)
4.1.2 Sharpe Ratio
In order to measure the risk-adjusted performance for the funds, the Sharpe ratio has been used.
is the fund’s return is the risk free rate is the standard deviation (Sharpe, 1966)
4.1.3 Total Return
where:
= Total Return for fund a
a = the fund
= average return for year 1 (2006) = average return for year 2 (2007) = average return for year 3 (2008) = average return for year 4 (2009) = average return for year 5 (2010) 4.1.4 Mean Return
The calculations for the average return for each fund for five years is as following:
where
Y = the average return for fund x = the return for each year
25 n = how many years (n=5)
The average return for all funds in each specific year is calculated as following:
where:
Y = the average return for fund x = the return for each year n = how many years (n=5)
4.1.5 Return on Investment
The return on the £ 100 000 investment is calculated as following: ( ) ( ) ( ) ( ) ( )
where
= the return on investment for fund a
a = the fund
= the return for year 1 (2006) = the return for year 2 (2007) = the return for year 3 (2008) = the return for year 4 (2009) = the return for year 5 (2010) (Cherro & Sadiku, 2011)
26
5
Results and Analysis
The results and analysis of the calculations will be presented in this chapter. The chapter starts with an overview of the results for all regions following a more detailed result for each region.
5.1 All Regions Overview
The results from the calculations differ a lot between each region and between the star ratings. In figure 5, the markets are divided by the three region categories and by the star ratings.
Figure 5, Market Overview (Cherro & Sadiku, 2011)
When looking at the results presented from the calculations, we can conclude that the different markets and the star categories differs significantly between each other. In each region, the 5-star rated funds has yielded higher total returns than the 1&2-star rated funds.
An interesting result that should be highlighted is the differences in the TER between the star ratings. As we can see in figure 5, the TER for both Europe and US region is higher for the bottom-rated funds. One can raise the question why an investor pays a higher fee for a fund that does not perform well. Since the bottom-rated funds significantly performed worse than the top-rated funds, these bottom-rated funds have also higher fees and higher risks. By looking at the results, the can conclude that the TER differs between the star ratings. However it did not differ notably between the star ratings in Asia-Pacific. In Europe and US region, the differences between the star ratings were more distinguishable. A reason to this can be if the funds are managed active or passive. Since the active managed funds have higher TER these managers
Total Return 5
Years TER
Standard
Deviation Sharpe
Asia-Pacific ex-Japan Equity 5 Star 104,82% 1,34% 0,28 0,58
1&2 Star 86,88% 1,32% 0,34 0,37
Europe ex. UK-Large Cap 5 Star 58,44% 1,53% 0,17 0,4
1&2 Star 23,49% 1,65% 0,19 -0,02
US Market 5 Star 38,39% 1,06% 0,15 0,18
27
want to beat the index, but Malkiel (1999) states that a high percentage of the active managed funds do not beat the market index. This could also be a fact to why they are bottom-rated.
Noteworthy to comment is that although Asia Pacific region is considered having a higher risk, this region shows a better total return in both 5-star rated- and 1&2-star rated funds compared to the other two regions. In addition to this, the average TER is lower than the Europe and US market.
Furthermore, the risk measured as the standard deviation is higher in the 1&2-star rated funds for all regions. Which means that the higher the standard deviation value is, the fund is considered more risky. In addition, the Sharpe ratio known as the risk-adjusted performance measure, is higher in the 5-star rated funds for all regions. This implies that the higher the Sharpe ratio is, the higher the fund gives back in return per risk.
28
5.2 Risk-Adjusted Performance (Sharpe ratio) vs. TER
This section presents the relationship between the Risk-Adjusted performance (Sharpe Ratio) and the TER. By looking at the linear trendlines, conclusions can be made if there is a positive or negative relation between the two variables. If the trendline is upward sloping, it is more efficient investing in funds with higher fees than lower fees. If the trendline is downward sloping, the assumption is that it is not efficient investing in funds with higher fees, thus it is more efficient investing in funds with lower fees.
Figure 6, Sharpe vs. TER “Asia-Pacific ex-Japan Region” (Cherro & Sadiku, 2011)
The scatterplot in figure 6 shows a marginal positive linear trendline for the 5-star rated funds. This implies that the investor would receive a higher return by investing in funds with higher TER. However, the 2star rated funds shows a marginal negative trendline between the Sharpe Ratio and the TER. This on the other hand demonstrates that it would not be efficient to invest in funds with higher fees. Therefore, in the 2star rated funds, investing in funds with lower fees would be more efficient and should yield a better return. y = 1,768x + 0,5569 R² = 0,0159 y = -1,2178x + 0,384 R² = 0,0372 R is k A djus te d pe rfo rm ance (S harpe R at io) TER
Asia-Pacific ex-Japan Region
Average 5star Rated Funds Average 2star Rated Funds
29
Figure 7, Sharpe vs. TER “Europe ex-UK Large-Cap” (Cherro & Sadiku, 2011)
In the European we can see that there consist a linear relationship between the Sharpe Ratio and the TER in both 5-star rated funds and 1&2-star rated funds. The trendline for the 5-star rated funds shows a strong positive relationship between the two variables. This confirms that when investing in the funds with higher fees, the investor will earn a higher return.
When looking at the trendline for the 1&2-star rated funds one can conclude that there also is a positive relationship. However, this is not as clear as the positive relationship for the 5-star rated funds. The trendlines in figure 7 suggests that the investor would earn a higher return when investing in funds with a higher TER in both 5-star ranked funds, and 1&2 star ranked funds.
y = 9,0067x + 0,2373 R² = 0,2656 y = 2,5606x - 0,0611 R² = 0,0077 R is k A djus te d pe rfo rm ance (S harpe R at io) TER
Europé ex-UK Large-Cap Equity
Average 5star Rated Funds Average 1&2 star Rated Funds
30
Figure 8, Sharpe vs. TER “US Market” (Cherro & Sadiku, 2011)
In the US market, the 5-star rated funds shows a significant positive trendline between the Sharpe ratio and the TER. This statistical calculation concludes that it is more efficient investing in funds with higher fees thus yielding a higher return in the top-rated funds. The bottom-rated funds however, show no relationship between the Sharpe ratio and the TER. Since the trendline is almost straight, there is no difference in investing in funds with higher fees or lower fees. Additionally we can see on figure 5 that the 1&2-star rated funds has a significant higher TER value than the 5-1&2-star rated funds.
y = 12,154x + 0,0078 R² = 0,3632 y = 0,4314x - 0,1693 R² = 9E-05 R is k A djus te d pe rfo rm ance (S harpe R at io) TER US Market
Average 5 Star Rated Funds Average 1 & 2 Rated Funds
31
5.3 Return on Investment
In order to get a better overview of these figures, a hypothetical example of investing GBP 100 000 is made. This would help the investor to see how the return and the TER have affected the investment. The £ 100 000 is assumed to be invested in year 2006 with no transactions. The results are presented in figure 9 and show the average return for five years for the top- and bottom-rated funds, the TER is included in the investment.
Figure 9, Return on Investment Overview (Cherro & Sadiku, 2011)
The result shows that the return on the investment is higher in the 5-star rated funds for all regions. An interesting part is that the bottom rated funds in Asia Pacific region has performed better then the top rated funds in both Europe and US Market. The return of the investment for the bottom-rated funds in Asia Pacific region was £ 181 587, compared to the top-rated funds in Europe (£ 164 929) and (£ 138 536) in the top-rated funds in US market.
The worst performing is the bottom-rated funds in the US market. If you would have invest £100 000 year 2006, you would have £ 102 110 five years after, a profit of only £ 2 110. Even if the risk is assumed to be the same in 1&2-star funds in Europe, the average TER for 1&2-star rated funds in US market is highest, 1,70%, compared to Europe which is 1,65% for the 1&2 rated funds.
Return on Investment TER
Average Return 5 Years
Standard
Deviation Sharpe Asia-Pacific ex-Japan Equity 5 Star £ 229 067,24 1,34% 20,96% 0,28 0,58
1&2 Star £ 181 587,41 1,32% 17,38% 0,34 0,37
Europe ex. UK-Large Cap 5 Star £ 164 929,29 1,53% 11,69% 0,17 0,40
1&2 Star £ 116 210,60 1,65% 4,70% 0,19 -0,02
US Market 5 Star £ 138 536,73 1,06% 7,69% 0,15 0,18
32
5.4 Asia Pacific ex. Japan region
In Asia-Pacific ex-Japan region, a total of 35 mutual funds have been studied. Whereas 16 mutual funds in the 5-star rated category and 19 mutual funds that is 2star rated. In this region, there were no 1-star rated funds that met our criteria, therefore these funds has been excluded.
Figure 10, Average Asia Pacific ex-Japan “5 & 2 Stars” (Cherro & Sadiku, 2011)
By looking at figure 10, we can see that in Asia Pacific ex. Japan region, the total return is 95,08%, and the average return for five years is 19,02%. The average TER for investing in this region is 1,33%. This is the lowest TER compared to the other regions investigated (Europe 1.61% and US 1,46%).
Figure 11, Average Return, Asia-Pacific ex-Japan Region“5 & 2 Stars” (Cherro & Sadiku, 2011)
The Asia pacific region is a relatively fluctuated market, we can follow the ups and downs on figure 11. As mentioned earlier, in overall the 5-star rated funds have been performing better than the 1&2-star rated funds. We can also see that during 2007 and 2009, the bottom-rated funds performed better than the top-rated funds. The return for the bottom-rated funds during 2007 was 36,09% (5-star rated funds 32,08%) and during 2009 the return was 51,30% (5-star rated funds 48,44%). Additionally worth to mention is that the top-rated funds managed to handle the financial crisis significantly better than the bottom-rated funds during 2008.
2006 2007 2008 2009 2010
Average 5star Rated Funds 17,20% 32,08% -23,16% 48,44% 30,25%
Average 2star Rated Funds 14,70% 36,09% -36,18% 51,30% 20,95%
A
ve
rag
e
Return
Asia-Pacific ex-Japan Region
n Average Return Total Return Average Return Return on Investment St Deviation Sharpe
35 2006 2007 2008 2009 2010 TER 5 Years 5 Years 100 000 GBP
33
When looking deeper in the market as seen in figure 12 and analyzing the 5-star rated funds, the total return for five years is 104,82% and the average TER is 1,34%. The 2star rated funds has a total return of 86,88%, and the TER is 1,32%. This concludes that the 5-star rated funds have performed much better than the 1&2-star rated funds, this also explains why the Sharpe ratio is higher for the top-rated funds.
Figure 12, Total Return, Asia-Pacific ex-Japan Region“5 & 2 Stars” (Cherro & Sadiku, 2011)
When examining the 5-star and the 1&2-star rated mutual funds. We can see (Figure 13) the funds with the highest/lowest total return, the highest/lowest TER, for both top-rated and bottom-rated funds.
Figure 13, Mutual Funds Overview, Asia-Pacific ex-Japan Region“5 & 2 Stars” (Cherro & Sadiku, 2011)
The best performing 5-star mutual fund is “CF Canlife Far East” which has a total return for five years of 122,97%. Where the TER of 1,65% is above the average TER for the 5-star rated funds (1,34%).
“Newton Asian Inc GBP” is the worst performing 5-star rated fund, with a total return for five years of 93,93%, and a TER of 1,66%.
The fund that has the highest TER in the entire Asia Pacific region is “Aberdeen Global Asian Smaller Cos D2”, with a TER of 2,04% which is highly above the market average
Asia-Pacific ex-Japan Equity
Total Return
Total Return
Standard Deviation Sharpe
Mutual Funds Stars 2006 2007 2008 2009 2010 TER 5 Years
Aberdeen Global Asian Smaller Cos D25 10,09% 21,77% -15,72% 54,88% 46,25% 2,04% 117,27% 0,28 0,65
Schroder Instl Pacific I Inc 5 18,23% 34,25% -26,89% 54,18% 25,14% 0,54% 104,91% 0,30 0,53
Schroder Instl Pacific I Acc 5 18,24% 34,33% -26,77% 54,16% 25,15% 0,54% 105,11% 0,30 0,54
Newton Asian Inc GBP 5 17,45% 19,86% -25,17% 49,81% 31,98% 1,66% 93,93% 0,28 0,50
CF Canlife Far East 5 20,48% 50,37% -27,65% 56,30% 23,47% 1,65% 122,97% 0,33 0,59
F&C Pacific Growth 4 Acc 2 19,10% 53,23% -38,96% 44,76% 16,52% 0,05% 94,65% 0,36 0,39
Halifax Far Eastern C 2 3,45% 17,07% -33,97% 57,13% 25,15% 1,51% 68,83% 0,33 0,26
Waverton Asia Pacific B GBP 2 24,48% 40,18% -42,35% 59,46% 27,24% 1,95% 109,01% 0,38 0,44
Total Return 5
Years TER
Standard
Deviation Sharpe
Asia-Pacific ex-Japan Equity 5 Star 104,82% 1,34% 0,28 0,58
34
in Asia Pacific region3. The total return for five years for the fund is 117,27%, which is higher than the average total return for the 5-star rated category (104,82%).
The lowest TER in the 5-star rated funds is 0,54%, “Schroder Instl Pacific”. Schroder has two mutual funds that are 5-star rated, both with a TER of 0,54%. The total return for five years for these two funds is 104,91% and 105,11%.
The best performing 2star fund is “Waverton Asia Pacific B GBP” which has a total return for five years of 109,01%, this fund has also the highest TER in the 2star category, a TER of 1,95%.
“Halifax Far Eastern C” is worst performing 2star fund with a total return for five years of 68,83%, whereas the TER of 1,51% which is marginally higher than the average TER for the bottom-rated funds in Asia Pacific Region (1,32%).
The lowest TER in the entire Asia Pacific is 0,05%. This fund, “F&C Pacific Growth 4 Acc” has a total return for five years of 94,65% which is higher than the total average return for the 2star rated funds (86,88%).
35
5.5 Europe ex. UK-Large Cap region
In the Europe market, a total of 42 mutual funds have been examined. The population consists of 14 top-rated funds and 28 bottom-rated funds
Figure 14, Average Europe ex. UK-Large Cap Region “5 & 1, 2 Stars” (Cherro & Sadiku, 2011)
Figure 14 shows that for the five year timeframe, the total return is 35,14% and the average return is 7,03%. These results end up between the Asia Pacific region and US Market. However, the TER for investing in Europe is the highest, compared to the other two regions studied. The TER for Europe4 is 1,61%, compared to Asia Pacific (1,33%) and US Market (1,46%)
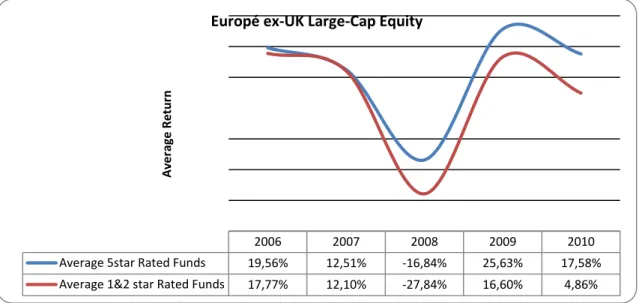
Figure 15, Average Return, Europe ex. UK Large-Cap Region“5 & 1, 2 Stars” (Cherro & Sadiku, 2011)
The results of the average return are showed on the graph (figure 15). The graph shows clearly that the 5-star rated funds have performed better than the 1&2-star rated funds in the entire timeframe of five years. During 2006 and 2007, the returns for the top-rated funds were higher but not significantly. However during 2008, 2009, and 2010 the return for the top-rated funds were significantly higher than the bottom-rated funds.
4 This is found in Appendix 1 and 3
2006 2007 2008 2009 2010
Average 5star Rated Funds 19,56% 12,51% -16,84% 25,63% 17,58%
Average 1&2 star Rated Funds 17,77% 12,10% -27,84% 16,60% 4,86%
A
ve
rag
e
Return
Europé ex-UK Large-Cap Equity
n Average Return Total Return Average Return Return on Investment St Deviation Sharpe
42 2006 2007 2008 2009 2010 TER 5 Years 5 Years 100 000 GBP
36
We can see that the 5-star rated funds during 2006-2010 had total return of 58,44%, and an average TER of 1.53%. The 1&2-star rated funds in the European market had a total return of 23,49%, and an average TER of 1.65%. As we can see on the total return table (Figure 16), the total return for the bottom-rated funds is lower than the top-rated rated funds, furthermore the TER is higher for bottom-rated funds (1,65%) than the top-rated funds (1,53%).
Figure 16, Total Return, Europe ex. UK Large-Cap Region“5 & 1, 2 Stars” (Cherro & Sadiku, 2011)
The table (Figure 17) shows the funds that have the highest/lowest total return, and the highest/lowest TER in each star rating category for the European region.
Figure 17, Mutual Funds Overview, Europe ex. UK Large-Cap Region“5 & 1, 2 Stars” (Cherro & Sadiku, 2011)
The best performing 5-star rated fund is “BlackRock European Dynamic A Inc”, the total return for the fund is 80,31%. However, this fund has a TER of 1,95% which is relatively high compared to the average TER for the top-rated funds (1,53%).
The worst performing 5-star rated fund is “Ecclesiastical Amity European A”, which has a total return of 39,78%. However, this is still higher than the best performing 1&2-star rated fund, “Baring European Growth Trust” which has a total return of 37,47%. The fund with the highest TER in the entire European region is “BlackRock Continental European A Inc”, which has a TER of 2,70%. With a total return of 80,31% which is the next best performing mutual fund in the whole region.
Europé ex-UK Large-Cap Equity
Total Return
Total Return
Standard Deviation Sharpe
Mutual Funds Stars 2006 2007 2008 2009 2010 TER 5 Years
Baillie Gifford European C 5 19,72% 10,40% -22,22% 22,80% 18,83% 0,10% 49,53% 0,19 0,26 BlackRock European Dynamic A Acc 5 21,14% 14,39% -20,34% 37,52% 27,52% 2,70% 80,23% 0,22 0,50 BlackRock European Dynamic A Inc 5 21,18% 14,34% -20,33% 37,62% 27,50% 1,95% 80,31% 0,22 0,50 Ecclesiastical Amity European A 5 17,45% 8,35% -17,78% 18,19% 13,57% 1,62% 39,78% 0,15 0,20 AEGON European Equity B 1 16,90% 18,53% -36,17% 13,43% 8,62% 0,94% 21,31% 0,23 -0,03 Lloyds TSB OS Europe EUR 2 16,97% 21,19% -26,71% 15,54% 3,02% 2,01% 30,01% 0,19 0,05 Legg Mason Continen Europe Eq A 2 15,40% 6,30% -27,02% 11,70% 5,08% 1,91% 11,46% 0,17 -0,16 Baring European Growth Trust 2 28,86% 10,67% -28,81% 16,99% 9,76% 1,62% 37,47% 0,22 0,12
Total Return 5
Years TER
Standard
Deviation Sharpe
Europe ex. UK-Large Cap 5 Star 58,44% 1,53% 0,17 0,4
37
The fund that has the lowest TER in the whole region is a top-rated fund, “Baillie Gifford European C”. This fund has a TER of only 0,10% which is far lower than the average TER for the entire region5 (1,62%). The total return for this fund is 49,54%. The worst performing fund is “Legg Mason Continen Europe Eq A”, with a total return of 11,46%. this fund has a TER of 1.91%, which is above the average TER for the Europe market (1,62%).
We can also see that “Lloyds TSB OS Europe EUR” had the highest TER in the 1&2-star category. However, the fund has a total return of 30,01% which is relatively good by comparing to the total return for the bottom-rated funds which is 23,49%.
The lowest TER is found in the “AEGON European Equity B” fund, this fund has a TER of 0,94%. The total return is 21,31%, which is close to the total return for the bottom-rated funds (23,49%).
38
5.6 US Market
The US Market consists of total 41 mutual funds examined. The population has 15 mutual funds that are 5-star rated and 26 mutual funds that are 1&2-star rated.
Figure 18, US Market “5 & 1, 2 Stars” (Cherro & Sadiku, 2011)
Compared to the other two markets, the US market including both top-rated and bottom-rated funds, has a total return of 20,41% and an average return of 3,99%. This region has performed worst compared to Europe region and Asia Pacific region. The average TER for this region is 1,46% which ends up between Europe (1,61%) and Asia Pacific region (1,33%).
Figure 19, Average Return, US Market “5 & 1, 2 Stars” (Cherro & Sadiku, 2011)
The graph on figure 19 illustrates the average return for the top-rated and bottom-rated mutual funds. During 2006, the 1&2-star rated funds had a return of 1,49% which performed better than the top-rated funds that had a return of -1,05%. However, the following four years after, the 5-star rated funds performed better than the 1&2-star rated funds. Particularly during 2007 and 2008 were the differences are significant. The 5-star rated funds had an average return of 8,64% during 2007 compared to the 1&2-star rated funds which had an average return of -3,00%. The following year, during the financial crisis, the average return for the top-rated funds was -12,98%, where the 1&2-star rated funds had a return of -26,02% the same year.
2006 2007 2008 2009 2010
Average 5 Star Rated Funds -1,05% 8,64% -12,98% 21,64% 22,14%
Average 1 & 2 Rated Funds 1,49% -3,00% -26,02% 20,74% 16,82%
A ve rag e Return US Market
n Average Return TER Total Return Average Return Return on Investment ex TERSt Deviation Sharpe
41 2006 2007 2008 2009 2010 5 Years 5 Years 100 000 GBP
39
The top-rated mutual funds have total return of 38,39%, and the average TER is 1,06%. The bottom-rated funds have total return for of 10,03%, and the average TER is 1,70%. We can see that the total return for the bottom-rated funds is lower than the 5-star rated funds, and also by investing in the bottom-rated funds, it would cost more. The TER for the 1&2rated funds is 1,70% which is significantly higher than the 5-star rated funds where the TER is 1,06%.
Figure 20, Total Return, US Market “5 & 1, 2 Stars” (Cherro & Sadiku, 2011)
When looking deeper in the fund list, the table (Figure 21) shows the funds with the highest/lowest average return, the highest/lowest TER, for both top-rated and bottom-rated funds.
Figure 21, Mutual Funds Overview, US Market “5 & 1, 2 Stars” (Cherro & Sadiku, 2011)
The best performing 5-star fund is “Threadneedle Amer Sm Cos Ret Net Acc” with a total return of 61,87%. However, the TER for the fund which is 1,70% is highly above average TER for 5-star rated funds (1,06%).
“Smith & Williamson North Am” has a total return of 25,36%, which is the worst performing 5-star fund with a TER of 1,56%
The lowest TER in the entire US region is “F&C North American 4 Inc” with a TER of 0,03% and a total return of 26,32% which is relatively low compared to the average total return for top-rated funds (38,39%)
US Market Total Return Total Return Standard Deviation Sharpe Mutual Funds Stars 2006 2007 2008 2009 2010 TER 5 Years
F&C North American 4 Inc 5 1,27% 3,86% -14,68% 18,49% 17,38% 0,03% 26,32% 0,136 0,019
Smith & Williamson North American Trust5 -1,50% 8,56% -12,24% 11,82% 18,72% 1,56% 25,36% 0,121 0,006 GAM North American Growth Acc 5 -7,61% -5,98% 7,21% 6,55% 26,00% 1,72% 26,17% 0,13 0,02 Threadneedle Amer Sm Cos Ret Net Acc5 -2,00% 9,51% -18,90% 39,99% 33,27% 1,70% 61,87% 0,24 0,30
AEGON American Equity B 1 -2,25% 7,66% -29,75% 18,73% 12,19% 0,89% 6,58% 0,19 -0,19
Legg Mason US Equity A 1 -7,20% -8,96% -42,44% 25,66% 9,65% 1,71% -23,29% 0,25 -0,38 SEI GMF US Sm Companies Wealth B GBP2 0,59% -4,52% -20,00% 24,45% 28,99% 1,85% 29,51% 0,21 0,04
BGF US Flexible Equity A4RF GBP 2 -1,15% 3,69% -17,40% 11,58% 11,59% 2,00% 8,31% 0,12 -0,28
Total Return 5 Years TER Standard Deviation Sharpe US Market 5 Star 38,39% 1,06% 0,15 0,18 1&2 Star 10,03% 1,70% 0,19 -0,16
40
The fund that had the highest TER in the 5-star rated funds is “GAM North American Growth Acc” with a TER of 1,72%. The total return is 26,17% which is marginally close to the best performing 2star rated fund, “SEI GMF US Sm Companies Wealth B GBP”, with a total return of 29,51%. Also here, the TER is above the average TER for the bottom-rated funds which is 1,85%
The worst performing fund is a 1star rated fund, “Legg Mason US Equity A” a total return of -23,29%, where the TER is 1,71%.
We can see that the lowest TER in the 1&2-star rated funds is 0,89% with a 6,58% total return for five years.
The highest fee in the 1&2-star rated funds is “BGF US Flexible Equity A4RF GBP” which is 2,00%. This is also the highest TER in the entire US Market. The total return for this fund is 8,31%, which is significant close to its category total return (10,03%)
41
6
Summary of the Analysis
The research has showed some interesting results regarding the mutual funds; TER, star rating, and return, during the time examined. There were large differences in the return, TER and the risk between the regions examined and differences when it came to the 5-star rated funds compared to the 1&2-5-star rated funds.
In all regions, when looking at the return for the time analyzed. The mutual funds that were top-rated with 5-stars were performing far better than the bottom-rated 1&2-star funds. It is also interesting to mention that although the bottom-rated funds were performing worse, in both Europe region and US region the average TER for the funds were significant higher than the top-rated funds in the same region. However, in all three regions, the results show that it is more efficient to invest in mutual funds with higher fees in the 5-star rated category. This was particularly true in the European and US region were the linear trendline is strongly positive sloping for the top-rated funds when looking at the relationship between the Sharpe Ratio and TER. Furthermore, in Europe region, the 1-&2-star rated funds showed a positive linear trendline which also means that it is efficient investing in funds with higher fees than funds with lower fees to get a higher return.
In the Asia Pacific region, there were no big differences when comparing the TER and return in the 5-star rated funds and the 2-star rated funds. Hence this is still an emerging market, the bottom-rated funds still performed well when comparing the top/bottom-rated funds in Europe or in US region. Furthermore, due to that the Asia Pacific region is an emerging market, the risk, measured as the standard deviation is 0,31, which is much higher than both Europe (0,19) and US region (0,18). But with great risks, you will get great rewards, hence by looking at the returns for this market, it outperformed both Europe and US region by far.
When looking at the Europe market, we can see significant differences on the return between the 5-star rated funds and the 1&2-star rated funds. The top-rated funds had higher returns than the bottom-rated funds, whereas the TER for the bottom-rated funds is higher then the top-rated funds. However, in Europe market, the results show an upward sloping trendline for both 5-star rated funds, and 1&2-star rated funds. Therefore it means that it should be efficient to invest in funds with higher fee in both