Swedish Consumption and
the Global Environment
Swedish Consumption and the Global Environment
Swedish Consumption and the Global Environment
Goods and services give rise to a variety of environmental pressures over the
whole of their life cycles – not only where they are consumed. The environment
is also affected where raw materials are extracted and goods are produced, and
when products are used and finally become waste. Transport too, at all the stages
in between, has impacts on the environment.
Growing international trade makes it increasingly difficult to determine the overall
pressures on the environment associated with consumption. It also means that it
is impossible to take a narrow national view of global environmental issues.
Up to now, the international dimension of Sweden’s environmental objectives has
not been clear. Following recent changes to the system of objectives, Swedish
efforts to safeguard the environment will also take into account the global
environ-mental impacts for which the country is responsible. As a first step in that
direc-tion, the Swedish Environmental Protection Agency and the Swedish Chemicals
Agency have produced this report on the pressures on the environment in other
countries resulting from Swedish consumption.
The report’s aim is to provide basic data for further work on the adverse pressures
which Sweden places on the global environment, from a consumption point of
view. This approach is intended as a complement to existing follow-up of progress
towards the country’s sixteen national environmental quality objectives.
Five areas are dealt with in the report: climate, air pollution, water, land and chemicals.
ISBN 978-91-620-1285-4Swedish Consumption and
the Global Environment
Orders
By phone: +46 8 50593340 By fax: +46 8 50593399 By email: natur@cm.se
By post: CM Gruppen AB, Box 11093, SE-161 11 Bromma, Sweden Online: www.naturvardsverket.se/bokhandeln
Swedish Chemicals Agency Phone: +46 8 51941100 Fax: +46 8 7357698 Email: kemi@kemi.se
Postal address: Kemikalieinspektionen, Box 2, SE-172 13 Sundbyberg, Sweden Website: www.kemi.se
Swedish Environmental Protection Agency Phone: +46 8 6981000
Fax: +46 8 202925
Email: registrator@naturvardsverket.se
Postal address: Naturvårdsverket, SE-106 48 Stockholm, Sweden Website: www.swedishepa.se
ISBN 978-91-620-1285-4 ISSN 1654-4641
© Swedish Environmental Protection Agency 2011 English translation: Martin Naylor
Cover photos (from left to right): Johnér/Per Ranung, Johnér/Josefine Bolander, Matton/Food Collection, Etsabild/Anne Nyblaeus
1 PREFACE 5
2 EXECUTIVE SUMMARY 6
3 SAMMANFATTNING 9
4 A GUIdE To REAdERS 11
5 INTRodUCTIoN 13
5.1 Environmental objectives system has lacked an international perspective 13
5.2 Environmental pressures can be seen from different perspectives 15
5.3 Everyone can help reduce pressures on the environment 17
5.4 Purpose, method and target audience 17
6 GlobAl ENVIRoNMENTAl PRESSURES FRoM CoNSUMPTIoN – A STUdY oF FIVE AREAS 21
6.1 Overall picture of consumption and Swedish trade 21
6.2 Climate – Swedish consumption’s contribution to greenhouse gas emissions 23
6.3 Air pollution – consumption and sulphur and nitrogen oxide emissions 28
6.4 Water – real use is hidden 31
6.5 Land use for food production 37
6.6 Release of chemicals resulting from Swedish consumption 42
7 METhodS To CAlCUlATE ENVIRoNMENTAl PRESSURES FRoM CoNSUMPTIoN 51
7.1 Input–output analysis used in several methods 51
7.2 Environmental accounts 52
7.3 Input–output analysis as used in the Swedish Environmental Protection Agency’s climate impact report 55
7.4 Carbon footprint 56
7.5 Water footprint 58
7.6 Ecological footprint 61
7.7 Fair shares in environmental space 66
7.8 Planetary boundaries 68
8 GRowING ATTENTIoN To ENVIRoNMENTAl PRESSURES FRoM CoNSUMPTIoN 71
8.1 A brief history 71
8.2 Work in progress, internationally and nationally 73
Contents
9 ThE wAY FoRwARd 81
9.1 Gaps in knowledge 81
9.2 The ‘last port’ problem 82
9.3 Lack of data on other countries’ production processes 82
9.4 Measuring a multidimensional issue 83
9.5 Lack of standards – the same method produces different results 83
9.6 Future work in this area 83
10 REFERENCES 85
10.1 Electronic sources (online material) 85
10.2 Printed sources 89
10.3 Unpublished sources 94
11 GloSSARY 96
12 APPENdICES 98
Appendix 1. Methodology used for Swedish statistics on imports of goods 98
An in-dEPth EvAluAtiOn of Sweden’s
environ-mental objectives, published by the Environ-mental Objectives Council in 2008, highlighted the question of the pressures on the global envir-onment arising from Swedish consumption. In 2009, the Council initiated a project on the sub-ject, resulting on the one hand in a thematic chap-ter in its annual progress report on the objectives,
de Facto 2010, and, on the other, in the present
report.
On 1 November 2010, the Environmental Objectives Council was disbanded. At its final meeting in April 2010, the Council decided to hand over the task of completing the report to the Swedish Environmental Protection Agency, to-gether with other interested authorities. The Swedish Chemicals Agency chose to participate in this work, contributing in particular to the sec-tions relating to chemicals.
This report is to be seen as a compilation of basic data and a step towards a better understand-ing of how consumption in Sweden affects the en-vironment in other countries. Much remains to be done. In its Bill Sweden’s Environmental
Objec-tives – For More Effective Environmental Action
(2009/10:155), the Government attached greater weight than before to the international dimension of efforts to safeguard the environment. It also en-trusted the Environmental Protection Agency, in consultation with Statistics Sweden and the Swed-ish Consumer Agency, with following and, where necessary, participating in the work in progress in this area at the EU level. The Riksdag (the Swed-ish Parliament) approved the Bill in June 2010.
The preparation of this report was coordinated by the Swedish Environmental Protection Agency, with Maria Daléus Barton (summer 2009–May 2010) and Helena Bergström (June–November 2010) as project managers.
1
Preface
October 2010
Maria Ågren Nina Cromnier
GOOdS And SERviCES give rise to various pres-sures on the environment over their life cycles, from extraction of raw materials and production to use and final disposal, including transport at all the stages in between. Environmental problems that can be linked to the consumption of goods and services include depletion of natural re- sources and biodiversity, climate change and diffuse releases of chemicals.
Sweden also affects other countries’ environments
To get a complete picture of the ecological chal-lenge which human consumption poses, we need to know more about the environmental pressures arising from current patterns of consumption. Sweden’s environmental quality objectives focus on the state of the environment from a nation-al point of view. The Environmentnation-al Objectives Council, in its 2008 in-depth evaluation, stressed the importance of incorporating an international dimension in the environmental objectives sys-tem. In its Environmental Objectives Bill in March 2010, the Swedish Government stated that the overall goal of environmental policy was to hand over to the next generation a society in which the major environmental problems in Sweden have been solved, and that this should be done without increasing environmental and health problems outside Sweden’s borders. The Bill was approved by the Riksdag in June of the same year.
Sweden is responsible for and has control over the environmental pressures arising from activities within its borders. But our consumption of goods and services also affects the environment in other countries. This is a result of Sweden’s heavy
de-pendence on trade: the country’s imports are worth over 40 per cent of its gross domestic product.
Basic data for further work
The purpose of this report is to assemble basic data for further work on the global environ-mental pressures associated with consumption in Sweden. The report should not be regarded as an exhaustive survey of the subject, but merely as a step along the way. It presents rough estimates of the scale of pressures on the environment within selected segments of five areas. It also describes some of the methods used in this field and, finally, outlines the gaps in existing knowledge brought to light in the preparation of the report.
Environmental pressures can be seen from different perspectives
A common way of classifying emissions is on the basis of the geographical area in which they occur. Emissions from the production of goods and services are then calculated within the area concerned, for example a country. This can be referred to as a production perspective. In this report, the concept of a consumption perspec-tive is also used. With such a perspecperspec-tive, total emissions or pressures on the environment from, say, land use are calculated for the goods and services which people living in Sweden consume, regardless of where in the world those emissions or other pressures arise. This approach is import-ant in arriving at an estimate of the overall envir-onmental pressures attributable to Swedish con-sumption, and complements our picture of those arising within Sweden’s borders.
Pressures in five areas
The five areas dealt with in this report are climate, air pollution, water, land and chemicals.
Greenhouse gases have as great an impact on the earth’s climate, no matter where on the plan-et they are emitted. Overall, Swedish consump-tion in 2003 is estimated to have given rise to emissions of 95 million tonnes of carbon dioxide equivalent, calculated from a consumption per-spective. That figure includes emissions of carbon dioxide, methane and nitrous oxide from goods and services throughout their life cycles (produc-tion, use and waste), irrespective of where in the world those emissions occurred. That is 25–35 per cent more than if emissions in Sweden alone were taken into account.
Emissions to air of pollutants such as sulphur and nitrogen oxides are also estimated to be higher in a consumption perspective than from a strict production point of view. These emissions have environmental effects such as acidification and eutrophication, but also adversely affect hu-man health.
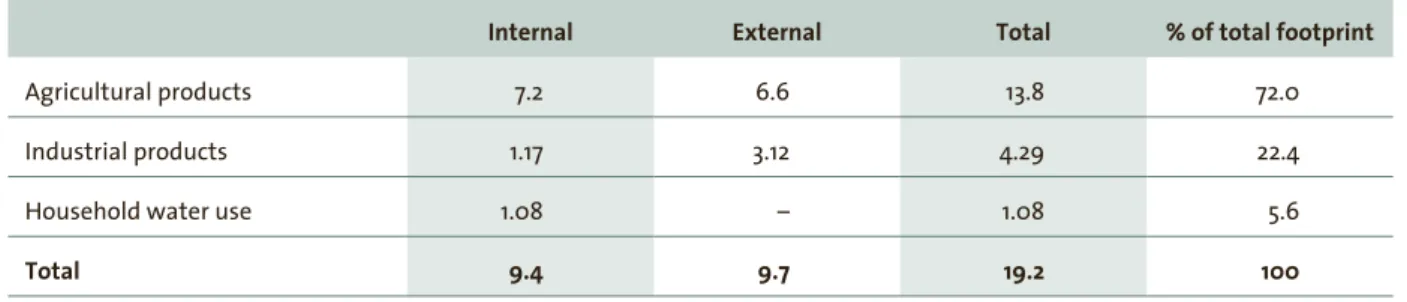
A large proportion of the water used by con-sumers in Sweden is ‘hidden’ in the products that are consumed, in the form of the water required to produce them. Of this ‘virtual’ water, rough-ly half comes from other countries. What effects water use for Swedish consumption has in other parts of the world depends on a number of fac-tors, including the state of water resources in the places where the goods are produced.
Swedish consumption also affects land use abroad. Between 30 and 50 per cent of all the land needed to produce the food consumed in Sweden, for example, is outside the country’s borders. En-vironmental pressures from land use can be both direct, for example from pesticide spraying, and indirect, including threats to fauna and flora. The increase in yields that has accompanied growth in the world’s population has, among other things, affected soil quality and biodiversity. As some
areas have become unfit for agricultural use, new areas – such as previously forested land – have been brought under cultivation.
Chemicals are often involved, in one way or
another, in all the products we consume. Many industrial manufacturing processes make use of them. Sweden imports large quantities of clothes and other products that are manufactured using chemicals. However, it is difficult to estimate what pressures the chemicals associated with Swedish consumption in fact place on the environment. This is partly because of inadequate knowledge and statistics in this area, and partly because regu- lation of chemicals is poorly developed in many countries.
Methods to calculate environmental pressures
Various methods and information systems exist to calculate or describe the environmental pressures to which consumption in one country gives rise in other parts of the world. They include envir- onmental accounts, the ecological footprint and water footprint, and fair shares in environmen-tal space. These approaches provide fairly crude measures of the global environmental pressures associated with a country’s consumption. Work is under way, however, to improve and standardise the methods used and make more data available.
Knowledge gaps and other problems
In general, much remains to be done in the area of methods and statistics. Evident deficiencies at pres- ent include the fact that many countries still lack environmental accounts, and that it is difficult to determine the countries of origin of a large pro-portion of Sweden’s imports. The latter difficulty stems from the fact that statistics on trade with other EU member states record only the last port of shipment of goods. Greater knowledge and bet-ter reporting of environmental performance are essential, not least if consumers and buyers are to be in a position to make environmental demands. This is important in promoting environmentally
sustainable development at both a national and a global level.
Work in progress
The global environmental pressures arising from consumption have been discussed for a long time and in some depth, both nationally and interna-tionally. Only more recently, though, have polit-ical processes got under way in a number of dif-ferent bodies. Work is now in progress within the UN and the EU, for example, to coordinate action in this area.
vAROR OCh tjänStER ger upphov till olika typer
av miljöpåverkan under sin livscykel från råvaru- utvinning och produktion till användning och slutligt omhändertagande, inklusive transporter i alla led. Exempel på miljöproblem som kan kopplas samman med konsumtionen av varor och tjänster är utarmande av naturresurser och biologisk mångfald, klimatpåverkan och diffusa utsläpp av kemikalier.
Sverige påverkar miljön även i andra länder
För att få en fullständig bild av den ekologis-ka utmaning som männisekologis-kan står inför då det gäller konsumtionen behövs kunskap om vilken miljöpåverkan som nuvarande konsumtions-mönster innebär. De svenska miljökvalitetsmålen fokuserar på det nationella miljötillståndet. Miljö- målsrådet pekade i sin fördjupade utvärdering 2008 på att det är viktigt att den internationel-la dimensionen kommer in i miljömålssystemet. Regeringen angav i sin miljömålsproposition i mars 2010 att det övergripande målet för miljö-politiken är att till nästa generation lämna över ett samhälle där de stora miljöproblemen i Sverige är lösta, och att detta bör ske utan att orsaka ökade miljö- och hälsoproblem utanför Sveriges gränser. Riksdagen biföll propositionen i juni samma år.
Sverige har ansvar för och rådighet över den miljöpåverkan som orsakas av aktiviteter inom landet. Men vår konsumtion av varor och tjänster påverkar miljön även i andra länder. Det beror på att Sverige är mycket handelsberoende; värdet av importen motsvarar drygt 40 procent av landets bruttonationalprodukt.
Rapporten är ett kunskapsunderlag för fortsatt arbete
Syftet med denna rapport är att ta fram kunskaps-underlag för fortsatt arbete med frågan om den svenska konsumtionens globala miljöpåverkan. Rapporten ska inte betraktas som en komplett kartläggning av detta utan utgör endast ett steg i arbetet. Den presenterar en ungefärlig uppskatt-ning av omfattuppskatt-ningen av miljöpåverkan inom val-da delar av fem områden. Rapporten ger också en beskrivning av några av de metoder som används inom området och slutligen en översikt över de kunskapsluckor som uppmärksammats i arbetet med rapporten.
Miljöpåverkan kan ses i olika perspektiv
Ett vanligt sätt att dela in utsläpp är efter i vilket geo-grafiskt område de sker. Utsläppen från produk-tion av varor och tjänster beräknas då inom det aktuella området, till exempel ett land. Detta kan kallas för ett produktionsperspektiv. I denna rap-port används också begreppet konsumtionsper-spektiv. Det innebär att de totala utsläppen eller miljöpåverkan från till exempel markanvänd-ning beräknas för de varor och tjänster som per-soner bosatta i Sverige konsumerar, oavsett var i världen utsläppen eller miljöpåverkan sker. Detta perspektiv är viktigt för att få en uppskattning av den svenska konsumtionens totala miljöpåver-kan och kompletterar bilden av de utsläpp och miljöpåverkan som sker enbart i Sverige.
Påverkan inom fem områden
De fem områden som behandlas i denna rapport är: klimat, luft, vatten, mark och kemikalier.
Växthusgaser ger lika stor påverkan på jordens
klimat oavsett var på jorden utsläppen sker. Den
totala svenska konsumtionen uppskattades år 2003 orsaka utsläpp av 95 miljoner ton koldiox-idekvivalenter räknat i ett konsumtionsperspek-tiv. Då ingår utsläppen av koldioxid, metan och lustgas från varor och tjänster under hela livs-cykeln (produktion, användning och avfall) oav-sett var i världen utsläppen sker. Det är 25–35 procent mer än då bara utsläppen i Sverige räknas. Även utsläppen till luft av till exempel svavel- och kväveoxider beräknas bli större i ett konsum-tionsperspektiv än om man ser i ett strikt produk-tionsperspektiv. Sådana utsläpp påverkar miljön genom försurning och övergödning, men har också negativa effekter på människors hälsa. En stor del av vattnet som konsumenter i Sverige använder ”göms” i de produkter som konsumeras. Det är vatten som används för att producera varorna. Av detta ”virtuella” vatten kommer unge-fär hälften från andra länder. Vilka effekter som vat-tenanvändningen för svensk konsumtion får i andra länder beror bland annat på vilka vattenförhållan-den som råder på platsen där varorna produceras. Svensk konsumtion påverkar även
markanvänd-ningen utomlands. Till exempel svarar mark
utanför Sveriges gränser för 30–50 procent av det totala markbehovet för svensk livsmedelskon-sumtion. Påverkan sker dels direkt, i form av bland annat spridning av bekämpningsmedel, dels indirekt, i form av bland annat hot mot växt- och djurlivet. Den avkastningsökning som har skett i takt med att världens befolkning har ökat har bland annat påverkat jordkvalitet och biologisk mångfald. Allteftersom landytor blivit obrukbara har nya arealer tagits i bruk – till exempel marker som tidigare varit klädda med skog.
Kemiska produkter är ofta, på ett eller annat vis,
inblandade i alla de varor som konsumeras. I många industriella framställningsprocesser används kemi-kalier. Sverige importerar bland annat mycket
kläder och andra varor som kräver kemikalier vid framställningen. Det är dock svårt att uppskatta vilken faktisk miljöpåverkan av kemikalier som svensk konsumtion har. Orsaken till detta är dels bristande kunskap och statistik på området, dels att kemikaliekontrollen i många länder är dåligt utvecklad.
Metoder för att beräkna miljöpåverkan
Det finns olika metoder och informationssystem för att beräkna eller beskriva den miljöpåver-kan som ett lands konsumtion ger upphov till i andra länder. Exempel på sådana metoder är miljöräkenskaper, ekologiskt fotavtryck, vatten-fotavtryck och rättvist miljöutrymme. Metoderna ger ganska grova mått på den globala miljöpåver-kan som ett land genom sin konsumtion ger upp-hov till. Arbete pågår dock med att förbättra och standardisera metoderna och öka tillgången till data.
Kunskapsluckor och andra brister försvårar
Generellt återstår mycket arbete när det gäller metoder och statistik. Bland de brister som är upp-enbara i dag kan nämnas att det fortfarande sak-nas miljöräkenskaper i många länder, och att det är svårt att fastställa ursprungslandet för stora de-lar av Sveriges import. Detta beror på att det som registreras vid handel med EU-länder är den sista hamn som varan lämnar. Ökad kunskap och bättre redovisning av miljöprestanda är avgörande, inte minst för konsumenters och upphandlares möj-ligheter att ställa krav på miljöhänsyn. Detta är viktigt för att kunna främja en miljömässigt håll-bar utveckling på både nationell och global nivå.
Arbete pågår
Konsumtionens globala miljöpåverkan har länge och relativt ingående diskuterats på nationell och internationell nivå. Men det är först på senare tid som politiska processer har startat inom ett antal olika organ. Arbete pågår till exempel inom FN och EU för att samordna insatserna.
• Chapter 5 of this report presents the consumption and production perspectives, and describes the purpose, method and target audience of the report.
• Chapter 6 provides approximate estimates of the magnitude of the environmental pressures arising from Swedish consumption, illustrated by examples from five areas. • In Chapter 7, a number of methods of calculating the environmental
pressures from consumption are described and assessed.
• Chapter 8 gives a brief history of how the significance of consumption for the environment has emerged as an issue, and outlines work under way in this area, internationally and nationally.
• In Chapter 9, an overview is given of the knowledge gaps brought to light in the preparation of the report.
• Chapter 11 provides a glossary of terms.
AS A PROPORtiOn Of WORld gross domestic
prod-uct (GDP), international trade has trebled since 1970. In 2008, goods and services worth over SEK 125 trillion (US$ 19 trillion) were exported around the world. Sweden is no exception: its for-eign trade has grown by an average of 6 per cent annually over the last 150 years.1 The country
im-ports goods worth the equivalent of 43 per cent of its GDP, with an increasingly large share of con-sumer goods coming from developing countries and from emerging economies in transition from developing to developed country status.2 Much of
what is consumed in Sweden, in other words, is manufactured in other countries. Similarly, much of what Sweden itself produces is used in other parts of the world, with Swedish exports worth the equivalent of 51 per cent of the country’s GDP.3
Growing international trade in goods and ser-vices means that emissions, for example from raw material extraction, production, transport and use, are occurring in more geographical regions, and that overall pressures on the environment are becoming increasingly difficult to determine.4 It is
becoming ever more apparent that, when the con-sumption patterns of the industrialised world are adopted by the developing countries, the aggre-gate extraction of resources worldwide will ex-ceed planetary limits. It is impossible, therefore, to take a narrow national view of global environ-mental issues.
5.1 Environmental objectives system
has lacked an international perspective
Sweden is dependent on trade with the rest of the world. It manufactures pharmaceuticals, paper and trucks, for example, which are sold on the global market. At the same time, it imports products such as food, fossil fuels and cars. Swed-ish consumption thus affects the environment in other countries. The precise nature of its effects depends on what Swedish imports look like, that is, what other countries produce and export to Sweden. These pressures on the environment have not previously been taken into account in Swe-den’s system of environmental objectives.
The environmental objectives system is built around 16 environmental quality objectives, de-scribing the quality and state of Sweden’s envir-onment and natural and cultural resources that are environmentally sustainable in the long term. These goals are to be achieved within one genera-tion. To follow up and evaluate them, the Gov-ernment established an Environmental Objectives Council, which operated from 2002 until the au-tumn of 2010. In its in-depth evaluation in 2008,
Sweden’s Environmental Objectives: No Time to Lose, the Council highlighted the need for an
international perspective on environmental im-pacts. There are two main concerns in this regard. One is to reduce the emissions that occur in other
5
Introduction
1. Ekonomifakta, Exportandelar – internationell jämförelse. (Online.) 2. Swedish Environmental Advisory Council (2007).
3. Statistics Sweden, Nationalräkenskaper. (Online.) 4. Peters & Hertwich (2006).
countries, but end up in Sweden, for example via water and the atmosphere. The other is to reduce emissions and other environmental pressures which Swedish consumption and production give rise to in other parts of the world.
The Environmental Objectives Council pointed out that it was important to avoid Sweden putting adverse pressure on the environment in other countries, and to change consumption patterns, both in Sweden and internationally. The Council also proposed further study of how the interna-tional dimensions of the environmental objectives could be made more visible and incorporated in the environmental objectives system.
In October 2009 the Inquiry on the Environ-mental Objectives System presented its report,
Sweden’s Environmental Objectives – New Per-spectives (SOU 2009:83). It proposed that the
overall generational goal of environmental pol-icy should include, as one of its bullet points, the words ‘consumption of goods and services in Sweden will cause the least possible environmen-tal and health problems, regardless of where in the world their production is located’.
In March 2010 the Government submit-ted its Bill Sweden’s Environmental Objectives
– For More Effective Environmental Action
(2009/10:155). It proposed that the overall goal should continue to be to hand over to the next generation a society in which the major environ-mental problems in Sweden have been solved. The Government added that this should be done without increasing environmental and health problems outside Sweden’s borders. The pursuit of the objectives, in other words, must not simply shift environmental problems to other countries. The Government made this clear in the final bul-let point of the generational goal, which referred
to the need to ensure that ‘patterns of consump-tion of goods and services cause the least possible environmental and health problems’. Thus, the environmental pressures arising from consump-tion are now more clearly included in the envir-onmental objectives system.
The Government also proposed that the Swed-ish Environmental Protection Agency, in consul-tation with the Swedish Consumer Agency and Statistics Sweden, should follow and, where rele-vant, participate in the work in progress within the EU to make visible the global environmental pressures resulting from consumption. This work could, it believed, serve as a basis for discussing how such pressures from Swedish consumption of goods and services could be measured in the framework of Sweden’s system of environmental objectives.5
On 22 June 2010 the Government Bill was con-sidered by the Riksdag (the Swedish Parliament). The report of the Parliamentary Committee on Environment and Agriculture, which the Riks- dag approved, stated: ‘As the Government points out, environmental efforts in this country need to take account of Sweden’s environmental impacts in other countries. Policy instruments and meas-ures must be designed in such a way that Swe-den does not export environmental problems, and this should be made clear in environmental policy. Transboundary pressures on the environ-ment should not be seen as limited to the effects of consumption in a narrow sense; it is also rele-vant to take into account the effects of political decisions. It is made clear in the generational goal that the task of solving environmental problems in Sweden must be undertaken without increas-ing environmental and health problems outside Sweden’s borders. The Committee concurs with
the Government’s assessment and notes that this international aspect is well taken care of in the proposed generational goal.’6
5.2 Environmental pressures can
be seen from different perspectives
7Emissions can be divided up according to differ-ent principles. A common approach is to work on the basis of the geographical area, such as a coun-try, in which they occur. Emissions from the pro-duction of goods and services are then calculated within that country. This approach can be re-ferred to as a production perspective. If, instead, emissions and other pressures over the entire life cycles of goods and services are sorted according to where the goods and services are used, they will be shared out among the consumers of different countries or regions. This is known as a
consump-tion perspective.
In countries with a large volume of interna-tional trade, the difference between these two perspectives will be considerable. At a regional or local level, they will diverge even more widely, as goods and services are rarely produced and con-sumed in exactly the same places.
5.2.1 definition of consumption
The word consumption refers to the final use of goods and services. Everything that is consumed on the basis of purchases paid for directly by the individual consumer is classed as private con-sumption, while things paid for from taxes are classed as public consumption. In this report, consumption includes all forms of consumption, i.e. public as well as private.
5.2.2 the consumption perspective
– pressures are ‘charged’ to the final consumer
The basic approach of the consumption perspec-tive, then, is that the pressures on the environ-ment occurring over the entire life cycle of a prod-uct or service are allocated to the final consumer – regardless of where in the world or the supply chain they arise.
It is not possible to put exact figures on the overall environmental pressures, from a con-sumption perspective, attributable to Sweden’s population, but an estimate of their magnitude can be made. When emissions of greenhouse gases, for example, are calculated from a con-sumption point of view, the emissions arising from goods exported from Sweden are subtracted from national emissions and distributed among the consumers of other countries. Conversely, the emissions caused around the world by imports to Sweden have to be added to the total, together with those from foreign travel by people living in Sweden. Calculations of this kind – from a con-sumption perspective – provide an overall picture of the environmental pressures to which Sweden’s inhabitants give rise.
One of the advantages of a consumption ap-proach is that it describes relatively clearly the pressures on the environment associated with life-styles and standards of living in a country. This provides a basis for reducing the pressures aris-ing from private purchases and procurement and, ultimately, choosing patterns of consumption with smaller adverse impacts on the environment.
A clear disadvantage with this approach is the considerable uncertainty currently associated with the statistics.
6. Parliamentary Committee on Environment and Agriculture, Report 2009/10:MJU25. (Online.)
7. Unless otherwise indicated, the information in section 5.2 comes from Swedish Environmental Protection Agency Report 5903, Konsumtionens klimatpåverkan (Swedish Environmental Protection Agency 2008b).
5.2.3 the production perspective
– pressures are ‘charged’ to geographical areas
The production perspective, also known as the territorial approach, forms the basis for efforts within the UN and under the Kyoto Protocol, for example, to reduce greenhouse gas emissions.
In international negotiations, a production per-spective has an advantage, in that a country has control over the environmental pressures arising within its own borders. It has been more difficult in international agreements to handle the pres-sures that arise between countries, for instance from international aviation and shipping. An- other question that has caused problems is whether emissions from the production of products con-sumed in other countries should receive special treatment.
A disadvantage with the production perspec-tive is that the more narrowly the geographical area is defined, the further we get from a connec-tion with what is actually consumed there. If, for example, the area consists of a small municipality with a large industrial plant, data on environmen-tal pressures per capita will be misleading. Even if the plant has a small environmental impact in relation to its size, the figures will not reflect the pressures actually resulting from the local popu-lation’s consumption.
5.2.4 Methods to assess environmental pressures
A number of methods can be used to assess how much pressure consumption in one country is putting on the environment in other countries. In this report, use is made of the following approaches:
• To provide an overall measure of the environ-mental pressures associated with people living in Sweden, the concept of the ecological
foot-print is used. This has been judged to be the
best-established method of arriving at a rea-sonably comprehensive measure of how hu-man consumption affects the earth’s resources.
An ecological footprint expresses how much of the earth’s biologically productive area people make use of to maintain their consumption of goods and services.
• The sections on climate and air pollution are based on environmental accounts and input–
output analysis, both of which are well
estab-lished. In Sweden, environmental accounts are produced by Statistics Sweden, and they are available at a central government level in certain other countries as well. These methods could be chosen because data are available in the areas of climate and air pollution that can be used in input–output analyses.
• The section on water is based on research con-cerning water footprints and on work carried out by WWF (the World Wide Fund for Na-ture) in this field. The water footprint is a way of illustrating a country’s total consumption of water. It has been judged to be the approach that currently provides the best picture of how consumption affects water use in the world. • The main data for the section on land are based
on a modified version of the ecological
foot-print. This alternative method of calculation
takes greater account of the countries of ori-gin of commodity flows. It has been used in a number of studies in this area.
• The section on chemicals is for the most part descriptive and is based, among other things, on data from Statistics Sweden, produced using
material and substance flow analysis.
The methods mentioned have various short-comings, but are the approaches which, for now, have nevertheless been considered most appro-priate for this report. They do not produce exact results; rather, they are a way of indicating the approximate magnitude of pressures on the envir-onment. More detailed accounts of them will be found in Chapter 7, where the carbon footprint,
fair shares in environmental space and planetary boundaries are also described.
5.3 Everyone can help reduce
pressures on the environment
By our choices, we can all play a part in reducing the environmental pressures linked to consump-tion. With the people of Sweden importing more and more of their consumer goods from develop-ing and emergdevelop-ing economies, their patterns and levels of consumption indirectly affect the con-ditions for achieving environmentally more sus-tainable development in those countries. Citizens of importing nations thus have a responsibility. Their scope to act, though, is limited by factors such as inadequate information and a lack of al-ternative products.8 Given access to various types
of information, individual consumers can make demands and arrive at conscious choices, but such information is only available to a limited extent.
Responsibility to reduce environmental pres-sures is shared among a range of actors in the chain of production and consumption. Public bodies are major consumers, producers are re-sponsible for manufacturing, and politicians pass laws and regulations governing production, dis-tribution, use and waste disposal.9
5.4 Purpose, method
and target audience
5.4.1 Purpose
The purpose of this report is to assemble basic data for further work on the question of the ad-verse global environmental pressures associated with consumption. This can serve as a comple-ment to follow-up of progress towards Sweden’s environmental quality objectives.
The report is a step towards a quantification of the pressures on the environment from
consump-tion. It should not be regarded as an exhaustive presentation of knowledge in this area, nor does it provide a complete review of the literature.
LIMITATIONS
The overall significance which production and trade have for a country depends on a wide range of factors, including the country’s development, economic situation and social conditions. This re-port deals only with the environmental aspects – and, to some extent, the associated health aspects – of the pressures to which Swedish consumption gives rise around the world.
Pressures refers here to the emissions that
oc-cur or the land that is used to support Swedish consumption. The impacts of adverse pressures – for instance, people becoming ill or habitats be-ing destroyed – are dealt with to only a limited extent. The aim is to exemplify and give an ap-proximate picture of the environmental pressures involved. The report thus presents only orders of magnitude – not exact data on emissions or other pressures.
Given the wide-ranging nature of the question addressed, the scope of this report has been lim-ited by focusing on five areas, chosen on the basis of three criteria:
• It must be possible to obtain data on the areas concerned.
• They must be of significance for the environ-ment in other countries.
• They must be relevant to as many of the envir-onmental quality objectives as possible.
The areas selected are climate, air pollution, water, land and chemicals. Within these fields, further limitations have been made, with the result that the accounts given of environmental
8. Swedish Environmental Advisory Council (2007). 9. Swedish Environmental Protection Agency (2008b).
pressures in the different areas are not exhaustive. As both the methods used to study pressures on the environment and the current state of know-ledge differ from one area to another, the format of the individual sections varies.
The report seeks to shed light on environmen-tal pressures from a consumption rather than a production perspective. This consumption ap-proach takes in both the pressures arising in Swe-den and those arising in other countries as a result of Swedish consumption. The emphasis will be on the latter.
Pressures on the environments of other nations can arise in several ways. In this report, the fo-cus is on those occurring when extraction of raw materials and production and transport of goods imported to Sweden take place in other countries. Pressures can also come about when emissions from production in Sweden are carried to another country, for instance by winds. That aspect will not be dealt with in the present report. In addi-tion, the environment in other parts of the world may be affected by Swedish exports of waste. This part of the life cycle will only be considered in the chemicals section of Chapter 6.
Given the criteria chosen, a number of areas have been excluded. One such area is biodiver-sity. This is because greater knowledge and more statistical data are needed to gain a picture of the pressures on biodiversity that can be attributed to Swedish consumption.
Reducing adverse environmental pressures will require a range of measures and policy instru-ments. This report does not go into what these
might be, which of them would be most effective or what consequences they might have. Nor is the report, on its own, intended to form a basis for proposals on such measures or instruments.
5.4.2 Method
This report has been prepared by a project group originally attached to the Secretariat of the En-vironmental Objectives Council. As far as pos-sible, it has been based on material already pub-lished. For the land and air pollution sections especially, existing statistics have been reworked and reanalysed. Special consultancy studies and background data for the report were produced by Statistics Sweden, Demesta HB and the Swed-ish Consumer Agency.10, 11, 12 Supporting data
for the section on chemicals were produced joint-ly by the Swedish Chemicals Agency, Statistics Sweden and the Swedish Environmental Protection Agency.13 Thematic meetings were held with
ex-perts in each of the four areas air pollution, water, land and chemicals. The climate section is based on the Environmental Protection Agency’s report on the climate impact of Swedish consumption.14
Consultation on and discussion of the overall contents of the report took place at meetings of the Environmental Objectives Council’s Progress Review Group.15
The following individuals have reviewed and commented on different sections of this report: Anders Berntell (Stockholm International Water Institute), Susanne Johansson (Centre for Sus-tainable Agriculture at the Swedish University of Agricultural Sciences), Per Rosander (Enviro-
10. Wadeskog (2009) and Villner et al. (2009). 11. Nordlund (2010).
12. Bergström (2010).
13. Swedish Chemicals Agency et al. (2010).
14. Swedish Environmental Protection Agency (2008b).
15. The Environmental Objectives Council’s Progress Review Group included representatives of central government agencies, county administrative boards, local authorities and county councils, environmental NGOs and the business sector.
Action), Viveka Palm (Statistics Sweden) and Christer Ågren (Air Pollution & Climate Secre-tariat). These individuals are not responsible for the final text of the report.
5.4.3 target audience
The report’s target audience consists of the vari-ous stakeholders involved in Sweden’s environ-mental objectives system, such as the Riksdag, the Government, central government agencies, county administrative boards, local authorities, non-governmental organisations and the business sector, as well as the media and interested mem-bers of the public.
hectare is defined as a hectare of biologically pro-ductive land or water with world-average prod-uctivity in a given year.) For other countries such as Austria and the United States, which have a similar standard of living, the figures are 5 and 9.4 gha per person, respectively. The gap in rela-tion to countries with lower living standards is considerable. Ethiopia and Pakistan, for instance, have a total ecological footprint of only 1.4 and 0.8 gha per person, respectively. Over-consump-tion in the richer parts of the world, in other words, is offset by under-consumption and poverty in other regions.
Ecological footprints are sometimes expressed as a number of planet earths, rather than in global hectares. If the entire population of the world were to have the same lifestyle as the people of Sweden, almost three planets would be required. To allow everyone on earth to adopt a lifestyle like that of the US, it would take five planets. According to WWF, the limit to the earth’s biological produc-tivity, its biocapacity, was passed as early as the 1980s. Since then, human demand has continued to grow, and today the earth’s biocapacity is ex-ceeded by 30 per cent.18 WWF figures for 2005,
moreover, show the total ecological footprint of the EU to be 4.7 gha per person, compared with the EU’s total biocapacity per person of only 2.3 gha. In other words, the EU’s per capita footprint is twice its available biocapacity.
6.1 Overall picture of consumption
and Swedish trade
The United States, Canada, Europe, Australia and New Zealand are home to 12 per cent of the world’s population, but account for some 62 per cent of private consumption in the world.16
To gain a full picture of the ecological challenge which consumption represents, we need to know what environmental pressures it involves. It is also important to understand what a possible continu-ation of current trends will entail.
6.1.1 Sweden has a somewhat smaller ecological footprint than comparable countries
The ecological footprint is an overall measure of the pressures which consumption places on the environment. It can be broken down into six components:
• carbon footprint (the area required to absorb carbon dioxide emissions)
• cropland • grazing land • forest
• fishing grounds • built-up land.17
WWF, in its Living Planet Report 2008, pub-lished figures showing the ecological footprints of different countries. Sweden’s ecological footprint is 5.1 global hectares (gha) per person. (A global
6
Global environmental pressures from
consumption – a study of five areas
16. Worldwatch Institute (2004). 17. WWF (2008c). (Online.) 18. SOU 2009:83, Bilagedel.
6.1.2 Sweden’s goods exports consist largely of industrial products19
Like many smaller European countries, such as Belgium, the Netherlands and Austria, Sweden is highly dependent on trade. In larger countries like the US and Japan, exports generally make up a smaller proportion of GDP, chiefly because of their sizeable domestic markets. As a result, a larger share of their trade can take place within the country.20
Europe provides three-quarters of Sweden’s ex-port market for goods – a share that has remained relatively stable in recent years. Just over a tenth of Swedish goods exports go to Asia. The share of Sweden’s export market accounted for by the most rapidly expanding parts of Asia, including China, almost doubled between 1980 and 1997.21
Exports consist largely of industrial goods, such as vehicles, machinery and forest products. Swe-den also exports significant quantities of elec-tronic, electrical and telecom products.22
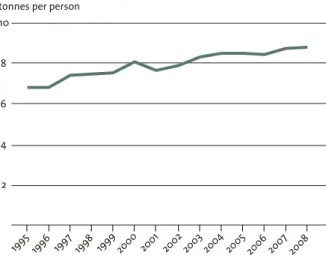
6.1.3 Swedish imports of energy products and food are growing
Sweden’s imports of goods increased from around 7 tonnes per person in 1995 to almost 9 tonnes per person in 2008.23 Over that period, petroleum
products made up the largest share of the total, 40–50 per cent. They were followed by timber, which accounted for 10–18 per cent of imports during the same period.
By far the largest share of Swedish imports by value, around 85 per cent, comes from Europe, and primarily from EU member states. The single biggest exporter to Sweden is Germany, which ac-counts for almost 18 per cent of the value of the country’s imports. Other nations from which sig-nificant quantities of goods are imported are Den-mark, Norway and the United Kingdom.24
The EU countries’ large share of goods imports to Sweden can be attributed to the fact that the statistics do not include information about coun-tries of origin. In other words, judging from the
High-income countries
Total 6.4 gha per person Middle-income countriesTotal 2.2 gha per person Low-income countriesTotal 1.0 gha per person
Carbon footprint Cropland Grazing land Forest Fishing ground Built-up land
figure 1. Ecological footprints of high-, middle- and low-income countries
source: wwf
WWF’s study19, in which
countries were grouped according to World Bank income thresholds, shows that high-income countries have, on average, an ecological footprint more than 6 times larger than that of low-income countries.
19. WWF (2008c). (Online.)
20. Ekonomifakta, Exportandelar – internationell jämförelse. (Online.) 21. Ekonomifakta, Sveriges varuexportmarknader. (Online.)
22. Ekonomifakta, Varuexportens sammansättning. (Online.) 23. Statistics Sweden, Utrikeshandel med varor. (Online.) 24. Ekonomifakta, Sveriges varuimportmarknader. (Online.)
statistics, goods appear to come from the last country of shipment, regardless of where they in fact originate. This means that Swedish imports from the rest of the EU may in reality be over-estimated.25
Electronic, electrical and telecom products are significant imports to Sweden in value terms. Other important products are vehicles, oil, food, clothes and shoes. In 2008, energy products, such as crude oil and oil products, accounted for the biggest single increase in imports with respect to economic value. Food imports also rose sharply. Imports of cars and metals, on the other hand, showed a marked decline.26
6.1.4 Activities with major environmental impacts identified
A major study for the European Commission identified a number of core activities as having the most significant impacts on the environment.27
They were combustion processes, solvent use, agriculture, metal extraction and refining, use of heavy metals, housing and infrastructure, marine activities and the chemical industry. Among con-sumer products, food and drink, private trans-port and housing put most pressure on the en-vironment, accounting for 70–80 per cent of the environmental impact of consumption. In terms of materials, animal products, crops, plastics, oil for heating and transport, concrete, coal for electricity, lignite for heating, iron and steel, gas for heating, and paper and board are the ten cat-egories with the greatest adverse impacts on the environment.
6.2 Climate – Swedish consumption’s
contribution to greenhouse gas
emissions
28Emissions of carbon dioxide, methane, nitrous oxide and other greenhouse gases are changing the earth’s climate. The biggest factor behind these emissions is the use of fossil fuels such as coal and oil, together with deforestation around the world. The effects on climate are just as great, no matter where on earth the emissions occur. It is in fact immaterial, therefore, whether Swedish consumption causes emissions in Sweden or in other countries; the effect on climate depends on the total emitted worldwide.
6
2 8 10
4
tonnes per person
figure 2. Swedish imports of all goods, 1995–2008
1997 1998 1999 1996
1995 2000 2001 2002 20032004 200520062007 2008
source: statistics sweden, foreign trade – exports and imports of goods
The total value of goods imported to Sweden in 2008 was just over SEK 1,000 billion, an increase of 6 per cent on the previous year.
25. Statistics Sweden website.
26. Ekonomifakta, Varuimportens sammansättning. (Online.) 27. Tukker et al. (2006).
28. Unless otherwise indicated, the information in section 6.2 is from Swedish Environmental Protection Agency Report 5903,
Konsumtionens klimatpåverkan (Swedish Environmental Protection Agency 2008b). An English version of that report has
6.2.1 Estimate of Sweden’s global greenhouse gas emissions
Using Statistics Sweden’s environmental accounts and input–output analysis, it is possible to esti-mate the emissions of greenhouse gases occurring in Sweden and the emissions to which Swedish consumption gives rise in other countries.29 This
was done in Swedish Environmental Protection Agency Report 5903, Konsumtionens
klimat-påverkan (published in English as The Climate Impact of Swedish Consumption), which forms
the basis for this section. The statistics are from 2003, the most recent year for which data from the various sources were available. Where the data were incomplete, estimates and assumptions had to be made. The figures presented should therefore be interpreted as representing orders of magnitude. In addition to the method used in the Environmental Protection Agency report, the car-bon footprint approach can provide a picture of the greenhouse gas emissions arising from con-sumption. That approach is described in more de-tail in section 7.4.
6.2.2 Emissions in Sweden, including international transport
Emissions of greenhouse gases in Sweden in 2003, including international transport, totalled around 76 million tonnes of carbon dioxide equivalent (Mt CO2e). The sources of these emissions in-cluded transport, industrial production and heat-ing. Carbon dioxide accounts for just under 80 per cent of the country’s total greenhouse gas emissions.
Emissions from international shipping and aviation refuelling in Sweden, known as ‘interna-tional bunkers’, make up more than 7 of the 76 Mt CO2e mentioned above. Of these 7 Mt CO2e,
fuel consumption for international aviation ac-counts for just under 2 Mt CO2e. However, a
more detailed analysis suggests that, from a con-sumption perspective, emissions from passenger travel by air should be higher. This could, for ex-ample, be because passengers on long-haul flights from Sweden fly via hub airports in Europe and the associated emissions are reported in the coun-tries in question.
6.2.3 Emissions linked to exports from Sweden
Emissions occurring in Sweden that can be linked to goods and services exported from the country are estimated at 24 Mt CO2e. As these products
are consumed by people living in other countries, the emissions associated with them have to be de-ducted from total emissions in Sweden when a consumption perspective is applied.
Emissions of carbon dioxide alone from the production of Swedish exports in 2003 are esti-mated at 21 million tonnes.30 Steel and products
containing steel are the dominant source, but production of refined oil products and paper and pulp for export also gives rise to large carbon di-oxide emissions in Sweden.
Exports of agricultural products generate emis-sions of other greenhouse gases than carbon di-oxide – including methane, estimated at 0.5 Mt CO2e, and nitrous oxide, with emissions of 2 Mt
CO2e.
29. In the present study, the analysis covers carbon dioxide, methane and nitrous oxide. 30. Statistics Sweden (2008).
6.2.4 Emissions linked to imports to Sweden
Imports to Sweden in 2003 gave rise to green-house gas emissions in other countries estimated at around 43 Mt CO2e. Of that total, carbon di-oxide accounted for some 36 Mt CO2e and me-thane and nitrous oxide for roughly 7 Mt CO2e. The manufacture and transport of goods im- ported to Sweden, in other words, resulted in emissions abroad that have to be included when Sweden’s emissions are viewed from a consump-tion perspective.
Sweden imports many more types of products than it exports, with the great majority of its im-ports coming from countries in its immediate vi-cinity. Germany, Denmark and Finland together account for 34 per cent of the total emissions as-sociated with Swedish imports.
Estimates of emissions linked to imports to Sweden involve uncertainties, however, owing to the fact that not all countries produce data of the same quality as Sweden. There is also the pos-sibility that goods from countries such as China may be imported into Europe through ports in the Netherlands, for instance, which is then classed as the country of origin when they are subsequently imported to Sweden. In addition, emissions fig-ures may be misleading in the case of low-wage countries, as they are calculated on the basis of the value of the goods imported, rather than the weight or volume. As an example, it may be men-tioned that, in value terms, only 2 per cent of Swedish imports originate in China.
6.2.5 Global greenhouse gas emissions from Swedish consumption
From a consumption point of view, then, Sweden’s emissions of greenhouse gases in 2003 totalled 95 Mt CO2e. For 70 Mt CO2e of that figure, the
un-certainty of Swedish statistics and statistics of cor-responding quality in other countries is relatively small. For the remaining 25 Mt CO2e, the
uncer-tainty is greater. The total figure should therefore
be said to be of the order of 85–105 Mt CO2e.
With a Swedish population of just over 9 million, that corresponds to emissions from consumption of around 10 tonnes of CO2e per person per year.
There is a relatively large difference between the emissions occurring in Sweden, including international transport, and those estimated to result from all Swedish consumption – includ-ing when production takes place abroad. This is made clear by the fact that emissions from a con-sumption perspective in 2003, of the order of 95 Mt CO2e, were 25 per cent higher than the 76 Mt
CO2e released in Sweden during the same year,
in-cluding international transport. And if emissions from international aviation and shipping refuel-ling in Sweden are excluded, emissions end up 35 per cent higher from a consumption perspective than from a production point of view.
The order of magnitude of these figures is in line with earlier estimates. However, the results of different studies are difficult to compare: different model approaches may have been used, the
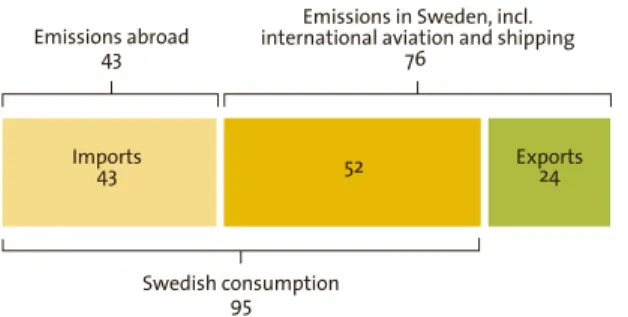
ref-figure 3. Greenhouse gas emissions (million tonnes of carbon dioxide equivalent)
Imports
43 52 Exports24
Swedish consumption 95
Emissions in Sweden, incl. international aviation and shipping
76 Emissions abroad
43
source: swedish environmental protection agency
To estimate the global emissions of greenhouse gases associated with Swedish consumption, emissions arising from imports to Sweden have to be added to those occurring inside the country, and emissions attributable to exports have to be subtracted. This is known as applying a consump-tion perspective to emissions. This diagram shows that, in such a perspective, consumption in Sweden gives rise to emissions of 95 million tonnes of CO2e.
erence year may vary, or one study may perhaps include only carbon dioxide, while another also covers methane and nitrous oxide, as is the case here.31,32
6.2.6 land use change and forestry in other countries, and foreign travel
The estimates of greenhouse gas emissions made in the Swedish Environmental Protection Agency’s study may understate the true figure. They are based on data from Swedish environmental accounts, and the input–output tables used do not include emissions from sources such as land use change, forestry and some foreign travel. These emissions are estimated at an additional several million tonnes.
LANd uSe ANd fOreSTry
Almost a fifth of the total global human influence on climate is due to land use change and forestry, chiefly harvesting of tropical rainforests.33
Con-sumption in Sweden contributes to these pres-sures, owing to Swedish imports of food, ani-mal feed, timber products and fuels from Brazil and Malaysia in particular. In Brazil, Malaysia and Indonesia, large areas of rainforest are ing felled. In Brazil, moreover, savannahs are be-ing converted to pasture and arable land. And in Malaysia and Indonesia, former rainforest areas with high levels of peat are being used for cultiva-tion. All these activities release large quantities of greenhouse gases, especially carbon dioxide. Very rough calculations indicate that emissions from land use change linked to Sweden’s imports could amount to 2–3 Mt CO2e per year.
fOreIgN TrAveL
In a consumption perspective, greenhouse gas emissions from foreign travel by people living in Sweden also have to be taken into account. As indi-cated earlier, emissions from international aviation and marine bunkers are included in the input–out-put tables. But that does not mean that the tables cover all passenger travel abroad, and the latter therefore has to be studied separately.34 Total
emis-sions of carbon dioxide from foreign travel come to almost 5 million tonnes, and if the other green-house gases are included the figure rises to nearly 8 Mt CO2e. Emissions associated with foreign
vis-itors to Sweden are not included in a calculation of releases from Swedish consumption. The emis-sions Swedes give rise to when visiting other coun-tries and those caused by tourists in Sweden may here be assumed to cancel each other out.
6.2.7 is 10 tonnes of CO2e per person a lot?
Most industrialised countries have higher emis-sions figures from a consumption than from a production perspective. When emissions are pre-sented on a consumption basis, industrial na-tions like Sweden, with a high volume of trade and low domestic emissions per capita, can be expected to have the largest ‘mark-up’ in relative terms. In 2003, average emissions from Swedish consumption were around 10 tonnes of CO2e per
person – 25–35 per cent more than the emission per person in Sweden from a production perspec-tive. Sweden was (and is) one of the industrial-ised countries with the lowest per capita domestic emissions. The average for industrial countries in 2004, from a production perspective, was around 16 tonnes per person.
31. Carlsson-Kanyama et al. (2007). 32. WWF (2008b). (Online.)
33. Intergovernmental Panel on Climate Change (2007). (Online.) 34. Åkerman (2008).
To reduce the risk of very substantial impacts on global climate, world greenhouse gas emissions need to start falling in the near future, and to be largely eliminated over the course of this century. For the average Swede, emissions need to be cut to a fifth of their present figure by 2050 if they are not to exceed the desirable level of global emis-sions, calculated on a per capita basis.
6.2.8 What activities cause emissions?
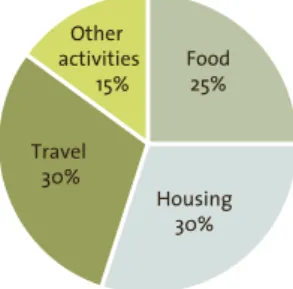
Just over 80 per cent of greenhouse gas emissions are attributable to private consumption and a lit-tle under 20 per cent to public consumption, for example in schools, health and social care.
Private consumption can in turn be broken down into food, accounting for a good 25 per
cent of emissions; housing, just over 30 per cent; travel, a little under 30 per cent; and other ac-tivities, just short of 15 per cent. These figures are based on all emissions over the entire life cycles of products, from production to use and waste dis-posal. Emissions from public consumption could be divided into similar categories, but the data to do so are not available.
As examples of important individual activities, the following may be mentioned:
• A car run on petrol may emit 2–3 tonnes of CO2e in a year if it is driven 15,000 km. A sin-gle individual’s holiday flight from Sweden to Asia return emits roughly the same amount.
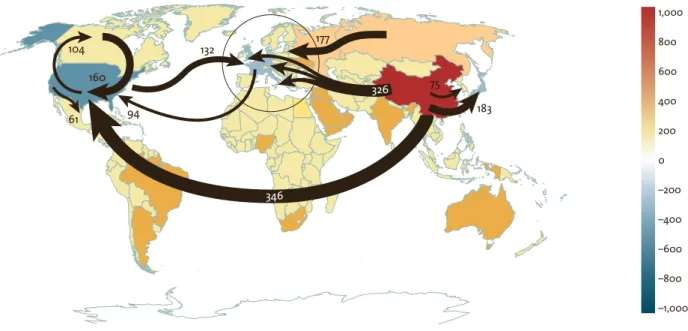
104 160 61 94 132 177 183 75 326 346 –1,000 –800 –600 –400 –200 0 200 400 600 800 1,000
figure 4. Carbon trade balances in 2004 (million tonnes of CO2)
source: center for international climate and environmental research – oslo, stockholm environment institute and carnegie mellon university
Blues indicate countries whose imports generate higher emissions of carbon dioxide than the production of the goods they export, while reds and yellows identify countries whose exports give rise to higher emissions than their imports. The arrows show the largest trade
flows between countries and regions in terms of carbon dioxide. Most industrialised countries have higher emissions figures from a consumption perspective than from a production perspective.
• One piece of beef a day may entail emissions of over 1 tonne of CO2e per person per year, while a different kind of diet could give rise to emis-sions only a tenth as high.
6.3 Air pollution – consumption
and sulphur and nitrogen oxide
emissions
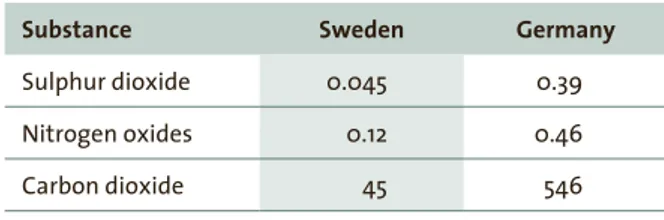
35Emissions to air of pollutants such as sulphur and nitrogen oxides have environmental effects that include acidification and eutrophication, as well as effects on human health. In recent years, grow-ing attention has also been paid to the health ef-fects of particulate emissions. The impacts of emissions depend on factors such as local air qual-ity, the sensitivity of ecosystems, and past pollu- tant loadings. It is therefore difficult to assess what environmental effects arise in other coun-tries as a result of Swedish consumption.
6.3.1 Emissions estimated using input–output analysis
The scale of sulphur and nitrogen oxide emis-sions attributable to Swedish consumption has been estimated using Statistics Sweden’s environ-mental accounts and input–output analysis. The emissions presented are for 2003, the most recent year for which updated data for the input–out-put analysis are available. Given that emissions of these pollutants in Europe have decreased rela- tively sharply since then, the figures are in all probability overestimated compared with what they would have been with more up-to-date in-put–output tables.
6.3.2 Sulphur and nitrogen oxide emissions have fallen
Efforts to reduce emissions of sulphur and nitro-gen oxides by means of policy instruments and international agreements have been successful. In Europe, sulphur dioxide emissions fell by 69 per cent from 1990 to 2007, and releases of nitrogen oxides by 31 per cent from 1990 to 2005.36 As
a result, atmospheric deposition in Sweden de-creased by 59 per cent in the case of sulphur and 23 per cent in the case of nitrogen between 1989– 91 and 2006–8.37
The main focus of action to reduce atmos-pheric emissions of sulphur and nitrogen oxides has been on land-based sources. Achieving the international agreements needed to curb releases from shipping has been more difficult. Since the late 1990s, however, Sweden has made use of economic instruments (such as fairway and port charges differentiated according to environmen-tal performance) that have helped to reduce these emissions. A couple of years ago, moreover, an international agreement was reached within the
figure 5. Greenhouse gases from private consumption
Food 25% Housing 30% Travel 30% Other activities 15%
source: swedish environmental protection agency
Emissions of greenhouse gases from private consumption can be divided between food, housing, travel and other activities. The latter include, above all, purchases of clothes and shoes.
35. Unless otherwise indicated, the information in section 6.3 is based on data produced by Statistics Sweden (Wadeskog 2009). 36. European Environment Agency, APE002 – EEA-32. (Online.)
International Maritime Organization (IMO) to significantly reduce shipping emissions of sul-phur, especially in north European waters. A deci-sion has been taken to bring about further cuts.38 6.3.3 Sulphur dioxide
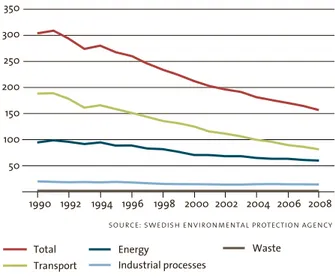
Sources of sulphur dioxide emissions in Sweden include the energy sector and various industrial processes. The 1990s saw a sharp decline in total emissions.39
The figures calculated for this section by Stat-istics Sweden suggest that emissions in Sweden, excluding international transport, are largely at-tributable to the production of exports. From a Swedish consumption perspective, these emis-sions can be deducted from the total. Figure 7
shows the orders of magnitude, in 2003, of emis-sions in Sweden from production for export and for domestic consumption, and emissions abroad from the production of the products Sweden im-ports. In addition, the figures are shown both in-clusive and exin-clusive of international shipping, as the latter is such a dominant source.
In many cases, goods imported for consumption in Sweden are produced in countries with energy systems that are not as clean as that of this coun-try. This may be one of the reasons why imports to Sweden (excluding international transport) re-sult in larger emissions of sulphur dioxide than ex-ports from Sweden. Land-based emissions, in other words, are higher from a consumption point of view.
60 40 20 100 120 80 thousand tonnes
figure 6. Sulphur dioxide emissions in Sweden, 1990–2008 1994 2002 1990 1992 1996 1998 2000 2004 2006 2008 Transport Waste Industrial processes Energy Total
source: swedish environmental protection agency
Emissions of sulphur dioxide were below the interim target of 50,000 tonnes, set under the environmental quality objective Natural Acidification Only, several years before the target year 2010.
figure 7. Sulphur dioxide emissions in 2003 (thousand tonnes) Imports 80 Imports 46 Exports 97 Exports 28 28 16 Emissions in Sweden 125 Emissions in Sweden 44 Excluding international transport
Including international transport
Swedish consumption 108 Swedish consumption 62 Emissions abroad 46 Emissions abroad 80
source: statistics sweden
This diagram shows emissions in other countries linked to Swedish consumption and emissions in Sweden associated with domestic consumption and exports. The lower bar also includes emissions from international shipping, which greatly increases the emissions figures.
38. International Maritime Organization website.