Nr 166A - 1981
Statens v'ag- och trafikinstitut (Vl'l) - 581 01 linkoping
ISSN 0347-6030 National Road & Traffic Research Institute - S-581 01 Linkoping - Sweden
Public transport in the era
of the automobile
PUBLIC TRANSPORT IN THE ERA OF THE AUTOMOBILE
Condensed version of a report in Swedish titled
"KOLLEKTIVTRAFIKEN I BILSAMHALLET".
Kenneth Asp, Swedish National Institute for Road and
Traffic, Linkoping,
Olof Lundin, Department for Human and Economic
Geo-graphy, Goteborg University.
Report sponsored by Swedish National Institute for
Road and Traffic, Linkoping, Sweden.
vw.
,w?
'
4
Contents
Page
1 BACKGROUND 1
2 SPATIAL DISTRIBUTION OF DWELLINGS AND WORK 3
PLACES
3 PRIVATE CAR TRANSPORTATION V. PUBLIC 6
TRANSPORTATION
3.1 The family car concept 6
3.2 Main trips 14
3.3 Long distance travelling 22
3.4 Can public transport substitute private 25
car transport?
3.5 Travelling time and distance I 26
3.6 Travelling hour by hour 34
4 AN ALTERNATIVE WAY OF STUDYING TRAVEL 37
BEHAVIOUR
4.1 Demand and supply 37
5 MAIN RESULTS 48
Literature
ABSTRACT
This report-studies a travel survey implemented by the
Swedish National Central Bureau of Statistics in 1978. It structures vital results from the travel survey into a frame of transport policy aspects where balancing between public transport and own car transport is put
in focus.
Long term travel consumption is stimulated by urban
sprawl and separating work places and dwellings. These
trends are made possible by widespread car ownership (50 % of single persons and 90 % of married couples owns a car in Sweden).
Work trip constitute 37 % of the total number of trips but only 21 % fo transportation output. Recreational trips correspond to 29 % total tripnumber but 45 % of transportation output. Earlier estimates give higher rates for work trips and lower for recreational
purposes.
In cities work trips are more often made by public transport but this partly leads to low rates for walking and cycling. 59 % of schooltrips are made by public transport making them constitute 15,6 % of total number public transport trips. The number of car passengers for work trips nearly equals that of work trip public transport passengers. This makes ride sharing nearly as inportant as public transport. Generally speaking low use is made of public transport except in big cities. Improvements would therefore become costly (without giving more revenues). Those who prefer going to work in their own car are often
saving a lot of time which makes public transport unatractive to them.
II
Transport policy debate in Sweden overstresses big city aspects. This makes traditional public transport
solutions unduly attractive. The report prefers more research and practical experiment with semi public transport solutions (eg para transit). Thats why the report raises the question if public transport of the present design is not on the wrong track.
PUBLIC TRANSPORT IN THE ERA OF THE AUTOMOBILE SUMMARY
During the years 1976 to 1978 the National Swedish Road and Traffic Research Institute (VTI) participated in an ad hoc working group which designed and planned a survey of Swedish National Central Bureau of
Statistics (SCB). When results from the survey started
to arrive in the autumn of 1979, VTI decided to ask Olof Lundin (of the Department for Human and Economic Geography, Goteborg University) to make a report on the material. The report has been co-authored by assistant professor Kenneth Asp of the VTI.
The report contains the vital results from the travel survey. It also tries putting the results into a frame of mainly transport policy aspects relevant to problems around public transport versus own car transport.
The travel survey of the SCB is built upon a stratified random sample of 8 500 interviews made by SCB. It refers to the crucial dilemma of furnishing peOplev thenlada ate transport supply without letting this lead to unduly
financial consequences for the community as a whole. Growth of private car owner-ship has hollowed out the base for public transport and has made it difficult for the community to maintain the standard of public trans-port supply.
The report points at the longterm consequences on travel consumption of urban sprawl and the separation of
housing and places of work. Transportation output by all modes of public transport has doubled since 1950 but transportation output by private cars has increased
8-fold in the same time. Urban decentralization and
IV
deconcentration have characterized the pattern of
housing the last three decades. It would thus be extre mely costly to supply these sparsely built up areas with public tranSportation e.g. if an acute energy
shortage would emerge.
The travel survey studies some back-ground variables. From these the report concludes that most families
consisting of a married couple (living together) owns
a car. Only about 50 % of singles are car owners, nearly 90 % of married couples owns a car and practically all married families with children are car owners. Young people without occupation living in greater cities and old age pensioners are seldom car owners. No geographi-cal differences like that are found among families with children; more than 85 % of them living in big cities
are also car owners.
In the survey the so called main trips are at the focus of the study. Trips to and from work comprised 37 % of the number of trips but result in only 21 % of trans portation output. Recreational trip purposes comprises 29 % in number but raise to 45 % of transportation out
put. In other words, work trips are rather short and
they don't correspond in transportation output those shares given to them in other estimates made previously. In a corresponding way previously made surveys have
underestimated the transportation output for recrea tional purposes.
Work trips are more seldom made by own car and more often made by public transport in cities. Outside cities more people are walking or cycling to and from work. Business trips are modally dominated by the car.
Shopping and similar service trips are equally parted
between own car travel and walking/cycling. Trips for recreation and social visits are also modally halved between walking/cycling and car travel in most areas.
Among trips by_public transport work trips are the most
usual purpose (45,4 %) but school trips are second
(15,6 %) partly due to abandonment of small, local schools in the country side in other than the lowest forms. Work trips are also vital among trips made by car drivers and car passengers (respectively 38,3 % and 25,6 %) but for car passengers visits and recreation together comprise 40 %.
If you spread the total number of trips on trip purposes
the low number of trips by public transport changes the
image of the picture (only 13,9 % of total number of\
trips are made by public transport).
0
Work trips are made in 68,2 % as a car driver, in 14,6 6 as a car passenger and in 17,2 % as a public transport passenger. This means that ride sharing by car is almost as significant as public transport. But contrary to
work trips, school trips are made by public transport to a very significant degree (59,0 %). One can also conclude that public transport is more or less a city phenomenon since 41 % of all trips made by public trans-port relates to the capital region of Stockholm.
Long distance trips are dominated by car travel.
Trips less than 2 kilometres are dominated by walking and cycling. Increasing the distance means sharply falling rates of walking and cycling. Over 5 km own
car travel generally takes 3/4 and public transport 1/4.
Parts of the modal split attributes to dwelling struc ture and the standard of supply of the public transport. Greater communities, and especially cities, have large rates of lodgings in large houses with more than one family. These areas have often a rather good public transport supply as well regarding distance to bus stops as regarding time-table density. Only in great VTI-REPORT 166A
VI
cities and especially in Stockholm the public transport rate is high. High rate public transport also consists mainly of work trips. For those who prefer going by car to work their gain in travel time is often of great significance. More than half of them are now claiming one-way trip times of less than 20 minutes compared to an estimated public transport one-way trip of 60 to 90 minutes. Most of the car travellers are seeming to have
legal right of deducting car mileage money from their income for their work trips. This is allowed in Sweden if you spare at least 90 minutes a day on going by car to and from work (two-way-trip).
Public transport has two definite work load humps in the morning and in the afternoon. Total trip schedule however, has a bell formed soft top at lunch and a much greater intensity after 6 p.m. It is difficult for
public transport to gain more passengers other than for
work trips and school trips, where it is rather attrac tive. For work trips and school trips it is now however rather heavily strained and additional passengers would mean that it would be necessary to put in more buses,
drivers etc.
In one chapter the report outlines tranSportation needs of different socio economic strata. That leads to no definite recommendations for which public transport would be suited. This approach is in contrast to tradi-tional thinking claiming that denser time tables and more bus lines automatically gives public transport new passengers, and in the report the enormous cost in
creases that would follow suit are pointed to. To make matters worse revenues from public transport are now-adays very scarce. This depends on the widely used low cost-unlimited-numbers of-trips-tickets valid one month. Attractive schemes therefore seldom leads to
increased revenues. Moreover the amount of tax subsi-dies to public transport are now so great that it is VTI-REPORT 166A
VII
politically difficult motivating increases in subsidies.
Perhaps a solution is to be found among those semi
public forms of traffic called paratransit. Research and practical experiment around this should be stimu-lated.
One can conclude that the travel survey implemented by the National Central Bureau of Statistics gives a lot of ideas which should be contemplated. People in Sweden are as a whole totally dependent on their own cars for supplying their needs of travel (perhaps not counting city inhabitants). In the cities public transport rates are higher but the rates of walking and cycling in
those areas are low. City aspects of Swedish transport policy are evidently overstressed. This often leads to recommendations of traditional puclic transport solu tions even in those areas where they are not attractive. Tax subsidies for public transport are so great that no more stimulation of travel habits are to be expected. Energy reasons are also hampering such a stimulation, especially in those parts of the country where public transport is not attractive. In those areas people generally don't use their public transport supply to a greater extent even though the supply might seem at least theoretically to be of a good standard.
That is why the report is asking if public transport of present design is not on the wrong track.
1 BACKGROUND
During .1978 'the Swedish National Central Bureau of
Statistics (SCB) made an extensive survey of Swedish
travel behaviour and volume. The National Swedish Road and Traffic Research Institute (VTI) has taken a
con-tinuous part in planning, implementing and analysing
this survey. When, in the beginning of 1980 computer tables from the survey started to emerge, VTI engaged
Olof Lundin. (MA) (HE Goteborg University to :make a
detailed study of the results. Work has been carried out together with assistant professor Kenneth Asp cf the VTI.
This report is an abridgement of a report in Swedish
entitled "KOLLEKTIVTRAFIKEN I BILSAMHALLET"
(VTI-rapport 166). It tries to structure main results from the travel survey into a context of transport policy
reasoning. Of special interest is the problem of
private car transport v. public transport. During the late 1980 and early 1981 most computer tables from the travel survey will be published by SCB together with an analysis around sampling problems etc.
Sampling surveys are often used to analyse
trans-portation. In Sweden sampling technique is IHKXi now adays to produce statistics regarding truck transports
and in 1975 there was a sampling survey coupled to
home interviews concerning long distance travelling.
British and Finnish Travel Surveys had produced
inte-resting' results and it was subsequently' decided to
make the Swedish Travel Survey based on a sample of 8
500 people who were interviewed at statistically
representative days. All trips more than 200 m of the
day before were to be included together with back
ground variables such as car ownership, age, family
structure etc. From a scientific point of view both
the Swedish travel survey and its foreign counterparts
should be repeated at periodic intervals (e.g. every
five year). If so, one could reduce the volume of the
survey both by reducing the sample and its regional
and socio economic splitting just to make it possible to carry out. We think results from periodic surveys could become extremely interesting by not only giving a snapshot view of travel pattern but also describing the dynamics of its evolution from time to time.
This report tries to make a fair overview of
inte-resting results from the Swedish Travel Survey of 1978
(IRRJ -78). When. comparing automobile transport. with
public transport we often use a social cost perspec-tive instead (n: a pure firmbased commercial view. To
achieve a corresponding tax base modern transport
policy of EurOpean nations are often pricing the traf
fic via some kind of marginal road cost principle.
Pricing should then be based on the cost for the soci-ety of supplying or tolerating the actual transport. Citizens on the other hand have a right to demand a certain transportation standard even in remote areas. However, costs for subsiding public transport both in remote areas and in cities have accelerated vigouri
ously. Therefore it is essential that transport
ser-vices subsidized by the society are not overused, that
is people going e.g. by bus when walking or cycling
would have been healthier both for the individual and the society.
2 SPATIAL DISTRIBUTION OF DWELLINGS AND WORK PLACES
Dispersed housing generates more travelling than con
centrated dwelling structures. Large factories and
other work places impressed by scale economies also
leads to more travelling (as well as more goods
trans-port). In Sweden post World War II decades have in
volved bgth these trends, i.e. dispersing the housing
and concentrating work places, and have subsequently meant an enormous increase in passenger transportation
output (see figure 2.1).
100 100 90 " 90 80 -' I 60 7O 70 60 ' 60 Persoan 50 - 50 40 " " 4O 30 " ' 30
0 I
sparvag, T- bana. buss, sjbfart, luftfart .
I 0
J rnvdg
I l I T l
Ar1950 1955 1960 1965 1970 1975 1980
Figure 2.1 Domestic transportation output 1950-1980,
(bill pass km).
Source: Swedish Ministry of Transport Gov.
proposals to Parliament.
Legend: Personbil = car
Sparvag, T bana etc. = Trams, U-ground,
bus, water, air
Jarnvag = Railway
This increase stems :mainly from. wide spread owning (and using) of cars. Owning a car is often a necessary requirement to be able to migrate to more dispersed areas of dwelling, but car ownership is certainly also
influenced by increased living standard in general.
However, intensive car traffic causes noise and
ex-haust emissions, and not least a lot of accidents. For
these reasons jpublic transport. is increasingly'
sub-sidized and stimulated, while car transport is
re-stricted. Vast efforts are made to estimate complete
social costs for car travelling but little research is
focused on both costs m benefits of car traffic.
Perhaps that is because social benefits are even less prone to measurement than social costs.
Anyhow, supplying regions with good public
transport-ation is difficult. This is often due to the fact that
functional regions tends to be asymmetrical with
regards to their centres of work. Swedish so called
A-regions, which contain local working markets are a
good example of functionally arrondated regions. A
majority of these are asymmetrical (see figure 2.2).
K174
A
A
Symmetrically Asymmetrically
located region center located region center
Figure 2.2 Region form and center location
Summarising the current tendencies of dwelling dis persal and work place concentration one can conclude:
Current tendencies in dwelling shows a long per-spective dispersal, generating many and long trips to and from work.
- Current trends in work. place location are
con-centrating these, generating longer trips to work.
- Forms of functional regions are often asymmetrical
making it difficult to supply them with public
transport.
- Current trends towards every family owning a car
make people less prone to use public transport.
PRIVATE CAR TRANSPORTATION V. PUBLIC TRANSPORTATION
3.1 The family car concept
Increased and general car ownership has caused greater
mobility but also problems concerning noise and
ex-haust emissions, especially in city areas. Public
debate is often initiated in great cities and mass
medias have duly concentrated their debating efforts regarding traffic on the problems with the car. Conse-quently they have also stressed the good sides of pub
lic transport praising the virtues of dense, attrac tive public transport giving equality between sexes,
equality between social strata, good environment,
fewer traffic accidents. Of lately stress has been put upon energy arguments in general and sometimes
especi-ally advocating electric means of transport like
trains and trolley buses.
All these arguments are very much aimed at dense popu
lation structures. In a country like Sweden with 8
mill. people on an area the size of France (more than
50 mill. inhabitants) and with only one large city
area (Stockholm) such arguments would objectively seem lopsided or biased, but leading mass medias are con centrated to Stockholm. Evidently public debate on car
traffic nationwide has been unduly influenced by city
arguments. But how widespread is really car ownership? Figure 3.1 gives a hint.
:2 7
/
z
/
/
00001 a a o _1 I o o o I I o o a 4 I o o o 1 I o o a 1 Ioooq ' I I I I I I I I p.000! D I I I U I I I I I boo-q I I I I 1 I I I I 1 I. a o o 1 I o I o 1 n I o o 1 o o o o 1 0001 0000 poo.D I I I I o L
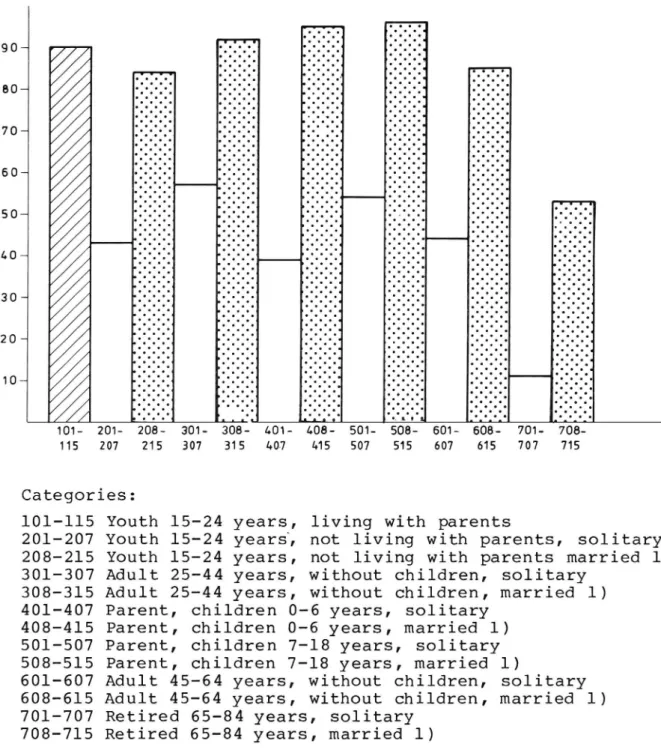
201-207 203- 301- 566: 401215 307 315 407 Categories: 101-115 201-207 208-215 701-707 708-715 Youth 15-24 years, Youth 15-24 years, Youth 15 24 years, Adult 25 44 years, Adult 25-44 years, Parent, 408-A15 501- $06- 501- Sbéi515 701-707 76m: children 0-6 years,
living with parents
not living with parents, solitary not living with parents married 1) without children, solitary
without children, married 1) solitary
Parent, children 0-6 years, married 1)
Parent, children 7-18 years, solitary
Parent, children 7 18 years, married 1) Adult 45 64 years,
Adult 45 64 years, Retired 65-84 years,
without children, solitary without children, married 1)
solitary Retired 65-84 years, married 1)
l)Married or living together under similar circum-stances. This is valid for all figures.
Figure 3.1 Socio-economic
VTI REPORT 166A
Figure 3.1 shows a distinctly higher car disposal among
married persons (dotted) than among solitary persons.
Youths living with their parents are separated by a
different striping since for them car disposing is not
"of their own". One in two solitary people dispose a
car, nine in ten married persons dispose a car. This is a much higher degree of car disposal than might theo retically (randomnally) be expected (3 in 4).
Car ownership, however, is not evenly spread from a spa tial aspect. To study such things we have to introduce a concept called T-regions. They are mapped in figure 3.2
FARDMEDELSFURDELNING BEROENDE PA T'ATORTSTORLEK Mu XVIII \ K\ W ll ' /
OZ // // A//// /'X //, 2'50 / . . /V J/
055 1 l 3
1L 30134 4% | 45
25 500 0 2 .. 2 SCI] 1 [m TUSENTALs IN-A
l-GLESBYGDéf TATORT )1 v NARE '
I \ smunu
[1|'l'rrlll'I'IIIIACKUMULERAT \ AC
3 5 6 7 8 ANTAL INVA-NARE; MILJ. ('\. \<\\ 0mm
\ T- Peron ,/"\~/ \
re : 'Tq ' T5 W1"1
\ ~0115m -\ \\ Y owsmwsvu \ 0 35 ND SOHU'VU . Z . s u \ O / s )/ Canto 3 / V J I / "MOSA IO { - Hung \ A \ SUJIDSVAU. \ ~ \ ~ I \d J I < / . ._ _) Ouusm-\ \K / mama .\- _ \ J . A x \ B I \\aou~ns O xow- m - J O was: \ \r \\ \ o«m \\ N ' \ w SAND'vag 5 "
\. \\own. un: -U". ) man 5w! xun S
. \ ' I .Mo vol-{mans I OII \ °" 6 msu j k) H V . h uncuau' m .. Q ) I /
nurouso ). I wantALA1 C ( O
LlS lVll ._J \ .V um) O UPPSALz \
1(- 0 1111 s : bummer. ) NPMWBLJ V SY/( R zsl 5v. __/ Own-u. u _ nnu mouuvcLA I!, . \ O " 1 \ unooronum !~O \O m. gsf\h p A ' ' ususxocno no _ at 5! H slow I "90 Q'D IILIA (.uslnslllc
/ itsxnswun ( _ 116m: \\ 'y x \ amount QIALR . NUHIKJEI UUOEV...LL S sounmvnc LIAOIPIK;
5 /( mommqu 5x vot ~:;ON° ' - mun:I
SHNWS u 0 P lililIL-O [9 V E O: u\ @kmusf vk r \ f\ \ \ L L . n l _ .unnm ( LU-L3 BO S La? JONKOPML 00 ; 0 Hanan nab
O / 35.1 ( Om'm m / F O r \ (0'; . 1 H unusc N I r . I» .S . L \ uuluru. r~
\ G O - FEDNS BLUL U "-KIGIONUU H SIJCKKC LJ My NRORHP
: b "30'. AIL-Lo. Deana, ugly,
SDulh uhl. Wl. uPldiCX-VISBL
(NOE-ii}, ungu. uuu'aL us
'ii-nncl. AliliSHPJ I H
N _
S
12 QUEBDRL l\ib VCROHUI masons, IOU..th uoa'onv. nu 30-1. nau-w. uni-m n n :3 1:10:11 > 25 DOC IWA:.A2E I. HIJEIER 5 036 ~ 2') 0011 11w . - 2 30: 1M 00 .4 l Sin-v1 S-EHLL 'Jrigi 20' \l i :H.Hpnn; M v, I' 2'. if.» 0% 73' x 1 7" '., u - )IiviJ
Figure 3;? T-regions in Sweden.
T-regions or transport regions are classified according
to number of inhabitants in their urban area. T1 is
Stockholm and its urban suburbs (see map). T2 is Gote-borg correspondingly. T3 is constituted by all other ur
ban areas with more than 25 000 inhabitants (based on
parishes as subareas). T4 is urban areas between 5 000
and 25 000 inhabitants. T5 is urban areas 200-5 000
in-habitants and non urban areas in southern Sweden, while
T6 is the corresponding areas in northern Sweden (see
map). T5/T6 are separated since one can assume that
northern Sweden with vast, very sparsely populated areas
has a different transportation pattern than southern
Sweden.
Perhaps one should stress that regions T3 to T6 are not areas as such but are stratas of internally homogenous areas. T1 and T2 on the other hand are areas of their own. From the figure you can see the proportions of Swe dish inhabitants in each T-region. Work trip modal
rela-tions are also mapped (from an investigation made in
connection with the census of 1975).
Now return to car disposing, this time including spatial relations (figure 3.3).
VTI REPORT 166A
Figure 3.3 Car disp051ng,
types of family.transport regions and
71,73
44,54,45,55
Retired (65 + years) Parents, married
42,52 Parents, solitary
marriedAdults 25 64 years,
33, 63 no children,
Adults 25-solitary
their parents, married
31, 61 64 years, no children,
23 Youth 15-24 years, not living with
their parents, solitary Legend
21 Youth 15-24 years, not living with
°/.iurVo| 7 8 6 L L 5 232221 (212219151212 151618171318 533322 22222L292928 21 21 22 23 26 28 LL,LS,SL.SS 60 50 L0- 30- 20-10 70-1 80-90-1 100 00 0. 00 u0 n0 n0 n0 n0 n0 n0 n0 m0 n0 n.».n0 >0 w v.. . .C. n . n . . . R. .. .0 . 00 u. u0 n. no u 0. 0 .0 .. . .0 .. .0 .. .0 0. 0. .. 0 .0 n . . 0 . . T1 T1 T2 TI. T5 T6 1 . . . 4 -. . . . . 4 . . . . . . . . . .. 00 00 00 00 .0 .. 0. 00 00 .. .0 .. 0. .0 00 .. 0. .0 .. 0 0 0 0 0 0 . 0 . . 0 0 . . . . . 0 . 0 0 . .0 .0 . .0 0 0 00 .0 .0 00 0 0. .0 .0 .0 .0 .0 . 0 0. .0 0 0 . 0 O 'O OQ .. I D DO . I I D D0 00 0. .. .n . . .. 0 0 0 0 0 0 0 0 4 0 0 0 6 0. 4 0 0 0 . 00 00 0000 .0 00 00 00 09 00 00 00 00 0 09 00 00 0 0 0 T1 T2T3 Tl. TS T6 3 . O O . .. u. n0 . p 0 o 1. U D . C O O O C O 0 .. 0 . .o .. .. .0 0..0 0. .. 00 .0 00 0£. 00 0. .. .0 0 00 .0 0. .. .0 .. . 0 0 0 0 . . . . . . 0 0 0 0 0 . 0 ¢. . . 0 0 . . o 00 . . 0. .. .. .. .. 0. .. 0. .0 00 0. 00 5 0 . 5 1 . 0 0 .0 00 .0 0. .. 00 0 0. 0 . . . . . . , 0 1 . . . 0 0 m . . 0 9 0 . . . .
0 0. .
1 1 c 4 G 1 l Q 1 1 l 1 1 Q . 1 O . .. ,. ,. . .. . . . 1 . . . .9 .. . .uu 31+61 .0 .0 .. . .0 . n. 3.. 0 .0 .0 .u. .. .. 0 0H 0N 0" .. . 0. .. .. . T1 T2 T3 TL T5 T6 .4 . . . . . ... c u. . . c. 0. 1 O. .. 0. .. .. .O tI OD OOI. .G O. .C O. 0. . '0 . .. .. .. . 0 00 .. .. .. 00 .. 0. .0 0. 0. 0. .. . 0. .. 0. .. . . 3. .. : .0 .0 .. .. .0 .. .. .0 .0 01 0. .... . .4 03 .. .. .0 00 0 00 00 . 0. .0 . .. .. .. -. 00 0. C O O O C . 0. 00 ... .. . Q Q 0 O O . A a Z Q Z Q Z Z Z E Z QZ W J W Z W . .. . .. .. .. . .0 .0 . . .. 0. .. 0. 0. 0. 0w0 .0 w0 w. w0 .0 V. 0. 0 00.3 0 3 0. 0. 0. 0. 00 0 0 . o . o . 3. 0. 00 37 .. . 33:63 . . . . -0. 02 0' OL 0 . . o . 0 o 0 . .u. .. .. 0.0 . . O O O . on . .0 . O . .0 ¢. 0. . . .. 0 o . C 0 O .0 0. .. 0 . 0 § 0. . l 0. 0. .. . 00 .. .. 0. . . a . . 00 11 T2 T3 TL T5 T6 . o . . O I 23 .3 .. . OO DO DO DO IQ I. t o . . . .. 0. .-0. .. .0 .. .0 . 0 0 . ! . . . 4. 0 0 . 0. .. 0. . 00 .0 .. .. 0. .. 0. . 00.. . 30 .0 .5 .0 .. . 00 .. .. .. . 0 .5 0. 30 0. .. 0. .. .. .0 .. .. .. .. .. .. . 0 0 . .. -0 0. 0. 0 . 0 . . . . . . . . DO who m.» no. ..n ouo non ouo mon ouo uon owo noo 0. . % % % Z % % Z Z %% % % % % % . .s ... ... .. 3.x. n.n. 33. ,u. .n. n.u.n.n. u.n. u.u . 0 . 0 0 . 0 . . . . O C O O C O Q O . I . I . O O O . . O . .. w. u0 u. 4. u. uo u. m. . .. a.. 40 ?? ?»o «3 &5 .w0 u. 1. u. .0 u. u. w. u 0 u . L2+52 0014 9, T1 T2 T3 TL T5 T6 1 o u . . o . .. .. 0. . o .. 0. .. .. .. .. 0 o 0. 0. .. . 0. .. . .0 00 .. . 0. . $0 .0 .. . . p . .0 .. 0. .. .. . 0 . . .0 00 .. .0 00 00 .0 .. 0 0 o 0 0 0 . 0 . 00 .. 00 0. .. 00 .0 .. 0 0 p 0 I 0 0 n0u. M0». M0». M0n 0n. 0000M0 n0n 0n0 u0n 000 0.n 0u0 n0u0 u0n 0n0 n0n0n0 0x .n.0 0 0 .. 0..... .O . . 0 . % % % % Z % % %% % % % % Z Z % % Z Z % % 0 . . 0 0 . 0 0h 0 0. 0 0 0n . . O O. 0 00 . Y T1 T2 T3 TL T5 T6 .. 00 .. 0. 00 .0 .. .. 00 ?. 00 00 0. 00 .. 00 .0 0. .. .00m .0 00 .. .. .0 .. .0 .. 0.. . . 0.0 0 . . 0 . . . . 0 . . . 0 . 0 . . 0 . 0 . . . . . . 0 . . 00 00 .. .. 0. .. .0 .. 00 .. . .0 .. .. .0 00 00 .. 0. .0 0. . .0 .. .0 00 0. 0. .. .. 00 .. 0 . . O . . . . . . . . 0 . . . . . . 0 . . . . . O ' . 0 . . O .
0 .0 . «0 0. 00 w. 0. .. .. r. .0 .. r 00 0 0 . 0 0 0 . 0 . 0 .o . 00 0.00 0. 00 0 00 0. .. .. . 0 0 0 . 0 . 0 0 0 1 . . . J
. 002 n. 71 73
AQ
g
a
0. 0. 0. 0. 0. 0. 0. 0. »0. 0. .. /. an .m.um m... mmwm mmmm mmmm mm . 0 . o . . 0 . .: o . 0 .0 0 . n 0 00 .. .0 .. . 00 .0 0. 00 4 0 0. .. .. . . . . 1 . A n n v . . . : . 1 . . . . . u n c . . . D D 0 0 b D D 0. 0. 0. 00 00 . 0 . . 0 . 0 .. 00 00 0. 0. . 0 o 0 . 0 0 . . .u.9.C . u» .O. . 0 0 00 0. 0 .0 00 00 0090 .o . 00 .0 .0 . .0 0. 0. 0. .. . .. .0 .0 00 00 0 . 0 . O 0 0 o ...0. . 0. .. .0 0. ~90 100 llStudents living in city centres are often very active regarding transport policy and traffic environment. They are keen on debating and make a cnnsiderable amount of
demonstrations and they are evidently a very potent
pressure: group with hight impact on jpoliticians. The
traffic environment of the capital of Stockholm seems of utmost importance and this has led to generally sparsely populated Sweden having the strictest emission rules of Europe. Students are mainly found in the solitary youth group (21) since they form families later than non aca
dendt: youths. Especially :hi Tl (Stockholm) their car
disposing is extremely low. Evidently they live in an
area with sufficient population per square km looking
from a public transport viewpoint. They can cope without a car but when looking at car disposing for other groups
and in other areas quite another picture is emerging.
From a group ego viewpoint transport political activity
by students is OK, but one cannot name them representa
tives for the people.
Generally' the picture from figure 3.1 gets nuances.
Solitary people have lower car disposing (figure 3.1),
very much lower in the two big cities (Tl,T2) than in
other areas of lower density. Relations between adjacent
columns are not always regular but that can be due to
the population of the investigation being split on age, areas, socioeconomy etc. To compensate we have tried to add as many groups of people as possible but still some irregularities remain. The total picture of less cars in city areas is relevant anyhow.
Married people own a car to a high degree, as could be expected, and regional differentiation is small. This is especially relevant for parents where even those living
in Stockholm and Goteborg (Tl,T2) are car owners
(approaching 90 %). Retired people by tradition seldom
have a car and differences between regions are small.
Low transport activity and plenty of time might make
public transport sufficient for this group even in lower density areas.
These backgrounds might lead us to pose some questions:
- Families with children often have cars. Do they use
them more often?
- Low car density in Stockholm reflects high population
and good public transport. Do people in Stockholm use their public transport in a different way than people in other parts of the country?
To supply' a f g i density area like Stockholnt with
good public transport is relatively easy. Stockholm
is also the transport policy capital of Sweden. Does
this plead to exessive belief in public transport
means of solving transport problems? Does this also explain why transport policy ambitions are often too high.
We are not trying to get exact answers to all these
questions - the travel survey cannot furnish us with
that much information. When turning to transport
activi-ty in the survey however, it might be useful keeping
some of these questions in mind.
Transport policy is generally called traffic policy in
Sweden. Traffic relates to vehicle movements in the
transportation system, while transport is the production of the system. Transport policy debate regarding public transport has often been directed more towards creating
traffic than towards filling actual transportation
demand.
14
3.2 Main trips
Trips in the travel survey are made mainly for the fol lowing purposes.
Trips to and from work or school Trips during work
Service trips (e.g. shopping, children care or health care)
Visits and recreational trips Figure 3.4 shows their relationship.
100
Not specified Not specified
90 recreational 8% recreational 7%
l
80
Visits, trips
Visits, trips
29 % 4 %
1. 7o
5
+ 60 SerVice trips. . 17 % 4+ 50 ' k Service tri sh 40. Trips during wor ll % p
i 9 o
30 Trips to and from Trips during work
7"
work or school
15 %
37 % 4, 20
Trips to and from
10 work or school
'
21 %
Number of trips Transportation output.(WWLkm)
Figure 3.4 Trips in Sweden 1978 for specified
purposes.
From the figure two important factors in trips pattern emerge. Firstly trips to and from work are great in num
bers but rx : equally significant. regarding
transport-ation output. Evidently those trips are so numerous that they have great impact on public transport dimensioning.
However' their transportation output. is less than ex
pected. The Swedish Transport Ministry, for instance,
estimated work trips to 50 % of passenger transportation output in 1975. At that time they included trips during
work, which forces us to compare the travel survey s 36
% with the Transport Ministry's EM) %, still ea sizeable
difference. Secondly trips for visits and recreation are greater in number and longer than expected (giving more pass kms). Official ministerial material from 1975 esti mates their share of total transportation output to 25
%. The Travel Survey estimate is 45 %.
Having only one investigation in the travel survey form it is perhaps premature to say how great time visit
re-creational share is, but earlier estimates might have
overestimated the importance of work trips and corre
spondingly they' might have underestimated the visit/
recreational share. From the point of transport policy
this is interesting since so called necessary trips
(e.g. trips to and from work, and for service purposes) are rather inelastic relative to the price for the trip.
However trips during leisure time (e.g. social visits
and for recreation) are rather price sensitive. The
price for petrol might therefore have more impact on
total travel volume than earlier expected and increasing tax on petrol might primarily have reducing effects on
trip purposes that are not individually regarded as
necessary.
VTI REPORT 166A
KOLL = Public transport
BIL
Walking, cycling, motor cycling
Car Ovr
GCM Not specified
Travel modes:
fritidsresor Visits and recreation
Besoks-Serviceresor
och
Tjansteresor Trips during workTrips to and from work
Shopping and misc. services Arbetsresor
Purposes:
purposes, modal distribution and T-regions.
Figure 3.5 Total number of trips related to trip
FRI T l DSRESOR
ARBETSRESOR SERVICERESOR
T1 T2 T3 T1. T5 T6
TJANSTERESOR BESUKS- OCH
T1 T2 T3 T1. T5 T6 T1 T2 T3 Tl. T5 T6 T1 T2 T3 T4 T5 T6 100
\\\
\\\
\\\
\\\
x<\
\\\
\\\
\\\
&
a
VA
T/
1
a
a
7
/
3
6
§a
§
a
7//
///
///
ma/
///
//A
s7
///
///
///
/%,
,//
///
///
/
\\\
\\\
\\\
\\\
\\\
\\\
\\\
\\wu\
\\\
\\\
\\\
\\\
\\\
\§
e
7/
//
/n
V/
/
s
\\\\
\\\\
\\\\
\\\\
\\\\
a\\\
\\\\
\\\\
\\\\
\\\\
%7//
///é%
///zv
100..
mg
?
§§u§§s
%
us
§§m
§
7
§u§uy
w
§§m
§§ws
o
1 0 0 2§a
§
w.
7//
///
///
///
97/
///
///
///
/
§m
§
u
7//
///
///
///
Am%
///
///
///
/
2\\\
\\\
\\\
\\\
\\\
\h
\\\
\\\
\\\
\\\
\\\
\\&
37/
///
///
///
M%W
///
///
/
§m
§§ém
zz
§m
§i
g
év
100§m
§
w.
7/
//
//
//
%%
//
//
//
//
a
3\\\
\\\
\\\
\\\
\m\
\\\
\\\
\\\
\\\
§e
7//
///
///
///
%wV
///
///
//
\\\
\\\
\\\
\\\
\§\
\\\
\\\
\\\
\\\
\
e
///
///
///
//.
///
///
///
///
/f
m
m
m
m
\
1
\
&
W a ///
/
tion.motivated since the figure contains a lot of
informa-tion modally and regionally. An extensive commentary is
in different regions. Figure 3.5 shows their distribu
Travel patterns are different for different purposes and _ l6 _
Trips to and from work
Here one finds a characteristic modal split. Tl
(Stockholm) has a significantly low share of car trips but also low share of walking/cycling. Other investi-gations have shown trips to and from work in city re-gions to be longer than those in less densely popula
ted areas. This explains partly the low walking/
cycling share in T1 and T2 but one can also suspect
other factors like dangerous traffic conditions and
difficulties in keeping a cycle in city areas
(van-dalism and theft). One might also propose that good
public transport with short distance between stops
leads to excessive consumption of transport, i.e.
people use public transport instead of walking and
cycling. Great cities does not always show good pat-terns of energy economy.
Trips during work
These trips are dominated by car transport, which
seems natural (high value on time, irregular travel
patterns etc). But total number of trips is sparse and
one should not stretch internal modal relations too
far.
Service trips for shopping etc
These trips have a different pattern than the above mentioned. A lot of them are made by foot or cycling.
Probably this reflect that most of them citen twing
short distance trips. Only in cities they are made by public transport to a significant degree.
Trips for visits and recreational purposes
These trips are modally similar to service trips. Only in Stockholm (Tl) these trips are made to any sizeable amount by public transport.
_ 18 _
A11 purposes
Figure 3.5 is essential. In all regions but great cities people do not use their public transport very much. The
great bulk of filling transport demands relies on car
travelling. When having a car, people evidently use it for nearly all kinds of transportation. Public transport is most widely used for travelling to and from work cm school.
If one cuts away the regional differences one can split up purposes more (due to statistical reliability). Table
3.1 sums up purpose relations for car drivers, car pas
sengers and public transport passengers (omitting walk-ing/cycling).
Table 3.1 Purpose relations among total of trips for
car drivers, car passengers and public transport passengers.(%).
Purpose Car Car Public transport
driver passenger passenger
Mkn <, to and front 38,3 25,6 45,4
School, to and from 1,2 3,3 15,6
During work 15,6 4,6 3,9
Shopping
11,4
11,9
10,8
Service 2,5 1,2 1,7 Health care 1,0 1,5 1,9 Child care 0,4 0,2 0,1 Visiting relatives,friends 8,9 20,4 7,4 Recreation 11,6 24,0 10,4 Other _ 9,1 7,3 2,8 T o t a 1 100,0 100,0 100,0Car drivers have a wide range of purposes, with a gravi-ty point towards trips to and from work. This point of
gravity is more stressed among public transport
pass-engers however. Also notice the great share of trips to and from school among public transport passengers. Child
care trips are few among car drivers (as well as among
car passengers and public transport passengers). This is somewhat astonishing since child (Emma is often used to
explain why peOple are going by car to work although
they theoretically have good public transport possibili-ties. Since only "main trips" are counted in the table, leaving or fetching children while going to or from work
is not a trip purpose per se. Other material in the
Travel Survey also indicates that 45% of child care
trips are made walking/cycling and a dominating share of them are shorter than 2 km.
Car passengers are concentrated around trips to and from
work, for shopping, paying visits and for recreational
purposes. Together these purposes constitute 82 % of
total number trips 'made* by' car passengers. Evidently
these four purposes are most suited for some kind of ride sharing.
Public transport is dominated by trips to and from work and to and from school (together 61 %). Shopping, visits
and recreation in city areas are having a relatively
small impact on public transport shares for these pur poses. Each of them constitutes near 10 %.
Mode specific 'purpose relations (like above) are one
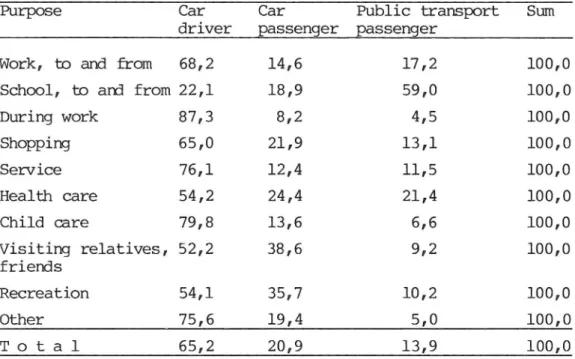
thing. Inter modal relations for each purpose is another aspect well worth contemplating. This is shown in table
3.2.
Table 3.2 Intermodal shares per purpose among total trips for car drivers, car passengers and public transport passengers.
Purpose Car Car Public transport Sum
driver passenger passenger
'Wbrk, to and from 68,2 14,6 17,2 100,0
School, to and from 22,1 18,9 59,0 100,0
During work 87,3 8,2 4,5 100,0 Shopping 65,0 21,9 13,1 100,0 Service 76,1 12,4 11,5 100,0 HEalth care 54,2 24,4 21,4 100,0 Child care 79,8 13,6 6,6 100,0 Visiting relatives, 52,2 38,6 9,2 100,0 friends Recreation 54,1 35,7 10,2 100,0 Other 75,6 19,4 5,0 100,0 T o t a 1 65,2 20,9 13,9 100,0
This table is significantly dominated by the car. Travel-ling as car driver constitutes between 50 and 85 % of all purposes except to and from school. Children going to and from school do this mainly by public transport (59 %) and school trips have also a significant share of all public transport trips (15,6 % in table 3.1). Another very inte
resting feature is shown by work trips. Nearly as many
trips to and from work are made by car passengers as by
public transport. It is probably quite unexpected that
ride sharing to and from work nearly equals public
transport. Also for other purposes car passengers make
more trips than by public transport. Totally, car pass
enger trips are one and a half as many as public trans port trips!
As mentioned school trips constitute a significant share
(If public transport. Zni rural (n: semi-urban regions (T5
and T6) people aged 15-24 years constitute more than a
Ihalf ( ? total. public transport trips. IU1 denser areas
this share is "only" 24 to 35 %, reflecting a more wide spread use by all age groups. This shows what impact on transportation the school reform of Sweden has had. Only
in lower forms are schools situated near home which
forces children i ) years old and more to "travel" to
school. Evidently this school policy has lead to a trans
portation dependency perhaps not envisaged at the time
when the cbcision was made. ZU1 many rural areas school
busing is vital to total volume of public transport
supply.
The mentioned rural dependency on school trips for public transports supply is an aspect on Swedish population geo
graphy. Sparsely populated areas are common and only one
"real" city region is present - Stockholm. The Stockholm
region consequently contrasts itself to the rest of the
country since more than 40 % of all public transport
trips are made in the Tl region.
As a whole one might summarize this part of the report in the following way:
Families with children are owning a car nearly always.
They are also seldom using public transport. People in
Stockholm are less prone to car owning than the rest of the population, but they use their good public transport more than other people. A dark shade in that bright pic ture is their low use of walking or cycling as a mean of transportation. Stockholm dominates the transport policy debate but people there are definitely not representative of the country as a whole. With less than 20 % of
nation-al population they constitute more than 40% of public
transport trips reflecting a very atypical transportation geography.
3.3 Long distance travelling
Trips more than 100 km are defined in the travel survey
as long distance trips. Compared to local trips these
trips are rather few and those interviewed was
conse-quently asked to try remembering not only trips made the
day before. For trips at least 100 km the period was ex
tended to 14 days, for trips more than 400 kms the
period was 6 months. One must be very cautious about
these long memory periods since they are often biased and distorted by failure to remember. For instance the questions on traffic accidents had to be withdrawn from publication due to characteristic time related losses of
memorated events.
Bearing these cautions in mind one have to treat long
distance travelling with a certain amount of sceptisism.
Some facts might be mentioned though. Trips with only
one visit or stop dominate and the trips are as a whole
clearly dominated by car travelling (91 % for one way
trips 88 % for return trips). The long distance trip
material is dominated by its shortest distance classes
(53 % of one way trips are thus 100-199 kms, 56 % of
return trips are 200-399 kms, that category's shortest
distance class). If a trip comprises more than one visit or stop it is often longer but these trips on the whole
are few.
Purposes for long distance trips are firstly recrea
tional (43 %), secondly shopping, service, health care,
child care and social visits to relatives and others
(together comprising 34 %). On third place, perhaps un expectedly low, come trips to, from and during work, 23 % of total number long distance trips.
Modal split is not inherent in long distance travelling, mainly due to the fact that the shortest group of trips with only one visit or stop are dominating. Modal
combi-nations are subsequently sparse and 96 % of all long
distance trips are single mode trips. For all purposes car travelling also dominates, not surprising since the large share of recreational trips makes the private car attractive also on rather long distances.
Distance relations for long distance trips are often in-teresting. We have chosen a custance pmofile technique to show how many percent of travelling is made by each
mode cumulating distances. The technique :hs applied in
figures 3.6 and 3.7. It explains how many accumulated
percent of total trips are made up to 200 kms, up to 400
kms etc. The first figure shows trip purposes that are
not supposed tx> be paid by the traveller personally
(trip to, from and during work). In the second it is
assumed that rmx : travellers pay for the trip them
selves. {62) IO 50 )0 60 so... no 30 '
/
m [f // {D I __.¢- -"-1'/' l A n0 Ian 21. 300 9'0. 57:. so. 700 elm 90. MD. "00 I200 I700 mo 190 I600 "00 I830 Km
Figure 3.6 Long distance trip to, from and during
work
Legend: Flyg = airplane
Tag = train
Buss = bus
Bil = car
i w
0 mo joo 500 in SD. (.00 0 " 1+" "100 '0 l0. 90 $09 '0' "0° "0° "0' $00 k
Figure 3.7 Long distance trips for shopping, service,
health care, child care, visiting
relatives and others, for recreation.
It follows from the figures that car is the HDSt short
distance oriented travel mode. However, bus and train
are rather close in distance profiles. Only airplane is
significantly':more innu; distance prone. Travelling by
own means or having the trip paid by others does not in
fluence distance profiles for car, tum; or train.
Air-plane, however, is evidently only used for really long
trips especially when people pay the ticket themselves.
3.4 Can public transport substitute private car transport?
Analysing competition between transport modes is not an
easy task. However, it is facilitated by a process of
segmentation, followed by separate studies of each
seg-ment. Paradoxically enough this often. points to less
competition than perhaps expected. Studying goods trans-port as well as personal travelling often leads to iden-tifying a sequence of submarkets for each mode where no real competition is present. Competition can then be lo
cated to Imnxa or less wide zones between these sub
markets. The competition areas move with time in one or the other direction, e g influenced by changing economic relations between modes, changing goods structure, vari-ations in the volume of demand which different modes are varyingly able to cope with, etc.
To make a realistic estimate of where and when public transport might substitute private car transport we have decided to approach the problem in accordance with these lines. First we try to map modal variations in segments
of travel times, distances and hour by hour. Then we try
to estimate and allocate those areas where the private
car is not having a total monopoly, or where it might
show deficiences being able to be exploited by public
transport. It follows from this reasoning that we
con-sider it unrealistic to recommend traditional forms Ci
public transport as a general substitute for car trans-port e g in geographic environments where presently pub-lic transport is virtually not used.
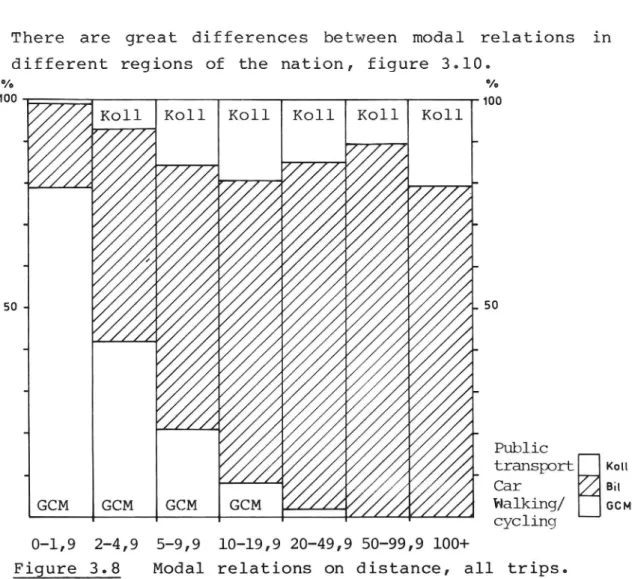
3.5 Travel time and distance
Public transport has its strength :hi medium distances,
see figure 3980
This is further accentuated counting only trips to and from work, where public transport is generally stronger, figure 3090
However, public transport is not dominating any single
distance class, c f walking and cycling on distances
less than 2 kms. The private car competes with walking/ cycling on short distance and with public transport on
trips more than 5 kms. Public transport evidently has
advantages for really long trips over 100 kms.
There are great differences between modal relations in
different regions of the nation, figure 3.10.
0/. °/o W0 mo K011 K011 K011 K011 K011
/
50-1\\
\\
Public transportlll Car Walking/ cycling 1n\
\\
\.
\\
\\
\
k
GCM GCM GCM O l,9 2-4,9 5-9,9 lO-l9,9 20 49,9 50-99,9 100+Figure 3.8 Modal relations on distance, all trips.
100 Koll. B l GCM M . I C G _ 27 _ 100 W M W M H Q _ m W -=
mm
m
K
7/////
//////
//////
///
Km
1
_
.
_
_
b
.
.
a
V/////
//////
//////
cm
a
/
/
W
,
.7/////
///////
///////
//
as
K
V
1
a
1
_///////
////////
////
m
1
/
/
9,
m
a
7////
/////
///Km
a
/
/
/
/
/
/
/
/
/
/
/
/
/
/
/
%
K
7///
////
/K
K
//
/
m
d
m
,
/
/
a,
o
7////////
///////,i
Km
K
7
/
K
m.
////////
////////
////////
i
cm...
1
/
m
.3
///////
///////
/////4
GT
a
/
//
9,
Km
7//////
///////
//4
Km
K
W
/
K
am
u
7/////
//////
/2
cm
1 7 ,/1 m r_ m m W % W % m a a/
/
V
G
a
M
a
//
//
/Z
M
%
u
%
K
9
//////
/é
cm
m
/
K
K
0
//////
z
Km
/ _ m 3 M 3Q
M
m
M
Z
c
m
% . . . m .W J _ _ L / 7 / / Z _ _ _ _ _ °/o 100 h 0 5 5 - 9,9 km 2 - 4,9 km 0,1 1,9 kmFigure 3.10 Modal relations on distance in T-regions,
trips to and from work.
°/o 100 28 -50 °/o 100 " 50 T1 T2 T4
Legend of standard classes: Distance to stop 1. 0 499 m 2. 0 499 m 3. 500 - 2000 m 4. 0 - 499 m 5. 500 - 2000 m 6. 0 499 m 7. 500 - 2000 m 5. not Figure 3.11 specified or known
VTI REPORT 166A
H -n w 5 T6 Trip frequency at at at at at least least least least least 2/h daily 2/h work days 2/h work days 4/day 4/day less than 4/day less than 4/day
On distance less than 2 kms only people in Stockholm
(Tl) use public transport for their work trips. In all
other regions public transport is virtually nil. This is probably due to the great standard and general access
ibility ( ? public transport. in Stockholm. Coupled to
short distances between bus stops this leads to what
might be called excessive consumpthmn of public trans port. However, the standard of public transport must be rather high to compete with walking or cycling on such short distant trips. How high is the standard of public
transport in Stockholm compared with other areas of
Sweden? Figure 3.11 gives a hint on frequences and
dis-tances from time homes of the interviewed persons to
nearest bus stop.
Classes 1 and 2 might be treated as relevant for work trips. Apparently no significant difference exists
bet-ween Stockholm (Tl), Goteborg (T2) and medium sized
towns (T3). However, a bus frequency of 2 per hour is
not a very frequent traffic and theoretic measures like this cannot distinguish between good and decent or
half-decent transport supply. IX crude measure ( ? frequency
does not always tell much about how well transport supp-ly covers actual transportation demands geographicalsupp-ly.
A clue might be found in dwelling structure, whereone
can expect much better transport supply in denser areas with multi storey or multifamily houses.
0/0 0/0 100 100 :-q . 50 " - 50 T1 T2 T3 T4 T5 T6
Figure 3.12 Dwelling structure in T-regions, percental
shares of people living in multi family houses.
Dwelling structure 1h] different T regions :Es mapped 111
figure 3.12. In denser regions like T1, T? auKi'T3 more
than 2/3 lives in multi family houses. We can now return to figure 3.11 and review our standard measurement dis
tributed on single family and multi family housing,
figure 3.13. Width of columns are proportional to the
share of people living in respective type of housing
according to figure 3.12.
96 1 III/[Ill]
.. /
jg
///{////4
/ '
..
3 / 0 b-
_
3
S
//////
90 L 3 L 7 ./32Z 6Z6? 2 I -L 6 7 780-
2
2
%
3
5
6
6
//
70- 3 3 h 7 60~ - 2 4 5 5 __3:
__
s
504
7
5
__ 6 _ 1 1 4 _. O 4 5 4 3 30* 5 _ n 1 1 1 2 -3L 2 20- 3 4 __ -2 410 ~
1
2
11
~
1 2 O 1 1 F E F E F E F E F E F E T1 T2 T3 T4 T5 T5 Legend:E = single family houses
F = multi family houses
For standard classification see figure 3.11
Figure 3.13 Standard of public transport on T regions
and dwelling structure.
Most of the differences in public transport supply can
evidently? be attributed to housing structure. In the
denser regions (T1, T2, T3) transport supply is much
better in multi family house areas. However the step to the standand of T4 is rather great even when counting
only multi family houses of that region. From T4 and up
wards there is seldom any special type of urban public transportation service. What is to be seen here is when
rural transport reaches (n: passes urban areas (c f'T4).
It follows from figures 3.11 and 3.13 that one
should not expect public transport supply concerning work trips to any significant degree outside regions T1,
T2 and T3. Going to what could be called school bus
standard or service/visit standard (classes 3 and 4) the
coverage is decent also in T4. In sparsely populated
areas like T5 and T6 however even that type of public transport standard is not frequent.
However, it follows from above and from earlier figures
that gnly in Stockholm is more use made of public trans
port supply than elsewhere in the country. This suggest
that. increasing public transport standard does not a
priori lead to fuller use of public transport. If people should really be stimulated to full use of their public transport the supply must evidently be nearly excellent. Can then public transport substitute car transport? Or put the question the other way round: Why don't people use public transport instead of their own car? The only way in this survey where one can compare one person's choice of transport modes is in a table where the inter viewed (if found to have gone to work by car yesterday)
was asked how long the car trip took and how long a
corresponding public transport trip would take. The
interviewers were asked to bring time tables etc to the interview to be able to help people make relevant esti-mates of corresponding public transport trips.
Table 3.3 shows car travellers trip time to work by car, table 3.4 shows their corresponding time if they would have gone by public transport instead.
Table 3.3 Travel time for car travellers to work,
percental shares. Minutes % 0- 9 18 10 19 40 20 29 20 30 39 10 40-59 6 60 89 2 90+ 1
Table 3.4 Travel time by public transport for car
travellers to work, percental shares.
Minutes % 0 9 0 10-19 2 20-29 5 30-39 7 40 59 8 60 89 6 90+ 7 "won't go" 58
Source tables 3.3 and 3.4: Travel Survey of Sweden, table 7021.
One should use the above figures with care since they probably are connected with some bias and random errors. Firstly tables do not cover those with really good
pub-lic transport since they seldom use car for going to
work. Secondly there is a large share of non answerers to this question suggesting large difficulties in esti
mating corresponding public transport travel times for
those normally using car for their trip to work. Thirdly there is a regional bias in having 59 % of the answers coming from region T6, namely norhtern rural areas. This
being said however, there are some interesting facts
which can be extracted from the tables.
For instance people going by car will evidently increase
their travel time substantially switching to public
transport. A careful interpretation is picking out medi an time, which leads us to the 10-19 minute class for car travelling but forces us into the "won't go" class for corresponding public transport.
That in turn leads us to believe that for most car com-muters public transport is IKH: a feasible alternative.
Put it another way: One might believe these people to
change work place (or perhaps give up work) rather than
use public transport. Since in Sweden legal deduction
from income for trips to and from work is permitted to
be based on car mileage if a person spares at least 90
minutes for the return trip (both ways) one might
con-clude that a majority of car commuters does have this legal right. It is often discussed however to increase the required time gain tx><e g two hours or to stop the
deduction possibility completely, which would increase
actual travel costs for car commuters.
From the above mentioned figures one might conclude that
the effect of such a decision would perhaps not be to
stimulate peOple going by public transport instead of by car. More probable a possibility seems to be a change in work place, ride sharing or work cessation.
3.6 Travelling hour by hour
Transport capacity is often directed by peak loads
during the day. Trips to and from work and school is
concentrated to two peaks at 7-9 am and at 3-5 pm. For people working with public transport capacity planning
this is a well known problem. Public transport has its
main purpose furnishing work and school trips and this
500
-in between hours. The two peaks
that it is
causes slack capacity
are so distant apart, however, not often
possible for one bus driver to cover both peaks thereby the
morning and afternoon shifts for
turn leads to slack hours not only in between hours but
forcing public transport company to have early
its drivers. This in
before and after peaks too. Total travelling does not
have these peaks, see figure 3.14.
It
04 5
total number of trips
- trips to and from work or school
Figure 3.14 Travelling hour by hour.
Total trip number has a soft peak at noon. That is
em-plained by activities around the lunch break such as
short walks to home or to restaurants, canteens etc and
also errands like shopping, other service, visits of all cycling kinds etc. These trips are often made by foot,
or by car.
VTI REPORT 166A
In the figure is also mapped work trips and school trips where the two humped character are evident. Total travel peaks off rather slowly "The later the trip the greater the car share" is one of the general results from other travel surveys made in Sweden. Most of this late travel-ling is going to and from leisure activities, cultural activities, and evening classes. Another often not men
tioned trip purpose is parents driving children to or
from sport activities, friends etc. Let us conclude this part:
Work trips and school trips have a two-humped hour-by hour profile.
- Public transport is generally oriented towards fill
ing trip needs for work and school, and consequently it shares this profile.
At peak hours buses are full and increasing
trans-portation output at those hours requires (expensive) additional traffic.
- Additional passengers at non peak hours are cheaply
accomodated but hard 13) geta Traditional forms of
public transport is evidently not attractive for pur-poses relevant at those hours.
- Total transportation output has a soft peak at noon
which slopes gently downwards in the evening.
4 AN ALTERNATIVE WAY OF STUDYING TRAVEL BEHAVIOUR
4.1 Demand and supply
When people debate human needs of mobility, they often
recommend public transport as some kind of universal solution for problems like the energy crisis, the de-toriating quality of the traffic environment, etc. That is easier said than done. Public transport is
astonish-ingly' declining, generally' speaking, in term of its
share of total transportation output. Why is it so? Are
people overlooking the problems around solving energy
problems and environmental problems with public trans
port? The Travel Survey of Sweden so far described has
shown some of the problems, e g with low use of public transport outside city areas. We are now trying to seek
new answers by analysing demand and supply of
trans-portation. After that we shall try to estimate if
better public transport can meet typical demands from
the public.
Total demand for transport is generated by present
spa-tial. organization coupled to those functions in the
society that need to be reached (e g schools, health
care, shops) or done (e g work).
Creating demand
Eogsing/ 0£k_s_e_psratioa
Traditionally density in the dwelling structure has in-creased. However, in the latest decades one can discern
a return towards lower density in housing. An inter
national trend of migrating from. multi store houses
towards lower houses is evidently present (see ch 2). This leads to more and longer transportation needed for trips to and from work and the low density
dwelling areas cause additional problems since such areas are difficult to cover with dense public trans port. Additionally, these spatial problems are severed by concentrating work places into large industrial com plexes, externally located areas for industries, etc.
Ecenemies 9f_ssa_l_e_i_r1 shepgiag_a d_dis£rib9_tioa
In the old days local shops covered most of the demands
of the population. Nowadays more and more shopping is
done in super-markets. These are often easily reached
by car. They often in one location supply the customer
with a wide range of service opportunities, but they
also create car trips. Perhaps trips to the shop are
made less often now, but they are now made by car, not
foot.
lnErEa§i£9_W2 - Ei g_rit§ _: exfegnelyhildfers
In the old days of the core family the wife was home with the children and the husband alone was working for
cash. Increasing female work rate increases the number
of trip to and from work, but it must be pointed out
that women making trips to and from work are more often
using public transport than men. Male/female rate in
public transport in general is 40/60. Increased female
work rate also causes child care trips if child care
demand is not filled at home or very close to home. lnErEaéeé 2m292t_0£.lei32rs Ei e
Fewer work days and shorter working hours are increas
ing recreational travelling. This is a current trend
that can be stretched into the future. Most
recrea-tional trip purposes cannot be met sufficiently without a car. Disposing a car is perhaps going to be even more
essential for a family if for instance more families
aquire recreation huts, etc. Trying to reach a recrea-tion house by public transport probably means no trip at all.
ingreaseé etenslariof lili
Standard of living expansion rate has levelled off in
the l970:s. More glum a future is envisaged for the
l980:s. Car owning rate is generally proportional to
total car mileage. In other words: Car use has expanded
during the l970:s but expansion rate is modest now
adays. There is still room for a small amount of in
creased car ownership but mileage might be retarded by switching towards more tax on use (e g petrol tax) than on ownership (normal forms of road tax etc).
Scale scenemiee _i_H_e§_usa:c_ien_ap_d_0£hsr_pgblis service
School hierarchies have caused a lot of travelling
during the last decade. The system of letting children choose among different alternative courses and general
directions and still keeping these courses inter
changeable inside the same school has made school units
large, and in turn this has forced children from ten
years age and older to "travel" to school.
The school system is an excellent example of public
sector scale economies where you want better standard
(on education) e g by increasing selection possibili
ties but where you unfortunately in the bargain get
bigger units c f a non local character. Other examples
can be chosen. For instance health care in Sweden is
now more centralized towards larger hospitals, giving
possibilities of specialized treatment but forcing
patients to transport themselves to the hospital to get
the desired care. Another example is the communal
reform which in two steps during the last two decades
has diminished the number of communes from 2 400 to
275. Earlier, different forms of contact and service
were reached locally, now people must go by car or bus
to get those services.
Eoial Sema2d§.£0£ Ersvsl
The enumerated trends and changes in society give a
hint on how much travel people need in a modern society compared to earlier, more locally oriented (and static)
society. Add to that all social needs, i e recreation
and visits which are always present. One can then form a stepwise procedure to describe how demand and supply
interact, also restricted and combined with people's
wishes to minimize costs and efforts for their trips. Figure 4.1 is an example encompassing also the sampling and blow up procedure.
WISHES AND NEEDS FOR
TRANSPORTATION
TRANSPORTATION SUPPLY RESOURCE RESTRICTIONS MINIMIZING EFFORTS RESULTANT TRIPSSAMPLING BLOW UP OF SAMPLE TRAVEL SURVEY TRIPS
Figure 4.1 Image of relations between transportation
demand, supply, trip pattern and sampling