List of Papers
This thesis is based on the following papers, which are referred to in the text by their Roman numerals.
I. Aare S., Ochala J., Norman HS., Radell P., Eriksson LI., Göransson H., Chen YW., Hoffman EP., Larsson L. (2011) Mechanisms underlying the sparing of masticatory versus limb muscle function in an experimental criti-cal illness model. Physiol Genomics, 43(24):1334-50.
II. Aare S., Radell P., Eriksson LI., Chen YW., Hoffman EP., Larsson L. (2012) Role of sepsis in the development of limb muscle weakness in a por-cine intensive care unit model. Physiol Genomics, 44: 865-877.
III. Aare S., Radell P., Eriksson LI., Chen YW., Hoffman EP., Larsson L. (2012) Effects of corticosteroids in the development of limb muscle weak-ness in a porcine intensive care unit model. Submitted.
IV. Ochala J., Renaud G*., Llano Diez M*., Banduseela VC., Aare S., Ahl-beck K., Radell PJ., Eriksson LI., Larsson L. (2011) Diaphragm muscle weakness in an experimental porcine intensive care unit model. PLoS One 6(6):e20558.
Out of the thesis
1. Liu JX, Höglund AS, Karlsson P, Lindblad J, Qaisar R, Aare S, Bengtsson E, Larsson L. Myonuclear domain size and myosin iso-form expression in muscle fibres from mammals representing a 100,000-fold difference in body size. Exp Physiol. 2009 Jan; 94(1):117-29.
2. Ochala J, Gustafson AM, Diez ML, Renaud G, Li M, Aare S, Qaisar R, Banduseela VC, Hedström Y, Tang X, Dworkin B, Ford GC, Nair KS, Perera S, Gautel M, Larsson L. Preferential skeletal muscle myosin loss in response to mechanical silencing in a novel rat intensive care unit model: underlying mechanisms. J Physiol. 2011 Apr 15; 589(Pt 8):2007-26.
3. Banduseela VC., Chen YW., Göransson H., Norman HS., Aare S., Radell P., Eriksson LI., Hoffman EP., Larsson L . Impaired au-tophagy, chaperone expression and protein synthesis in response to critical illness in porcine skeletal muscle. 2012. Manuscript.
Contents
Introduction ... 11 Skeletal muscle ... 11 Myosin ... 12 Actin ... 13 Muscle contraction ... 14Regulation of muscle mass ... 14
Protein synthesis ... 14
Protein degradation ... 15
Gene profiling ... 21
Acute Quadriplegic Myopathy ... 25
Diagnosis ... 26
Interventions and risk factors ... 27
Muscle disparities ... 29
Aims of the present investigation... 31
Materials and Methods ... 32
Results and Discussion ... 39
Conclusions ... 53
Acknowledgments... 55
Abbreviations
Activin-type II receptor B (ACVR2B) Acute quadriplegic myopathy (AQM) AMP-activated protein kinase (AMPK) Autophagy lysosomal pathway (ALP) Autophagy-related protein 7 (Atg7) Bone morphogenic proteins (BMPs) Chaperone mediated autophagy (CMA) Corticosteroids (CS)
Compound muscle action potential (CMAP) Creatine kinase (CK)
Critical illness myopathy (CIM) Cross sectional area (CSA) Direct muscle stimulation (DMS) Eukaryotic initiation factor 2b (EIF2B)
Eukaryotic initiation factor 4E binding protein (4EBP1) Forkhead box O (FoxO)
Glycogen synthase kinase 3 beta (GSK3β) Heat shock proteins (HSPs)
Heat shock transcription factor (HSF-1) Insulin-like growth factor 1 (IGF-1) Intensive care unit (ICU)
Insulin receptor substrate (IRS) Interleukin-6 (IL-6)
Intravenously (i.v.)
Mammalian target of rapamycin (mTOR) Mitogen activated protein kinase (MAPK) Matrix metalloproteinase-2 (MMP-2) Mechanical ventilation (MV)
Monocyte chemoattractant protein 1 (MCP-1) Muscle-specific RING finger protein 1 (MuRF1) Myocyte enhancer factor 2 (MEF2)
Myosin binding protein (MyBP) Myosin heavy chain (MyHC) Myosin light chain (MyLC)
Neuromuscular blocking agents (NMBA)
Peroxisome proliferator-activated receptor gamma, coactivator 1 beta (PGC1β)
Phosphatidylinositol 3-kinase (PI3K) Post-translational modifications (PTMs) Reactive oxygen species (ROS)
Sensory nerve action potential (SNAP)
Signal transducer and activator of transcription 3 (STAT3) Specific tension (ST)
Tissue inhibitor of metallo proteinases (TIMP 2) Transforming growth factor-beta (TGF-β) Ubiquitin (Ub)
Ubiquitin carboxyl-terminal hydrolase isozyme L3 (Uchl3) Ubiquitin proteasome system (UPS)
Introduction
Skeletal muscle
Skeletal muscle is the most abundant and dynamic structure in the human body. Muscle fibers are the individual units of the skeletal muscle. The size and number of these fibers vary according to muscle type. Muscle fibers are packed in to small bundles of fibers, i.e., fascicles. The muscle fiber is made up of thousands of myofibrils arranged in parallel. The final functional unit in the myofibril is the sarcomere, containing the myosin and actin filaments (figure 1).
Figure 1. The structure of sarcomere. Each sarcomere is bounded by two Z lines. Within the sarcomere are the thick myosin filaments and thin actin filaments.
A-Band Sarcomere Z-line Myosin filament Actin filament A-Band A-Band Sarcomere Sarcomere Z-line Myosin filament Actin filament
Myosin
Myosin is the molecular motor generating skeletal muscle contraction. The myosin molecule contains six proteins which forms a hexameric complex. The key nomenclature used to illustrate each of these six proteins is based on their molecular weights. The native myosin molecule constitutes of two myosin heavy chains (MyHCs) and each MyHC is coupled with one essen-tial myosin light chain (MLC1 or MLC3) and one regulatory myosin light chain (MLC2). Each myosin heavy chain is made up of: 1) a long rod region; 2) sub fragment-2; S2); and 3) a globular head (also known as subfragment-1; S1) (figure 2).
Figure 2. Structure of the myosin heavy chain. This diagram is obtained and ad-justed from Biophysical journal Volume 90, Issue 8, 2006, Pages 2852–2866.
<
<
< S1 (Head) Myosin Rod S2 Hinge Hinge <<< <
< < S1 (Head) Myosin Rod S2 Hinge HingeThe MyHC rod region is important from a structural perspective because it determines the packing of MyHCs within the thick filament. In contrast, the globular head is directly implicated in binding to actin and generating force. The globular head consists of three domains known as: catalytic domain, converter domain and lever arm. The catalytic domain contains sites occu-pied with binding actin, binding ATP and hydrolyzing ATP. The converter region is presently thought to be involved in the transduction of energy, whe-reas the lever arm transports the load. Mutations in the globular head are supposed to play a key role in serious cardiomyopathies such as familial hypertrophic cardiomyopathy. Each MyHC has one essential and one regula-tory light chain bound to the S1 fragment (17, 107, 123)
The diversity of the native myosin molecule is complicated by the pres-ence of different isoforms, in both the MyHC and MLCs. From a mechanical viewpoint, muscles could be categorized as slow and fast. In the past 20 years, it has been revealed (at various levels) that the speed related properties of skeletal muscle are due primarily to the existence of different MyHC iso-forms, and that the kinetics of cross bridge cycling can be modulated by MLC isoforms (67, 70). The different fiber types are used to classify and linked to the MyHC isoform composition of the fiber. The ultimate design constriction of skeletal muscle is the force-velocity relationship and the shape of this association is dependent on the kinetics of cross bridge cycling In small adult mammals, the primary MyHC isoforms found in most muscles is the slow type I, fast type IIa, IIx, and IIb MHC isoforms (in order of their ATPase activity). In humans, it is presently thought that only the first three MyHC isoforms are expressed. Additional adult MyHC isoforms have been found in muscles from the larynx (Type IIL), mastication (superfast type IIM), and that are involved in the movement of the eyes (EO). Furthermore two developmental MyHC isoforms have been found in mammalian skeletal muscle, these are referred to as the embryonic (E) and neonatal (NEO) MyHC isoforms. Finally, the hearts of both small mammals and humans are known to express two cardiac isoforms, the β- (type I) and α-cardiac MyHC isoforms.
Actin
In skeletal muscle, actin is a 42 kDa protein. The sarcomere is composed of filamentous actin polymers (F-actin) that regularly interact with the myosin heads to produce contractile force (55). Actin is extremely preserved with only 23 out of 375 residues differing between skeletal muscle and a non-muscle source. In sarcomeric non-muscle both α-skeletal and α-cardiac actin are expressed (122). Additionally, actin has been reported to have a two-fold longer turnover rate compared to the myosin (72, 85).
Muscle contraction
Myosin and actin are the two key molecules involved in the muscle contrac-tion. During contraction, actin filaments (thin filaments) and myosin fila-ments (thick filafila-ments) slide past one other, known as the sliding filament theory.
According to the cross bridge theory, cross bridges extend from the myo-sin filament interact cyclically in a rowing motion with the actin filament, as ATP is hydrolyzed. The actomyosin interaction is initiated by a weak elec-trostatic bond between positively charged myosin and negatively charged actin molecules. Consequently, actin driven ATP hydrolysis leads to a strong binding state parallel to a lever arm movement of the myosin head (112). This is followed by the release of ADP; and substituted by ATP, the S1 seg-ment dissociates from actin. The myosin filaseg-ment remains stationary throughout the contraction with each cross bridge acting as a force generator. The number of cross-bridges and the force generated per cross bridge deter-mines the force generated by the muscle fiber (86, 92).
Regulation of muscle mass
Protein degradation and synthesis are the two components regulating skeletal muscle size. Muscle hypertrophy is the result of synthesis exceeding degradation and atrophy the opposite.
Protein synthesis
Skeletal muscle protein synthesis occurs via various signaling pathways such as myostatin, the negative regulator of the skeletal muscle size, has been implicated in different hypertrophy models. Myostatin inhibits activation of the Akt/mammalian target of rapamycin (mTOR)/p70S6 protein synthesis pathway, which mediates both differentiation in myoblasts and hypertrophy in myotubes (142). Insulin-like growth factor 1(IGF-1) is a protein growth factor that has been demonstrated to be sufficient to induce skeletal muscle hypertrophy by stimulating the phosphatidylinositol-3 kinase (PI3K)/Akt pathway, resulting in the downstream activation of targets which are re-quired for protein synthesis (12, 114). Glycogen synthase kinase 3 beta (GSK3β) is another substrate of Akt that has been shown to modulate hyper-trophy. Expression of a dominant negative, kinase inactive form of GSK3β induces hypertrophy in skeletal myotubes (114), as pharmacologic inhibition of GSK3β (147) (figure 3).
Figure 3. The function of IGF-1 and Myostatin in skeletal muscle protein homeosta-sis. This diagram is obtained and adjusted from Kidney International (2008) 74, 180–186.
Protein degradation
The degradation of proteins in the cell is critical for intracellular signaling and cell division. However, abnormal protein degradation results in muscle wasting. The major protein degradation mechanisms observed in skeletal muscle are the ubiquitin proteasome system (UPS), autophagy lysosomal pathway (ALP) and calpain mediated protein degradation pathways.
Proteins are continuously synthesized and degraded in skeletal muscle. Cells which are subject to stress such as starvation, heat-shock, chemical insult or mutation respond by increasing the rates of proteolysis. For
exam-Activin receptor II-B Myostatin IGF-1 IGF-1R Pax3 MyoD Nucleus Myogenesis P-Akt PI3K FoxOs MuRF-1 Atrogin-1 Protein degradation GSK3ß mTOR Protein synthesis Activin receptor II-B Myostatin IGF-1 IGF-1R Pax3 MyoD Nucleus Myogenesis P-Akt PI3K FoxOs MuRF-1 Atrogin-1 Protein degradation GSK3ß mTOR Protein synthesis
ple, oxidative stress has been shown to damage a variety of proteins and target them for rapid degradation. Post translational protein modifications also play an important role for protein degradation
Ubiquitn proteasome system
The ubiquitin proteasome pathway, preserved from yeast to mammals, is essential for the targeted degradation of most short-lived proteins in the eu-karyotic cell. Targets include cell cycle regulatory proteins, whose timely degradation is vital for controlled cell division, as well as proteins unable to fold properly within the endoplasmic reticulum. Ubiquitin (Ub) is a small protein that is composed of 76 amino acids. This protein is found only in eukaryotic organisms. Among eukaryotes, ubiquitin is highly conserved. For example, there are only three differences in the sequence of Ub from yeast compared with human Ub. The UPS system contains three different types of enzymes; E1 enzymes known as Ub-activating enzymes, E2 enzymes known as Ub-conjugating enzymes and E3 enzymes known as Ub-ligases which guide the protein for degradation. Ub itself does not degrade proteins; it serves only as a tag that marks proteins for degradation. The degradation is carried out by the 26S proteasome (figure 4).
In skeletal muscle atrophy, the two muscle specific E3 ubiquitin protein ligases Atrogin-1 and MuRF1 are markedly up regulated (11). MuRF1 and Atrogin-1 mediate atrophy by ubiquitinating particular protein substrates, causing them to undergo degradation by the proteasome. MuRF1's substrates include several components of the sarcomeric thick filament, including MyHCs (21). FOXO (fork head) family of transcription factors induces Atrog1 and FOXO3 activation was demonstrated to be sufficient to in-duce atrophy (120). Additionally it has been shown that NFkB activation induces atrophy in part through transcriptional up regulation of MuRF1 (16) and furthermore that P38 is another trigger for the up regulation of Atrogin-1 (82). Protein quality control needs the UPS to degrade misfolded or damaged proteins.
Figure 4. The ubiquitin/proteasome pathway. Multiple ubiquitination cycles result-ing in a polyubiquitin chain are required for targetresult-ing a protein to the proteasome for degradation. The multisubunit 26S proteasome recognizes, unfolds and degrades polyubiquitinated substrates into small peptides. This diagram is obtained and ad-justed from Cell Signaling Technology.
Autophagy lysosomal pathway
In eukaryotes, the lysosomal pathway degrades and recycles various cellular components by means of a process known as autophagy. Autophagy is a highly regulated homeostatic degradative process in which cells destroy and recycle their own components via the lysosomal machinery. In mammalian cells, autophagy is believed to occur at basal rates. There are three main forms of autophagy; microautophagy, macroautophagy and chaperon me-diated autophagy (CMA) (60). In micro and chaperon meme-diated autophagy there is direct involvement of the lysosomes, which either engulfs small por-tions of the cytosol or receives chaperon mediated cargoes. Macroautophagy is a highly conserved homeostatic program for the degradation of cytoplas-mic components including damaged organelles, toxic protein aggregates and intracellular pathogens (97) (figure 5).
Excessive activation of autophagy can lead to muscle wasting, however on the other hand, inhibition of lysosomal dependent degradation leads to myopathies like Pompe or Danon disease (79). Furthermore, the muscle spe-cific Atg7 knock out induced autophagy inhibition results in muscle atrophy,
E1 E3 Protein substrate Protein substrate Protein substrate Protein substrate E2 E3 19S 19S 20S 26S Proteasome Ub E1 Ub Ub Ub Multiple Cycles E2 Ub E2 DUB Ub Ub Ub ATP AMP ATP ADP Ub Peptides E1 E1 E3 E3 Protein substrate Protein substrate Protein substrate Protein substrate E2 E2 E3 E3 19S 19S 20S 26S Proteasome 19S 19S 20S 26S Proteasome Ub Ub Ub Ub E1 Ub E1 UbUb Ub Ub Ub Ub Ub Multiple Cycles E2 E2 Ub E2 UbUb E2 E2 DUB DUB Ub Ub UbUb Ub Ub ATP AMP ATP ADP Ub Ub Peptides
loss in force production and morphological features of myopathy (87). Ske-letal muscles of collagen VI knockout mice have impaired autophagy and myofiber degeneration. Activation of autophagy by means of genetic, dietary and pharmacological approaches restored myofiber survival in the collagen VI knockout mice (47). Cathepsins are the main players in the ALP systems, they have been shown to be implicated in muscle wasting conditions includ-ing muscular dystrophies, sepsis, disuse atrophy, fastinclud-ing and glucocorticoid induced atrophy (10). The most potent autophagy inhibitor in skeletal mus-cles is the kinase Akt. Excessive autophagy is detrimental to muscle mass and impaired autophagy can lead to many different debilitating myopathies. However an optimum ALP is essential for tissue homeostasis.
Lysosome Microautophagy Cytosolic proteases Lamp-2 Macroautophagy Hsc70 CMA Autophagosome Membrane fusion Lysosome Microautophagy Cytosolic proteases Lamp-2 Macroautophagy Hsc70 CMA Autophagosome Membrane fusion
Figure 5. Different pathways of protein degradation in lysosomes. In microautopha-gy, portions of the cytosol are constantly internalized via lysosomal invaginations. In macroautophagy, the cytoplasm is sequestered into double-membrane structures, known as autophagosomes, which fuse with lysosomes. In CMA, specific cytosolic proteins are transported into lysosomes via a molecular chaperone/receptor complex composed of hsc70 and lamp-2. Cytoplasmic antigens may first be processed by cytosolic proteases before transport to lysosomes. This diagram is obtained and adjusted from PNAS 2005 vol. 102 no. 22 7779-7780.
Calpain mediated protein degradation
The intracellular calcium-dependent proteases (calpains) and their endogen-ous protein inhibitor (calpastatin) are present in many different mammalian cells. Muscle tissue mainly expresses three different types of calpains: the ubiquitous calpains 1, 2 (mu and m) and muscle specific calpain 3 (p94). The calpain system performs a broad spectrum of physiological functions, in-cluding proteolysis of proteins involved in the cell cycle, apoptosis, cytoske-leton organization and signal transduction (41) (figure 6).
Most of the limb-girdle muscular dystrophies are myopathies which are caused by gene mutations which affect structural proteins. However, LGMD2A is caused by mutations affecting the capn3 gene coding for the skeletal muscle specific calpain 3 (113). Oxidation increases the susceptibili-ty of skeletal muscle myofibrillar proteins to degradation by the calcium-activated proteases calpain 1 and calpain 2 (135). Several studies have rec-ognized that calpains are elevated in atrophic conditions like disuse, dener-vation, glucocorticoid treatment and sepsis (48). There are reports suggesting that calpain 3 exerts a protective effect against atrophy by directing the NFκB pathway towards an anti apoptotic response as well as having a num-ber of links with proteasome activity. Deficiency in calpain 3 leads to a mus-cular dystrophy phenotype, demonstrating that its activity is necessary for skeletal muscle homeostasis. (9).
Figure 6. Summary of calpain activation in skeletal muscle wasting conditions. Calpains are activated by calcium, although other mechanisms are also contributing to calpain activation. The most significant muscle wasting-related consequence of calpain activation is cleavage of the myofibrillar cytoskeletal proteins, resulting in the disruption of the sarcomere and release of myofilaments that are subsequently ubiquitinated and degraded by the 26S proteasome. This diagram is obtained and adjusted from AJP - Endo 2008 vol. 295 no. 4 E762-E77.
Ca2+ Ca2+ Calpain Activation Degradation of transcription factors Ubiquitination 26S Proteasome Activity 26S Proteasome Activity Protein Degradation Protein Synthesis mTOR GSK-3ß Akt FoxO1,3 Myofibrils Myofilaments Ca2+ Ca2+ Calpain Activation Degradation of transcription factors Ubiquitination 26S Proteasome Activity 26S Proteasome Activity Protein Degradation Protein Synthesis mTOR Protein Synthesis mTOR GSK-3ß Akt FoxO1,3 Myofibrils Myofilaments
Gene profiling
Gene profiling is an outstanding tool to identify genetic mechanisms, net-works, molecular pathways involved in the skeletal muscle development and disease. The following gene groups are involved in skeletal muscle regula-tion in the porcine ICU model, i.e., in response to different triggering factors as well as muscle type specific differences.
Transcription factors
Different transcription factors will activate in skeletal muscle in response to mechanical ventilation, sedation, immobilization, neuro muscular blockers, corticosteroids and sepsis in combination or separately. These include runt- related transcription factor (RUNX1) associated with preventing atrophy and myofibrillar disorganization (145); ID1 and ID2 (inhibitor of differentiation), members of the helix-loop-helix (HLH) protein family, dimerise with basic HLH transcription factors. These proteins inhibit E-box mediated gene ex-pression by forming nonfunctional complexes with myogenic bHLH factors such as myoD and myogenin during differentiation (65);
Early growth response 1 (EGR1), a transcriptional regulator that activates transcription of target genes whose products are involved in regulation of cell growth and differentiation (36); activator protein 1 (Ap-1), the inducible transcriptional complex composed of proto-oncogene c-Fos (FOS) and pro-to-oncogene c-Jun (JUN) and these oncogenes have been implicated as regu-lators of cell proliferation, differentiation and transformation; insulin-like growth factor 1 receptor (IGF1R) plays an important role in normal and re-generating muscle tissue establishment and maintenance of mature muscle phenotype (35); T-box- containing transcription factor (Tbx1) is required for transcriptional activation of the myogenic determination of genes in the mandibular arch (59). Tbx1 acts by activating core myogenic program of pharyngeal muscles and synergistically with Myf5 upstream of myoD in the pharyngeal arch (118).
Myostatin is the negative regulator of the skeletal muscle growth and it is a member of the transforming growth factor-beta (TGF-β) super family. Blocking of the myostatin signal transduction pathway by specific inhibitors and genetic manipulations lead to muscle hypertrophy and hyperplasia (94); activin-type II receptor B (ACVR2B) and follistatin are the two important myostatin-related genes involved in the regulation and signaling of myosta-tin. Myostatin inhibits protein synthesis and satellite cell function in skeletal muscle and myostatin negatively regulates the activation of satellite cells and myostatin knockout mice have increased satellite cell activation (91).
The transcriptional factors which are involved in the myogenesis includes jun B proto-oncogene (JUNB) promotes muscle growth independent of the AKT pathway (111); signal transducer and activator of transcription 3 (STAT3) involved in myogenic differentiation (144); basic helix-loop-helix
family member e40 (BHLHB2), inhibiting the expression of different muscle regulatory factors (75); myocyte enhancer factor 2A (MEF2A) is a transcrip-tion factor that is a critical regulator of structural and contractile proteins and plays a role in skeletal muscle myogenesis. In hibernating ground squirrels MEF2A gene and protein levels are positively regulated and help in the muscle remodeling (140); and V-maf musculoaponeurotic fibrosarcoma oncogene homolog G (MAFG) gene acts as a transcriptional repressor when they dimerize. If they dimerize with other basic- zipper proteins then they serve as transcriptional activators. MAFG acts as a binding partner for the nuclear factor erythroid 2-related factor 2 (NRF2), in hibernating ground squirrels both MAFG and NRF2 transcripts were up-regulated in heart mus-cle in order to prevent the oxidative stress (100).
Some transcription factors are involved in muscle regulation which in-clude Kruppel-like factor 11 (KLF11) also known as transforming growth factor-beta-inducible early growth response protein2 (TIEG2) and is a family of primary response genes induced by TGF-beta, which are well recognized in regulating cellular proliferation and apoptosis (58); transducin like en-hancer split 1 (TLE1) is a transcriptional co-repressor of basic helix-loop-helix proteins (50) known to inhibit the expression of diverse muscle regula-tory factors, and the SLC2A4 regulator essential for normal GLUT4 expres-sion and transcriptional regulation via an AMPK-induced mechanism (52). Heat shock proteins (HSPs)
HSPs are involved in the protection of proteins in response to heat stress, oxidative stress and ischemia. In addition, HSPs are also involved in differ-ent physiological functions. These proteins are primarily involved in protein folding, synthesis and chaperone function of misfolded proteins. Heat shock transcription factor (HSF-1) is one of the well-characterized heat shock tran-scription factors that are involved in acute stress. The high molecular-weight family of proteins include: HSP 110, HSP 90, HSP 70 and HSP 60. The low-er molecular-weight family of proteins include: HSP 27 and alpha crystalline family. Ubiquitin C-terminal hydrolases (UCHs) constitute a subfamily of de-ubiquitinating enzymes that belongs to the cysteine proteases. Skeletal muscles of Uchl3 knockout mice show up-regulation of various heat shock proteins including HSP 27, HSP 40, HSP 70, HSP 90, and HSP 110. These results reveal that the skeletal muscle of Uchl3 knockout mice is under per-sistent stress and show cellular stress responses (128).
When tissues are challenged, HSPs will play a role by preventing inap-propriate protein aggregation and mediating transport of immature or mis-folded proteins to cell organelles for repair, packaging, or degradation. In-creased HSP 90 expression has been shown in the regenerating muscle fibers of idiopathic inflammatory myopathies (25). HSP 70 has been reported in-volved in FOXO signaling, in disuse condition of rat soleus muscle. Up-regulation of HSP 70 prevent muscle atrophy (126) and HSP 70 over
expres-sion leads to protection against fatigue induced muscle injury (103). HSP 27 is a cytoprotective protein that is ubiquitously expressed in most cells, and is up-regulated in response to cellular stress. HSP 27 is a negative regulator of NFkB in skeletal muscle and is sufficient to inhibit MuRF1 and Atrogin-1 to attenuate skeletal muscle disuse atrophy (28).
αB-crystallin is a small heat shock protein (20 kDa) and is the well known stabilizer of intermediate filaments (27) and actin (132). It maintains cy-toskeleton integrity, by acting as a chaperone for desmin (40). The αB-crystallin was up-regulated during muscle differentiation and mice lacking αB-crystallin die prematurely with extensive muscle wasting and it plays an important role in muscle homeostasis (133). DNAJA1 (HSP 40), a co-chaperone for the HSP 70 and stimulate ATPase activity. Heat shock factor 2 (HSF2), encodes a protein which is implicated in early stages of skeletal muscle regeneration (90). All together these heat shock proteins play a very important role in the sparing of the skeletal muscle in different conditions. Sarcomeric protein
The regulatory thin filament protein tropomyosin β expressed in muscle fibers of the slow-twitch type. Myosin light chain kinase (MyLC-K) is a critical component in signaling sequences and involved in protein-protein interactions. Myosin heavy chain 7, cardiac muscle beta (MYH7) expressed in skeletal muscle tissues rich in slow-twitch type I muscle fibers and in-volved in the muscle contraction. Titin-cap (TCAP) also known as telethonin functions as a muscle assembly regulatory factor. Tropomyosin 3 (TPM3), gene binds to actin filaments in muscle and non-muscle cells. It plays a role, in association with the troponin complex, in the calcium dependent regula-tion of vertebrate striated muscle contracregula-tion. Myosin binding protein C1 (MyBP-C1) is the next to myosin most abundant protein in the thick filament and is suggested to play both an important structural and regulatory role in muscle contraction.
Oxidative stress responsive
Skeletal muscle is prone to oxidative stress due to various reasons and in order to protect muscle from stress different oxidative stress responsive genes were up-regulated which include thioredoxin (TXN) implicated in redox regulation of transcription factor NFkB in cell culture (51) and the cytosolic mammalian thioredoxin, has various functions in protection against oxidative stress (6). Peroxisome proliferative activated receptor gamma, co-activator beta (PPARGC1B or PGC-1β) gene implicated in mitochondrial biogenesis (5). Mitochondrial superoxide dismutase 2 (SOD2) protects the mitochondrial matrix by removing excessive superoxide anion (O2-) at the
Cell cycle
Various cell cycle regulation genes were altered including the cyclin/cyclin dependent kinase (CDK) inhibitor p21 which is involved in myogenic pro-genitor cell coordinated regulation of cell cycle exit and myogenic differen-tiation (49); death effector domain containing (DEDD) gene plays a role in inhibition of cyclin-dependent kinase-1 (Cdk1) function and it forms com-plexes with Akt and HSP90 and supports the stability of their function (61); diablo homolog (DIABLO) gene encodes an inhibitor of apoptosis protein (IAP)-binding protein and in denervated rat gastrocnemius muscle an in-creased expression was associated with DIABLO, leading to apoptosis in this atrophy model (134); Cofilin 2 (CFL2), an actin binding protein reported down-regulated in damaged muscle tissue (141) and met proto-oncogene (MET) is a skeletal muscle satellite cell marker (83).
Immune response
Complement component 7 (C 7) reported to play a key role as a major me-diator of the direct tissue damage caused by complement activation. It may accordingly contribute to the development of severe complications during systemic infection (105). IL-6 is a proinflammatory cytokine synthesized by the skeletal muscle. The increased levels of plasma IL-6 has been reported in lipopolysaccharide induced human endotoxemia (93).
Kinase activity
Adenylate kinase 1 (AK1) is involved in muscle energetic economy and metabolic stress tolerance (57). Striated muscle preferentially expressed protein kinase (SPEG) gene, a sensitive marker for skeletal muscle differen-tiation (53). Mitogen-activated protein kinase-activated protein kinase 2 (MAPKAPK2) and mitogen-activated protein kinase kinase kinase 14 (MAP3K14) are required for skeletal muscle differentiation (18, 109) and these were also involved in the skeletal muscle atrophy through MAPK sig-naling via its downstream effectors like Gadd45 and p21 (26).
Protein metabolism
Atrogin-1, also known as MAFbx a member of SCF (SKP1-CUL-F-box protein) subfamily of E3 ligases and its mRNA levels increases during most muscle wasting conditions (11, 42). Different proteasome subunit complexes PSMD2, PSMD3 and PSMD11 cleave peptides in an ATP/ubiquitin-dependent process. The lysosomal cysteine proteinases (cathepsins CTSL, CTSL2 and CTSD) play an important role in intracellular protein break-down. Metalloproteinase inhibitor 2 precursor (Timp2), endogenous Timp proteins are inhibitors of matrix metalloproteinase (Mmp) that act primarily by their ability to chelate Zn2+ and the inactive form of Mmp is stabilized by
enzyme (19). These MMPs are involved in both extracellular and intracellu-lar protein degradation (4).
Chemokine activity
Various chemokine genes were altered such as chemokine ligand 2 (CCL 2) or MCP-1, involved in sepsis induced muscle dysfunction (62). Chemokine receptor 7 (CXCR7) is involved in myogenic differentiation (95). CCL 19 and CCL 21 are the ligands for chemokine receptor 7 (CCR 7) and an in-creased expression of these ligands have been shown in muscles of poly-myositis (139).
The deregulation of skeletal muscle contraction and/or muscle mass can lead to various muscle wasting diseases such as acute quadriplegic myopathy in intensive care unit patients.
Acute Quadriplegic Myopathy
Primary muscle involvement in ICU patients initially remained under recog-nized, but there has been great interest in multi model investigations of ICU paralysis syndromes, which have shown that AQM may be the most com-mon, acquired neuromuscular disorder in ICU patients. A common and se-rious complication in ICU patients with critical illness is severe muscle weakness in combination with respiratory failure (45). A myopathy asso-ciated with critical illness was initially reported in a patient treated for status asthmaticus (84). This specific condition has been given more than ten dif-ferent names besides AQM, such as, critical illness myopathy, thick filament myosin myopathy, acute myopathy in severe asthma, myopathy of intensive care etc (64). Specific for this type of myopathy is the apparent preferential loss of thick filament proteins; several triggering factors have been sug-gested to induce this condition, such as NMBA, CS and sepsis (64, 69, 119).
Acute muscle wasting and persistent weakness, mostly effecting limb muscles, are distinctive features of ICU patients with AQM (64). For many years AQM was considered to be a rare and of limited clinical significance due to miss or under diagnosis. AQM prevalence rate is not clear; some stu-dies have revealed that it can vary between 35-42% in the ICU population (63).
AQM not only causes the significant muscle weakness, but can also lead to an increased ICU stay, higher morbidity rate and impaired rehabilitation. Additionally, the median hospital costs for AQM patients are $91,476 i.e., in excess of $66,713 as compared to ICU control patients (116). To treat the AQM patients, the cost increased to $2232-$4174 per day (125). The in-creased cost is partly due to the fact that the standard weaning time of the
patient from the ventilator is doubled in critically ill patients developing severe weakness, compared to those without (23).
Diagnosis
AQM is under diagnosed primarily due to insufficient diagnostic methods. The prevalence of AQM is not known, one-third of the ICU patients treated for status asthmaticus develops AQM (29). AQM is a primary myopathy with distinctive clinical, electrophysiological and morphological findings such as 1. The patient is critically ill (multiorgan dysfunction and failure), 2. Limb weakness or difficulty in weaning of patient from the ventilator, 3. Compound muscle action potential (CMAP) amplitudes less than 80% of the lower limit of normal in two or more nerves, 4. Sensory nerve action poten-tial amplitudes more than 80% of the lower limit of normal, 5. Needle elec-tromyography with short duration, low-amplitude motor unit potentials with early or normal full recruitment, with or without fibrillation potentials in conscious and collaborative patients; or increased CMAP duration or re-duced muscle membrane excitability on direct muscle stimulation in non-collaborative patients, 6. Absence of a decremental response on repetitive nerve stimulation and 7. Muscle histopathological findings of primary myo-pathy (myosin loss or muscle necrosis) (64, 73). Serum creatine kinase (CK) elevation has been reported in some patients during the first week and it can serve as an additional diagnostic feature (29).
Even though the correct diagnosis of AQM is difficult for several reasons, such as the cooperation from patients required for EMG, many ICU patients are incapable of voluntary muscle contraction due to severe muscle weak-ness, deep sedation, neuromuscular blockade or encephalopathy (13). The differentiation between polyneuropathy and myopathy is complex by con-ventional EMG, leaving room for miss-diagnosis of AQM (76).The diagno-sis of AQM is further complicated by several independent factors like prima-ry disease, different pharmacological interventions, muscle biopsies taken several weeks after ICU admission and exposure to different causative agents.
Although it is an invasive procedure, a muscle biopsy is required for his-tological confirmation of AQM (34, 150). Electrophoretic separation of intracellular proteins from a muscle biopsy can reveal a selective loss of myosin and myosin associated proteins (a pathognomonic factor of AQM) (69, 71, 89). Muscle biopsy histopathology shows muscle fiber atrophy with preferential loss of type II fibers, fiber necrosis and regeneration. Further-more extensive myosin loss can be observed in muscle biopsy cross sections using various methods such as electron microscopy, enzyme and immune cytochemical analysis of and gel electrophoresis. In all these techniques, electrophoretic separation of myofibrillar proteins by SDS-PAGE and
myo-sin to actin ratio has been suggested as superior, sensitive and rapid methods to diagnose AQM (71) (figure 7).
Figure 7. The 6% SDS-PAGE for AQM diagnosis. Lane’s 1and 4 represent controls, lane 2 represents acute phase of the disease (decreased myosin to actin ratio) and full recovery after 2 months in lane 3.
Interventions and risk factors
Many ICU patients who are exposed to numerous intervention strategies, they are typically mechanical ventilated receive analgesia and are sedated during hospitalization. The principle aims of these interventions are to pro-vide comfort and minimize pain, suffering, anxiety, and other forms of dis-tress to the patient, some of which are the result of ICU interventions. How-ever the dose and time of different interventions in the ICU can in fact cause the muscle wasting and loss of muscle function observed in the patients.
The following interventions are mostly used in the ICU which will cause the AQM.
1 2 3 4
Mechanical ventilation
Mechanical ventilation is required when the body cannot meet its oxygen demand through spontaneous breathing or when the body cannot adequately remove carbon dioxide (CO2). Different conditions can increase the oxygen
demand, such as abnormalities in the respiratory system, neuromuscular disease, or cardiovascular system failure. Critically ill patients who are ad-mitted to the ICU typically require mechanical ventilation (MV) and are immobilized for long time periods. Muscle specific differences and the time period of immobilization also play a major role in the severity of the muscle atrophy.
Neuromuscular blocking agents (NMBA)
NMBA have been forwarded as a factor triggering AQM in ICU patients. However the generalized muscle weakness of AQM should be differentiated from the prolonged paralysis associated with the discontinuation of NMBA. It has been shown that there is a positive correlation reported between the dose and duration of NMBA therapy and the possibility of developing a myopathy (29). NMBA are metabolized by the liver and cleared by the kid-ney. Extended the effect of NMBA may accordingly have prolonged effects that may persist for several days after the use of the drug has been discontin-ued (124).
It has been suggested that NMBA such as pancuronium bromide, a bi-quaternary amino steroid, or the shorter acting vecuronium, and steroids, singly or in combination trigger the primary myopathy. These compounds are generally used for more than 24 hours, but occasionally for days and weeks. When they are discontinued, complexity in weaning from the ventila-tor and limb paralysis are prominent.
Corticosteroids
Different experimental studies reveal deleterious effects of corticosteroids on the neuromuscular system. A prospective study showed that corticosteroids are the key factors triggering muscle weakness in ICU patients (24). Fur-thermore rats receiving corticosteroids have shown structural muscle changes that are similar to those that are observed in critically ill patients (88, 115). Patients who get more than 5mg of hydrocortisone were reported to develop a myopathy (131). Some steroids such as the fluorinated corticos-teroids trimicinolone, tamethasone, and dexamethasone are involved in mus-cle weakness. Actually, dexamethasone has been found to promote enhanced protein breakdown and increased expression of the genes generally involved in the ubiquitin-proteasome proteolytic pathway (39). Corticosteroids can also induce several different transcriptional factors activating various proteo-lytic pathway genes leading to muscle fiber atrophy (3, 43, 120). Not only is the muscle degradation but protein synthesis is also impaired as evidenced by the up-regulation of 4EBP1 (129).
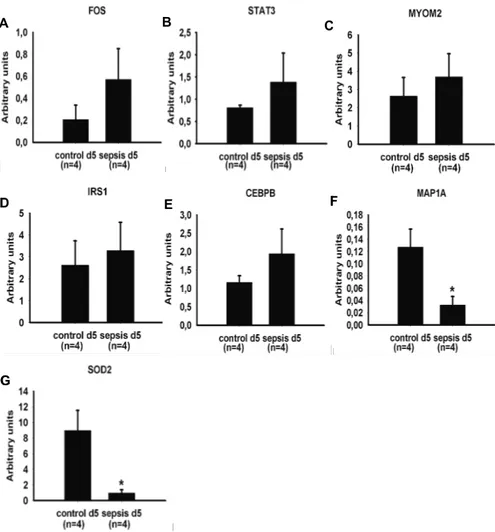
Sepsis
Sepsis is a leading cause of death in intensive care unit patients. Sepsis is characterized by a body temperature of 390C or more or below 35.50C, a
heart rate of 90 beats per minute or more, a respiratory rate of more than 10 liters per minute, and a known or strongly suspected infection (22). There is ample scientific indication that sepsis induces a myopathy characterized by reductions in the force-generating capacity and atrophy (138). Mitochondrial dysfunction has been shown to be correlated with septic shock (14). Proin-fammatory cytokines (TNFα and IL-6) and chemokine activity (MCP-1) genes have been reported to be involved in the reduction of force-generating capacity of the contractile proteins (62). Muscle wasting occurs later in the course of systemic inflammation and results in increased proteolytic degra-dation and decreased protein synthesis. The ubiquitin ligases atrogin-1 and MuRF1are important players in the sepsis induced muscle atrophy (42, 74).
Muscle disparities
The process of muscle wasting differs between the diverse groups due to their embryonic origin, muscle fiber constitution and post-natal development of the muscle. In ICU patients, diaphragm muscle dysfunction occurs within hours of the initiation of the MV (80). Limb muscles are typically severely affected at a later stage, i.e., after several days of ICU treatment, and cra-niofacial muscles are less or not affected.
Craniofacial muscle
The head muscles originate from cranial mesoderm (101). Branchiomeric muscles that are involved in mastication, facial expression, function of the larynx and pharynx are derived from pharyngeal mesoderm, which includes both lateral splanchnic and paraxial mesoderm (78).
However a disparity exit between head and trunk muscles as they have different gene regulatory programs, for instance, pax3 is an important up-stream regulator of trunk myogenesis (15), but it is not expressed in head mesoderm. Tbx1 and Pitx2 genes , on the other hand, are upstream regulators of skeletal myogenesis in the head, but not in the trunk (46).
In the post-natal period, fiber type differences continue, where the adult craniofacial muscle fibers maintain fetal myosin heavy chain (MyHC) iso-form expression and in some species α-cardiacMyHC (146, 148). Masticato-ry muscle fibers are different in several characteristics from limb muscle fibers, such as smaller CSA and type II fibers being smaller than type I (32). During ageing, several limb muscles exhibit afast to slow shift in fiber type proportions, while a slow to fast fiber type shift has been observed in the masseter muscle (98).
Limb muscle
In mammals, skeletal muscles are still immature at birth and important changes in the fiber type takes place during early stages of the postnatal de-velopment. The postnatal changes in the fiber type profile can be explained by the collective action of an intrinsic genetic program and of extrinsic fac-tors, such as hormonal and neural influences, acting on the myonuclei of the myofibers themselves. On the other hand, the possibility of developmental changes of satellite cells incorporated into the growing myofibers of neonat-al muscle neonat-also need to be considered (121). Direct evidence for satellite cell transformation was recently reported with respect to the role of the transcrip-tion factor Pax7. The Pax7 gene was inactivated at different developmental periods using an inducible knockout approach (77).
Biceps femoris is a posterior thigh muscle and it belongs to the hamstring muscle group. The embryonic origin of biceps femoris muscle is from me-senchyme of the limb buds. 1/4 th of the fibers are slow-twitch and 3/4 th of
the fibers are fast-twitch (44). The fiber type profile of skeletal muscles un-dergoes important changes during subsequent stages in postnatal life and aging.
Diaphragm muscle
The diaphragm is the main inspiratory muscle. It works continuously and generally at a low intensity. From a general point of view, functional and biochemical characteristics of the diaphragm is similar to those of other ske-letal muscles with a similar fiber type composition. However, fibers express-ing slow- and fast-twitch MyHC isoforms are present in equal proportions in the adult human diaphragm. A small fiber size, abundance of capillaries, and a high aerobic oxidative enzyme activity are typical features of diaphragm fibers, i.e., in accordance with a high fatigue resistance required for conti-nuous respiratory activity (108).
It is made clear that many different primary diseases, large variability in pharmacologic treatment, collection of muscle samples several weeks after admission to the ICU, and exposure to different causative agents are all fac-tors complicating mechanistic studies of muscle paralysis and wasting in the clinical ICU setting. Thus there is, accordingly, a compelling need for ani-mal models mimicking ICU conditions (66). In an attempt to unravel these muscle specific differences in the response to the ICU intervention alone and/or in combination with sepsis or corticosteroids, gene expression analys-es and single muscle fiber contractile measurements have been conducted in masticatory, limb and diaphragm muscle using a unique porcine ICU model.
Aims of the present investigation
General aim
The general goal of this study was to gain knowledge regarding the gene expression, protein degradation and muscle specific differences in response to the ICU condition. In accordance with the stated objective, a porcine ICU model was used to address the muscle specific gene expression in response to MV, NMBA, sepsis and CS separately or in combination.
Specific aims
1. Identify gene expression changes underlying the sparing of masticatory versus limb muscles in the experimental pig ICU model (Paper I).
2. Determine the role of sepsis on gene expression in limb muscles (Paper II).
3. Determine the effects of corticosteroids on gene expression in limb mus-cles (Paper III).
4. Explore the mechanisms underlying diaphragm muscle weakness in the pig ICU model (Paper IV).
Materials and Methods
Animals (Paper I, II, III and IV)
A total of 18 female domestic piglets (23–30 kg body weight) were included. All piglets originated from the same farm (Vallrums Lantbruk, Ransta, Swe-den) and were kept in 12 square meter pens with hay, straw, and wood shav-ings as bedding material. They were housed at 18–19°C and relative humidi-ty of 45–55% under natural day-night rhythm with liberal access to feed (Smagrisfoder Solo 331; Lantmannen, Stockholm, Sweden), water, and envi-ronmental enrichment. Food, but not water, was withheld for 12 h before induction of anesthesia. The Ethical Committee on Animal Research at the Karolinska Institute, Stockholm, Sweden, approved the study protocol (Dnr N71/98, N54/02 and N75/04).
Intervention (Paper I, II, III and IV)
The pigs were sedated with medetomidine (Dormitor vet 1mg/ml, Orion Pharma AB, Stockholm, Sweden) and zolazepam (Zoletil 250, Reading, Carros, France) before an intravenous access was placed, and 100mg of ketamine (Ketaminol vet50mg/ml, Intervet, Boxneer, Netherlands) was ad-ministered. Following tracheostomy, all animals were mechanically venti-lated using volume-controlled ventilation (Siemens 900A ventilator; Sie-mens Elema, Solna, Sweden) adjusted to an initial FiO2 of 0.21–0.30, an
inspired tidal volume of 10 ml·kg-1and a respiratory rate of 20 breaths per
min, with an I:E ratio of 1:2 and inspiratory rise time of 5-10%. During the remaining study period, the settings were adjusted carefully to maintain ar-terial oxygen and carbon dioxide tensions within normal limits and to avoid high airway pressures and risk of barotrauma. Sedation was titrated to pro-mote immobilization and allow ventilator synchrony by inhibiting spontane-ous breathing activity. Anesthesia was maintained and adjusted through a novel anesthetic conserving device (AnaConda, Sedana Medical, Sundby-berg, Sweden) which permits administration of an inhaled anesthetics via a syringe pump to the inspired gas mixture, as previously described (117). During this study period, isoflurane (Abbott Laboratories, Chicago, Il, USA) was delivered at 0.8 – 1.3% end-tidal concentration and supplemented by intravenous bolus doses of morphine and ketamine as needed to provide immobilization. Core body temperature (blood) was maintained in the range of 38.5 – 40°C by a servo controlled heating pad. Animals received 2000 – 4000 ml/day as a continuous intravenous infusion of a crystalloid solution
(Ringeracetat, Fresenius Kabi, Stockholm, Sweden) to maintain stable blood pressure and urinary output throughout the experimental period and an intra-venous glucose infusion (Rehydrex, Fresenius Kabi, Stockholm, Sweden, 25 mg glucose /mL) at 1 – 1.5 ml/kg/hr titrated to maintain blood glucose be-tween 4-8 mmol/L to decrease the effects of catabolism. In addition, each animal received prophylactic streptomycin 750 mg/d and bensylpenicillin 600 mg/d (Streptocillin Vet, Boeringer-Ingelheim, Hellerup, Denmark). Ar-terial oxygen and carbon dioxide tensions, acid-base balance, electrolytes and blood glucose levels were monitored regularly and kept within normal range throughout the study period. A neuromuscular blocking agent (NMBA) was administered as a continuous infusion of rocuronium (Esme-ron, Organon, Boxtel, The Netherlands) 25 mg/hr for 5 days while a corti-costeroid (CS) was given as bolus doses of hydrocortisone (Solu-Cortef, Pfizer AB) 50 mg three times daily for 5 days. Endotoxemia was induced after completion of the surgical preparation on day 1 by administration of a continuous infusion of Escherichia coli endotoxin, serotype O26:B6 (Sigma Chemical, St.Louis, Missouri, USA) at a rate titrated to physiological effects (mean blood pressure decrease of >30% and a pulmonary artery occlusion pressure increase of 50%) with a mean total dose of 8 µg/kg.
Expression profiling (Paper I, II and III)
Three micrograms of total RNA from the muscle samples were extracted and processed to generate biotin-labeled cRNA as previously described (20). Each sample was then hybridized to Affymetrix Porcine Genome Array con-taining 23,937 probes representing 20,201 genes. Standard operating proce-dure and quality control was done as previously described (20). Muscle samples from the animals on day 1 and day 5 were profiled. All profiles have been made publicly accessible via National Centre for Biotechnology infor-mation Gene Expression Omnibus (GSE24239; GSE33037; GSE37166 http://www.ncbi.nlm.nih.gov/geo).
Microarray data normalization and analysis (Paper I, II and III)
Subsequent analysis of the gene expression data was carried out in the freely available statistical computing language R (http://www.r-project.org) using packages available from the Bioconductor project (www.bioconductor.org). The raw data was normalized using the robust multi-array average (56) background-adjusted, normalized and log-transformed summarized values first suggested by Li and Wong in 2001 (81). In order to search for the diffe-rentially expressed genes between the samples from the different days an empirical Bayes moderated t-test was applied (136), using the ‘limma’ pack-age. A linear model was fitted to the data, Day5 vs. Day1 effects were esti-mated. To address the problem with multiple testing, the p-values were ad-justed according to Benjamini and Hochberg. Significant probe sets with an adjusted p-value < 0.05 were selected for further investigation and more than a 2-fold change were included in further analyses. Since the porcine array is
minimally annotated and is not identified by web based analysis software, we used published putative human homologues (143). Up- and down-regulated transcripts were further analyzed and categorized using DAVID web based functional annotation tool (http://david.abcc.ncifcrf.gov/) (54). Some of the functional categories were combined and some categorization was done manually, to improve the interpretative value of the data. Cluster-ing images were developed usCluster-ing Genesis software (137).
cDNA synthesis (Paper I, II, III and IV)
cDNA for all papers was prepared using qScript TM cDNA SuperMix (Quanta Biosciences, Inc. MD 20877, USA) according to the instructions from the manufacturer.
Quantitative real time RT-PCR (Paper I, II, III and IV)
Reverse transcription and quantitative PCR analysis was performed as pre-viously described (102). Briefly, total RNA (100ng) was reverse transcribed to cDNA using Qscript cDNA supermix (Quanta Biosciences, USA). cDNA was amplified in triplicate using MyiQ™single color real time PCR detec-tion system (Bio-Rad Laboratories, Inc., Hercules, CA, USA), and used to quantify the mRNA levels for porcine Atrogin-1, HSP 110/105, FOXO1A, αB-crystallin, FOS, STAT3, MYOM2, IRS1, CEBPB, PGC1-β, myostatin, MAP1A, SOD2, MyHC I, MyHC IIx and 18S. The thermal cycling condi-tions include 95ºC for 9 minutes, followed by 50 cycles of amplification at 95ºC for 15 sec, followed by 60ºC for 1 minute. Each reaction was per-formed in a 25µl volume with 0.4µM of each primer and 0.2µM probe or SYBR green (1988123, Roche Diagnostics, GmBH, Ulm, Germany). Taq man primers and probes were designed using Primer Express® program (Applied Bio System, Foster City, CA, USA). Porcine 18S gene was used as the internal control. Primer sequences for porcine Atrogin-1 and HSP 105/110 were published elsewhere (8, 102, 106).
Total protein quantification (Paper I, II, III and IV)
To quantify the total protein, cryosections of muscle biopsy were obtained and submerged in to 8M urea buffer, with subsequent centrifugation and sonication. This sample was then used for total protein quantification using the NanoOrange® Protein Quantification Kit (Molecular Probes, Inc., Eu-gene, OR, USA). The fluorescence of the samples was measured using a Plate Chameleon™ Multilabel Platereader (Hidex Oy, Finland) and related to a standard curve. Values were obtained by using the software MikroWin, version 4.33 (Microtek Laborsysteme GmbH, Overath, Germany).
Immunoblotting (Paper I, II, III and IV)
SDS-PAGE was performed by using Mini-PROTEAN® 3 Cell (Bio-Rad
protein were used. Electrophoresis was performed at 120 volts for 1hour 30mins; gels were subjected to polyvinylidene fluoride (PVDF) membranes (GE Healthcare) and transfer the blot for 1hour at 350mA current. Mem-branes were incubated with HSP 70 (SMC 100A/B, Stress Marq Biosciences Inc, BC, Canada), HSP 90 (AC88, Stressgen, Ann Arbor, MI), Apg 2 (sc-6240, Santa Cruz biotechnology Inc., CA, USA), SOD2 (ab13533, Cam-bridge Science Park, CB4 0FL, UK), FOXO1A (sc-11350, Santa Cruz Bio-technology Inc., CA, USA), Atrogin-1 (AP2041 ECM Biosciences, KY, USA), αB-crystallin (SMC 159A/B, Stress Marq Biosciences Inc, BC, Can-ada), p62 (P0067, Sigma-Aldrich, MO, USA), UNC45B (a generous gift by Brian Stanley/Jennifer Van Eyks lab) and Actin (sc-1616, Santa Cruz Bio-technology Inc., CA, USA) primary antibodies. Protein detection was per-formed by incubating the membranes with secondary antibodies NA931 or NA934 (GE Healthcare) and using ECL Advance western blotting detection kit (RPN 2135, GE Healthcare) according to the manufacturer’s instructions. Of all signal intensities were normalized to Actin signal intensity, followed by scanning the gels (Molecular Dynamics) and measuring the intensity vo-lume (Image Quant TLv 2003, Amersham Biosciences).
Statistical analysis (Paper I, II, III and IV)
For the single muscle fiber size and function, Sigma Stat software (Jandel Scientific) was used to generate descriptive statistics. Given the small num-ber of pure type IIb and hybrid type I/IIa and IIx/IIb finum-bers observed in the single muscle fiber experiments, comparisons were restricted to muscle fi-bers expressing the type I, IIa, IIa/IIx and IIx MyHC isoforms. A two-way ANOVA (day x fiber type) was performed followed by the Tukey’s test (level of significance P<0.05). Values are means and standard error of means (SE). T-test was used to test statistical significance for both the quantitative RT-PCR and western blotting experiments.
Muscle biopsies (Paper I, II, III and IV)
Muscle biopsies of the masseter and biceps femoris were obtained from animals on two separate occasions, i.e., on day 1 before administration of NMBA, CS and endotoxin (control biopsy) and on day 5 (after intervention). The biopsy on day 1 was taken from both the left or right masseter and bi-ceps femoris muscle while the biopsy on day 5 was taken from the contrala-teral side, in order to eliminate the risk of interference induced by the biopsy procedure. Biopsies were split in two portions; one part was frozen in liquid propane cooled by liquid nitrogen and stored at -80°C for later analysis while the other part was immediately placed in an ice-cold relaxing solution (in mmol/l: 100 KCl, 20 Imidazole, 7 MgCl2, 2 EGTA, 4 ATP, pH 7.0;
4°C). Small bundles of ~25-50 fibers were dissected free from the muscle and tied to a glass micro capillary tube at ~110% resting length. The bundles were then placed in a skinning solution (relaxing solution containing glyce-rol; 50:50 v/v) at 4°C for 24 h and subsequently stored at -20°C for use
with-in 3 weeks, or treated with a cryoprotectant (sucrose solution) for long-term storage at -80°C as described earlier (38).
Single muscle fiber experimental procedure (Paper I and IV)
On the day of an experiment, a fiber segment 1 to 2 mm long was left ex-posed to the experimental solution between connectors leading to a force transducer (model 400A,Aurora Scientific) and a lever arm system (model 308B, Aurora Scientific) (99). The apparatus was mounted on the stage of an invertedmicroscope (model IX70; Olympus). While the fibersegments were in relaxing solution, the sarcomere length wasset to 2.65-2.75 µm by adjust-ing the overall segment length (70).The diameter of the fiber segment be-tween the connectors was measured through the microscope at a magnifica-tionof ×320 with an image analysissystem prior to the mechanical experi-ments. Fiber depth was measured by recording the vertical displacementof the microscope nosepiece while focusing on the top and bottomsurfaces of the fiber. The focusing control of the microscopewas used as a micrometer. Fiber cross-sectional area (CSA) was calculated from the diameter and depth, assuming an ellipticalcircumference, and was corrected for the 20% swelling that isknown to occur during skinning (99).
Relaxing and activating solutions contained (in mM) 4 Mg-ATP, 1 free Mg2+, 20 imidazole, 7 EGTA, 14.5 creatine phosphate, and KCl to adjustthe ionic strength to 180 mM. The pH was adjusted to 7.0. The concentrations of free Ca2+ were 10-9 M (relaxing solution) and 10-6.2, 10-6.0, 10-5.8, 10-5.5, 10-5.2, 10-4.9 and 10-4.5 M (activating solutions), expressed as pCas (i.e., -log [Ca2+]).
Apparent stability constants for Ca2+-EGTA were corrected for temperature
(15 0C) and ionic strength(180 mM). The computer program of Fabiato (33)
was used to calculate the concentrations of each metal, ligand, and metal-ligand complex.
At 15 0C, immediately preceding each activation, the fiber was immersed
for 10-20 s in a solution with a reduced Ca2+-EGTA buffering capacity. This
solution is identical to the relaxing solution except that the EGTA concentra-tion is reduced to 0.5 mM, which resultsin more rapid attainment of steady-state force during subsequent activation. Maximum velocity of unloaded shortening (V0) was measured by the slack-test procedure (31). Fibers were
activated at pCa 4.5 and once steady tension was reached, various ampli-tudes of slack (ΔL) were rapidly introduced (within 1-2 ms) at one end of the fiber. The time (Δt) required to take up the imposed slack was measured from the onset of the length step to the beginning of tension redevelopment. For each amplitude of ΔL, the fiber was re-extended while relaxed in order to minimize non-uniformity of sarcomere length. A straight line was fitted to a plot of ΔL vs Δt, using a least-squares regression, and the slope of the line was recorded as V0 for that fiber. Maximum active tension (P0) was
calcu-lated as the difference between the total tension in the activating solution (pCa 4.5) and the resting tension measured in the same segment while in the
relaxing solution. All contractile measurements were carried out at 15 0C.
The contractile recordings were accepted in subsequent analyses if a V0
val-ue was based on linear regressions including four or more data points, and data were discarded if r for the fitted line was less than 0.97, if SL during isometric tension development changed by more than 0.10 μm compared with SL while the fiber was relaxed or if force changed more than 10% from first to final activation (99). Specific tension (ST) was calculated as maxi-mum tension (P0) normalized to CSA.
Stiffness. Once steady-state isometric force was reached, small-amplitude sinusoidalchanges in length (ΔL: ± 0.2% of fiber length), were applied at 500 Hz at one end of the fiber (86). The resultant force response(ΔF) was measured, and the mean of 20 consecutive readingsof ΔL and ΔF was used to determine stiffness. The actual elastic modulus (E) was calculated as the difference betweenE in activating solutions and restingE measured in the same segment in the relaxing solution. E was determined as follows (92).
E = (ΔF/ΔL) x (fiber length/CSA)
Relative force-pCa and stiffness-pCa relationships. Each fiber was exposed to different solutions with varying pCas (pCa 9.0–4.5). Force and stiffness were normalized to maximum force and stiffness at pCa 4.5 allowing the construction of relative force-pCa and relative stiffness-pCa curves. To de-termine the midpoint (termed pCa50) and the Hill coefficient (nH) from the
pCa curves, data were fitted (SigmaPlot 5.0 and Origin 6.1 Professional software; JandelScientific) using the Hill equation in the following form:
X = 100 x [Ca2+]nH / ([Ca50]nH + [Ca2+]nH)
X is the relative force or relative stiffness. -log [Ca50] is the midpoint
(pCa50). nH is the Hillcoefficient.
After the mechanical measurements, each fiber was placed in urea buffer (120 g urea, 38 g thiourea, 70 ml H20, 25 g mixed bed resin, 2.89 g
dithioth-reitol, 1.51 g Trizma base, 7.5 g SDS, 0.004 % bromophenol blue) in a plas-tic micro centrifuge tube and stored at -80 0C for subsequent electrophoretic
analyses.
Measurement of reactive carbonyl derivatives (Paper IV)
The reactive carbonyl derivatives of myosin and actin were determined using the Oxy-Blot protein oxidation detection kit (Invitrogen) via 12% SDS-PAGE gels and Western blotting (149). All the samples were loaded with identical volumes and protein quantities (2.5 µg each). The reactive carbonyl derivatives were quantified using a soft laser densitometer (arbitrary unit).
Sodium Dodecyl Sulphate -Polyacrylamide gel electrophoresis (SDS-PAGE) (Paper I and IV)
The myosin heavy chain (MyHC) composition was determined by 6% SDS-PAGE. The total acrylamide and bis concentrations were 4% (w/v) in the stacking gel and 6% in the running gel, and the gel matrix included 30% glycerol. The ammonium persulphate concentrations were 0.04% and 0.029% in the stacking and separation gels, respectively, and the gel solu-tions were degassed (<100 millitorr) for 15 min at 18 0C. Polymerisation was
subsequently activated by adding TEMED to the stacking (0.1%) and separa-tion gels (0.07%). Sample loads were kept small to improve the resolusepara-tion of the MyHC bands and electrophoresis was performed at 120 V for 22-24 h with a Tris-glycine electrode buffer (pH 8.3) at 15 0C (SE 600 vertical slab
gel unit, Hoefer Scientific Instruments, USA, for details see(68, 70). Total MyHC and actin content (Paper I and IV)
Myosin and actin quantification was determined by 12% SDS-PAGE. The acrylamide concentration was 4% (w/v) in the stacking gel and 12% in the running gel, and the gel matrix included 10% glycerol. Volumes of 5 µl of the samples were loaded together with 5 µl of the standard dilutions. The standard was prepared by pooling sections from control rats’ EDL and soleus muscles. The myofibrillar protein standards were prepared, assuming that actin and myosin contents were 12.5 and 25% of the total protein content, respectively. Linear actin and myosin curves were observed within the 5-200 µg/ml range, but the calibration curves were not parallel. Electrophoresis was performed at 32.0 mA for 5 h with a Tris-glycine electrode buffer (pH 8.3) at 15 0C (SE 600 vertical slab gel unit; Hoefer Scientific Instruments). The gels were stained using SimplyBlue™ SafeStain (Invitrogen) and subse-quently scanned in a soft laser densitometer (Molecular Dynamics, Sunny-vale, CA, USA) with a high spatial resolution (50 µm pixel spacing) and 4096 optical density levels. The volume integration function was used to quantify the amount of protein on 12% and 6% gels (ImageQuant TL Soft-ware v. version 3.3, Amersham Biosciences, Uppsala, Sweden).
Results and Discussion
Are there any differences in the gene expression of masticatory versus limb muscle function in an experimental critical illness model? (Paper I)
A unique porcine ICU model was used in this study. In this model, pigs were immobilized, mechanically ventilated, sedated and exposed to the factors triggering AQM, i.e., NMBA, CS and sepsis for five days. Both single fiber CSA and specific force (P0/CSA) were preserved during the five-day
expe-rimental period in fibers expressing type I, IIa, IIa/IIx and IIx MyHC iso-forms in the masseter muscle of piglets exposed to the ICU intervention. These results are in sharp contrast to our previous results in limb (biceps femoris) muscle fibers, showing a dramatic decline (p<0.05) in specific force (Fig. 8.). Analyses of gene expression profile and validation demonstrate that, during the interventions and time period described above, there was a significant differential expression in a number of functional gene clusters.
Figure 8. The masseter and biceps femoris single muscle fiber cross-sectional area (CSA) and specific force (SF, P0/CSA). A: CSA of masseter type I, IIa, IIa/IIx and
IIx muscle fibers on day 1 (black bars) and day 5 (gray bars); B: Specific force of masseter type I, IIa, IIa/IIx and IIx muscle fibers on day 1 (black bars) and day 5 (gray bars); C: CSA of biceps femoris type I, IIa and IIx muscle fibers on day 1 (black bars) and day 5 (gray bars); D: Specific force of biceps femoris type I, IIa and IIx muscle fibers on day 1 (black bars) and day 5 (gray bars). [C]and [D] were ob-tained from (Ochala et al 2011, PLoS ONE 6:e20876). Values are means + S.E.M.
The masseter up-regulated gene clusters includes transcription/growth fac-tors, protein degradation, heat shock proteins, GTP binding, cell cycle, oxid-ative stress responsive, mitochondrial/energy and immune response. Limb muscle (biceps femoris) gene expression analysis reveals the up-regulated gene clusters including WD repeat containing, proteasome subunit, cell cycle regulation, protein synthesis, heat shock proteins, co-chaperone and tran-scriptional regulation.
The masseter down-regulated gene clusters include transcription/growth factors, muscle protein, mitochondrial, carbohydrate metabolism, G-protein and related and protein modification. Limb muscle (biceps femoris) gene expression analysis reveals the down-regulated gene clusters including mito-chondrial, extracellular matrix, sarcomeric protein, ATP synthase, ankyrin, EGF-like domain containing, glycogen related and IGF-binding. In the mas-seter muscle in accordance with microarray data, real-time RT-PCR results indicated an up-regulation of the following genes: Atrogin-1 (3.31-fold), αB-crystallin (3.07-fold), HSP 110 (3.97-fold) and FOXO1A (2.61-fold). Down-regulation was confirmed in: myostatin (-5.16-fold) and PGC1-β (-1.96-fold) (figure 9.)
Figure 9. Microarray results were validated by real time RT-PCR in the masseter muscle. Atrogin-1 (A), αB- crystallin (B), HSP 105/110 (C) and FOXO1A (D) were up-regulated, while Myostatin (E) and PGC1-β (F) were down-regulated. Statistical-ly significant differences versus the control group are denoted * (p < 0.05), ** (p < 0.01), and *** (p < 0.001). A B C D E F * * * * * ** * * A B C D E F * * * * * ** * *