Estimating streambed and aquifer parameters from a stream/aquifer analysis test
12
0
0
Full text
(2) Fox. The advantage of the analytical solutions is that they allow insight into the dependence of the exchange rate on aquifer and streambed hydraulic parameters. Conclusions obtained from the analytical solutions are then directly transferable to the numerical models. Another advantage of analytical solutions is providing a mechanism for estimating parameters important in the numerical models. In fact, recent advancements in analytical modeling of stream/aquifer interaction has introduced the concept of performing aquifer tests adjacent to partially penetrating streams for estimating streambed hydraulic properties such as the streambed hydraulic conductivity. As suggested by Hunt et al. (2001), observed drawdown in one or more observation wells located between a pumping well and stream can be used with analytical solutions that account for streambed conductivity to inversely estimate both aquifer and streambed hydraulic properties. Only three such field tests have been documented: one analyzed by Hunt et al. (2001), another by Nyholm and Christensen (2000), and one presented by Nyholm et al. (2002). Several field techniques have been used to estimate the streambed hydraulic conductivity (Landon et al., 2001; Calver, 2001). These techniques include grain-size analyses of streambed samples, slug tests, in situ permeameter tests, and seepage flux measurements with seepage meters. Landon et al. (2001) compare these techniques for estimating the streambed hydraulic conductivity in sandy streambeds in the Platte River in Nebraska. They conclude that field permeameter tests are most advantageous for determining the streambed conductivity in the upper 0.25 m of the streambed. They also note that spatial variability between stream transects is greater than variability in measured streambed conductivity between different techniques. Streambed conductivity can vary significantly in both the horizontal and vertical directions within a streambed. Furthermore, field measurement of the streambed hydraulic conductivity gives a point measurement. The use of analytical solutions provides a mechanism for aggregating point measurement variations into a single estimate more aligned with the input requirements of numerical ground water flow models. The objective of this research is to investigate the use of analytical solutions for estimating streambed conductivity. A stream/aquifer analysis test (i.e., a pumping test performed next to a stream) is performed at the Tamarack State Wildlife Area along the South Platte River Basin in eastern Colorado. The Tamarack site consists of two primary surface water/groundwater interaction scenarios: (1) between the South Platte River and alluvial aquifer and (2) between secondary slough channels and the alluvial aquifer. The stream/aquifer analysis tests will be performed adjacent to the slough channel. Drawdown measured in observation wells between the slough channel and pumping well is used to inversely estimate sloughbed and aquifer parameters at the site. These estimates are compared to documented aquifer parameters and measurements of the sloughbed conductivity using falling-head permeameter tests. Drawdown is also measured in observation wells located between the slough channel and the South Platte River to. Hydrology Days 2003. 69.
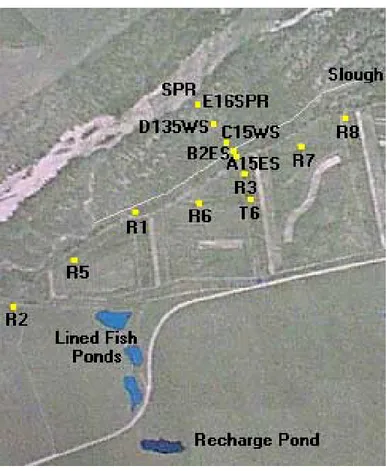
(3) Estimating Streambed and Aquifer Parameters. investigate the complexities of a multiple surface water sources on groundwater extraction.. 2. Description of Tamarack The Tamarack State Wildlife Area in Logan County, Colorado, has been identified by the state as a source of redirecting flows in the South Platte River during critical low flow periods. The primary recharge components at the Tamarack Managed Recharge Project are shown in Figure 1. Under conditions of unappropriated flow in the river, pumping wells in the floodplain (R1, R2, R3, R5, R6, R7 and R8) extract water from the alluvial aquifer and pump the water through pipes to off-channel recharge and lined fish ponds (Figure 1). Diverted surface water is allowed to infiltrate and return to the river as subsurface flow. The recharge ponds are spatially located so that the subsurface flow augments streamflow during critical lowflow, high-demand periods.. Figure 1. Location of existing pumping wells, slough channels, and South Platte River (SPR). R1, R2, R3, R5, R6, R7, and R8 are pumping wells.. The alluvial aquifer consists of an underlying layer of impermeable shale overlain by alluvial deposits of high permeability (Burns, 1985). The alluvial aquifer is characterized as braided stream deposits with interbedded clay, silt, sand, and gravel. Depths to impermeable shale vary from Hydrology Days 2003. 70.
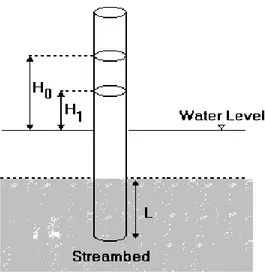
(4) Fox. approximately 20 to 60 m. Burns (1985) characterizes the alluvial aquifer as high conducting sand with a hydraulic conductivity of 60 m-d-1. Recent aquifer tests at the site have estimated the aquifer hydraulic conductivity to range from 60 to 200 m-d-1. The South Platte River is a shallow, braided river with considerable variation in width seasonally. Several secondary channels, or backwater sloughs, are present within the floodplain during periods of moderate to high flow in the South Platte River. These sloughs are expected to influence both the depletion of the river by the groundwater wells and the return flows toward the river. The slough channels are estimated to have an average width of approximately 7 m.. 3. Measurement of Sloughbed and Streambed Conductivity Permeameter tests were used to measure the conductivity of sediments in the sloughbed and streambed. Permeameter tests involve pushing a pipe partially into the streambed. Water is added to this pipe to induce a hydraulic gradient through the sediments inside the pipe. In a falling head permeameter test (Figure 2), the water level inside the pipe is allowed to fall while the water level and time are measured. Vertical streambed hydraulic conductivity can be calculated for the falling-head permeameter tests using an application of Darcy’s equation (Landon et al., 2001) or the Hvorslev (1951) equation. Application of Darcy’s equation for a falling-head permeameter yields. K sb =. H L ln 0 t1 − t0 H1 . (1). where Ksb is the vertical, streambed hydraulic conductivity, L is the sediment interval being tested, t1-t0 is the elapsed time, H0 is the initial displacement, and H1 is the displacement at time t1. The Hvorslev (1951) solution is similar to the Darcy’s equation in that it assumes uniform sediment within and below the permeameter, but also accounts for anisotropic conditions:. π D. +L H 11 m K sb = ln 0 t1 − t0 H1 . (2). where D is the diameter of the permeameter and m is the isotropic transformation ratio, K h K sb , where Kh is the horizontal, streambed hydraulic conductivity.. Hydrology Days 2003. 71.
(5) Estimating Streambed and Aquifer Parameters. Figure 2. Schematic diagram of falling head permeameter used to measure vertical streambed hydraulic conductivity.. The streambed hydraulic conductivity of the South Platte River and backwater slough channels at the Tamarack State Ranch Wildlife Area was measured using falling-head permeameter tests. The permeameter was a 100 cm long, polyvinyl chloride (PVC) pipe with an inside diameter of 15.24 cm. The permeameter was installed into the streambed with minimum disturbance to depths of 25 and 40 cm. Water was added to the PVC pipe and water level measurements were taken every ten to twenty seconds until the total time for the test was approximately three minutes or until measurable changes in the water level were not observed. The data obtained from these tests were analyzed using both Darcy’s law and the Hvorslev (1951) equation with m=1 for streambed hydraulic conductivity, Ksb. Results of the falling-head permeameter tests for five sampling locations in the South Platte River are shown in Table 1. For the case where the permeameter was installed to a depth of 25 cm, the Darcy and Hvorslev equations predicted an average streambed hydraulic conductivity of 143.7 and 168.7 m-d-1, respectively. For an installation depth of 40 cm, the Darcy and Hvorslev equations predicted an average streambed hydraulic conductivity of 64.2 and 71.3 m-d-1, respectively. These results suggest that the deposits deeper than 25 cm below the surface of the streambed limit groundwater/surface water fluxes in the South Platte River. Landon et al. (2001) document similar results for the streambed of the Platte River in eastern Nebraska. The hydraulic conductivity of the sloughbed was also measured using a falling-head permeameter test at three locations adjacent to pumping well R3 (see Figure 1). Data and results for the three backwater slough measurement locations are shown in Table 2 and suggest that a considerable permeability difference (e.g., Ksb<1.0 m-d-1) is present. Streambed materials. Hydrology Days 2003. 72.
(6) Fox. in the slough consist of coarse sands and gravels similar to the South Platte River, but are much more inundated by organic materials that significantly limit the exchange of water between the slough channel and alluvial aquifer. The thickness of this organically restricted layer is approximated to be 50 to 75 cm.. Table 1. Falling-head permeameter tests to quantify the streambed hydraulic conductivity, Ksb (m-d-1), of the South Platte River. Darcy's Equation Hvorslev (1951) Equation Site Location L=25 cm L=40 cm L=25 cm L=40 cm 1 142.8 83.2 167.6 92.3 2 138.1 68.0 162.1 75.4 3 143.6 47.8 168.5 53.1 4 132.4 47.7 155.5 52.9 5 161.6 74.7 189.8 82.8 Average 143.7 64.2 168.7 71.3 Standard Deviation 11.0 16.0 12.9 17.7. Table 2. Falling-head permeameter test for determining the hydraulic conductivity, Ksb (m-d-1), of the sloughbed. Darcy's Equation Hvorslev (1951) Equation Site Location L=25 cm L=25 cm 1 0.1 0.1 2 0.1 0.2 3 0.8 0.9 Average 0.3 0.4 Standard Deviation 0.4 0.4. 4. Stream/Aquifer Analysis Test The use of analytical solutions provides a mechanism for aggregating point measurement variations from in-situ tests into a single estimate more aligned with the input requirements of numerical ground water flow models. Hunt (1999) was the first to suggest that drawdown in one or more observation wells located between a pumping well and stream can be used with analytical solutions that account for streambed conductivity to inversely estimate both aquifer and streambed hydraulic properties. The location and setup for the stream/aquifer analysis test at the Tamarack site is shown in Figure 1. Well R3 was pumped at a constant discharge rate, Q=10,900 m3-d-1 (2000 gpm), for 24 hours on December 6th-. Hydrology Days 2003. 73.
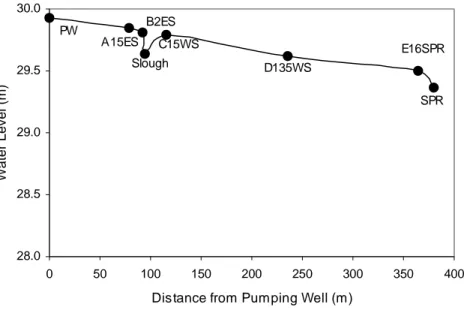
(7) Estimating Streambed and Aquifer Parameters. 7th, 2002. Water levels were measured periodically in the five observation wells depicted in Figure 1: • • • • •. A15ES: located 15 m from the slough on the pumping well side B2ES: located 2 m from the slough on the pumping well side C15WS: located 15 m from the slough on the side of the South Platte River D135WS: located 135 m from the slough on the side of the South Platte River (142 m from the river) E16SPR: located 270 m from the slough on the side of the South Platte River (16 m from the river). Water levels were also measured in the pumping well, in the slough channel, and in the South Platte River. Water level measurements were made using manual water level recorders. Figure 3 shows the initial water levels along a transect from the pumping well, through the slough channel, and to the South Platte River.. 30.0 B2ES. PW. A15ES. 29.5. Water Level (m). C15WS. E16SPR. Slough. D135WS SPR. 29.0. 28.5. 28.0 0. 50. 100. 150. 200. 250. 300. 350. 400. Distance from Pumping Well (m). Figure 3. Transect of initial water level before stream/aquifer analysis test. PW=pumping well and SPR=South Platte River.. Since observation wells A15ES and B2ES are located between the slough and pumping well, these drawdown measurements are used with an analytical solution to estimate the sloughbed hydraulic conductivity. Note that the finite slough width becomes critical in influencing the interaction between the slough channel and the alluvial aquifer since the distance. Hydrology Days 2003. 74.
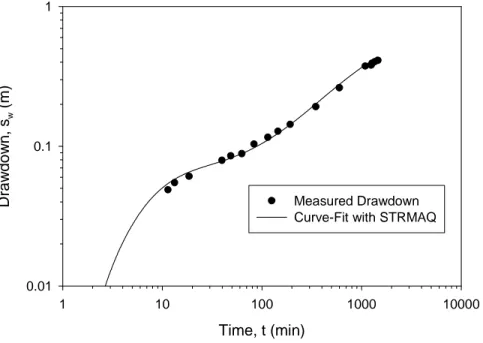
(8) Fox. between the slough and pumping well, L, is 94 m, resulting in an L/W ratio of less than 15. As such, the analytical solutions of Hunt (1999) and the proposed solution, STRMAQ, by Fox and Durnford (2003) are not valid. In order to analyze this data, this research combines the analysis presented by Fox et al. (2002) on finite stream width effects and the STRMAQ package (Fox and Durnford, 2003) to develop a solution capable of addressing the critical slough/aquifer interaction conditions. Predicted drawdown is fit to the observed drawdown curve in observation wells A15ES and B2ES. The following parameter values result in a least squares best match for observation well A15ES: transmissivity, T=3750 m2-d-1; aquifer hydraulic conductivity, K=125 m-d-1; anisotropy ratio, K/Kz=7.8, where Kz is the vertical hydraulic conductivity; specific storage, Ss=2.5 x 10⁻⁴ m-1; specific yield, Sy=0.20; and a streambed hydraulic conductivity, Ksb=0.1 m-d-1. Observed drawdowns and the model-predicted drawdowns for observation well A15ES are shown in Figure 4. For observation well B2ES, the following parameter values result in a least squares best match: T=3900 m2-d1 ; K=130 m-d-1; K/Kz=8.1; Ss=2.7 x 10⁻⁴ m-1; Sy=0.22; and Ksb=0.5 m-d-1. Observed and model predicted drawdowns for B2ES are shown in Figure 5.. Drawdown, sw (m). 1. 0.1. Measured Drawdown Curve-Fit with STRMAQ. 0.01 1. 10. 100. 1000. 10000. Time, t (min) Figure 4. Comparison of measured and predicted drawdown at observation well A15ES.. Note that analytical stream/aquifer solutions during alluvial well depletion assume that the head in the surface water body does not change during the pumping test. During the 24-hour pumping period, the water level in the slough channel declined by less than 0.1 m. Water levels were also. Hydrology Days 2003. 75.
(9) Estimating Streambed and Aquifer Parameters. measured in the South Platte River. Throughout the duration of the pumping test, the water level in the river declined by less than 0.01 m.. Drawdown, sw (m). 1. 0.1. Measured Drawdown Curve-Fit with STRMAQ 0.01 1. 10. 100. 1000. 10000. Time, t (min) Figure 5. Comparison of measured and predicted drawdown at observation well B2ES.. Parameter values for both observation wells agree with reported values of aquifer parameters at the site (Burns, 1985; Hurr and Schneider, 1973) and also with measured streambed conductivity in the slough channel from the falling-head permeameter tests. Several recent aquifer tests have been performed at Tamarack by researchers with the Northern Colorado Water Conservancy District and the Colorado Division of Wildlife. Based on these data sources, the following values are reported for aquifer parameters, which match the parameter values obtained from the stream/aquifer analysis tests: T=1000 to 4500 m2-d-1 with an average of 2800 m2-d-1, K=60 to 200 md-1 with an average of 130 m-d-1, K/Kz=10, and Sy=0.12-0.30 with an average of 0.15. Even though not used to estimate the conductivity of the sloughbed, the observation wells located between the slough and South Platte River provide information about the degree of surface water/groundwater interaction at Tamarack. The water level response in observation well C15WS, located 15 m from the slough on the opposite side from the pumping well, indicates that some percentage of the aquifer stress is being satisfied by flow from the aquifer on the non-pumping side of the slough channel. Water. Hydrology Days 2003. 76.
(10) Fox. levels in observation well D135WS, located 135 m from the slough on the side opposite of the pumping well, decline by approximately 0.1 m during the 24-hour period. Water levels in observation well E16SPR decline by less than 0.01 m suggesting that the pumping well does not influence the South Platte River during the first 24-hours of pumping. However, continued and/or more intense pumping could deplete both the slough channel and South Platte River. The water level transect from the pumping well, through the slough channel, and to the South Platte River at the end of the stream/aquifer analysis test is shown in Figure 6. The initial water level along this same transect (as presented in Figure 3) is also shown to depict the influence of the pumping well on the slough/river/aquifer interaction. Groundwater abstraction creates a significantly different water level profile, converting the slough channel from a groundwater discharge zone to a recharge zone during pumping. The influence of the pumping well extends beyond the slough. At the end of the test, the influence of the pumping well is beginning to reach the South Platte River and it is expected that continued pumping would eventually result in significant depletion at the river.. 30.0 B2ES C15WS. A15ES. D135WS E16SPR. Slough. 29.5. Water Level (m). A15ES. C15WS B2ES. D135WS. E16SPR SPR. 29.0. Initial Water Level 28.5. Water Level at End of Test. 28.0 0. 100. 200. 300. 400. Distance from Pumping Well (m). Figure 6. Transects of the initial and final water levels near pumping well R3. SPR=South Platte River.. Hydrology Days 2003. 77.
(11) Estimating Streambed and Aquifer Parameters. 5. Summary and Conclusions A stream/aquifer analysis test (i.e., pumping test next to the slough and stream) is performed at the Tamarack site. Recently proposed analytical solutions suggest that streambed conductivity can be inversely estimated by matching the observed drawdown response in one or more observation wells to analytical predictions of drawdown. Drawdown is measured over a 24hour period in five observation wells: two observation wells are located within the 94 m between the slough and pumping well and three observation wells are located in the 286 m between the slough and South Platte River. Predicted drawdown is individually matched to the observed drawdown in the two observation wells between the pumping well and slough channel. Falling-head permeameter tests are performed to estimate the hydraulic conductivity of the streambed and sloughbed. Falling-head permeameter tests estimate the hydraulic conductivity of the riverbed to be approximately 150 m-d-1 in the upper 25 cm and approximately 70 m-d-1 in the upper 40 cm. The hydraulic conductivity of the bed materials in the slough is much less due to the presence of organic materials that clog the pore spaces of the coarse sand grains. Falling-head permeameter tests estimate the sloughbed conductivity to range between approximately 0.1 to 1.0 m-d-1. Estimates of critical aquifer and streambed parameters from the stream/aquifer analysis test match reported aquifer parameter values from other aquifer tests performed at the site and the measured conductivity from the permeameter tests. Acknowledgements. The author acknowledges the financial support of the USDA National Needs Fellowship Program, Grant No. 00-38420-8825, for supporting this research. The author also acknowledges guidance provided by Deanna Durnford, Bill Sanford, Jorge Ramirez, and Luis Garcia. The author acknowledges Jon Altenhofen of the Northern Colorado Water Conservancy District for assisting in the design and operation of the field test and Amanda Fox for assistance in collecting the field data.. 6. References Burns, A.W. 1985. Hydrologic description of the Tamarack Wildlife area and vicinity, Logan County, Colorado. U.S. Geological Survey Water Resources Investigations Report 84-4010: Denver, Colorado. Butler, J.J., V.A. Zlotnik, and M.S. Tsou. 2001. Drawdown and stream depletion produced by pumping in the vicinity of a partially penetrating stream. Ground Water 39(5): 651-659. Calver, A. 2001. Riverbed permeabilities: Information from pooled data. Ground Water 39(4): 546-553. Fox, G.A. and D.S. Durnford. 2003. STRMAQ: Semi-analytical model for stream/aquifer interaction in confined/unconfined aquifers. Ground Water (In Review). Hydrology Days 2003. 78.
(12) Fox. Fox, G.A., P. DuChateau, and D.S. Durnford. 2002. Analytical model for aquifer response incorporating distributed pumping-induced stream leakage. Ground Water 40(4): 378-384. Hunt, B. 1999. Unsteady stream depletion from ground water pumping. Ground Water 37(1): 98-102. Hunt, B., J. Weir, and B. Clausen. 2001. A stream depletion field experiment. Ground Water 39(2): 283-289. Hurr, R.T. and P.A. Schneider. 1973. Hydrogeologic characteristics of the valley-fill aquifer in the Julesburg Reach of the South Platte River valley, Colorado. U.S. Geological Survey Open-File Report 73-125: Denver, Colorado. Hvorslev, M.J. 1951. Time lag and soil permeability in groundwater observations. U.S. Army Waterways Experiment Station Bulletin 36: Vicksburg, Mississippi. Landon, M.K., D.L. Rus, and F.E. Harvey. 2001. Comparison of instream methods for measuring hydraulic conductivity in sandy streambeds. Ground Water 39(6): 870-885. Nyholm, T. and S. Christensen. 2000. Stream-flow depletion in a small alluvial stream caused by groundwater abstraction from wells. In “Stream-flow depletion caused by groundwater abstraction near alluvial streams,” Ph.D. Thesis, University of Aarhus, Denmark. Nyholm, T., S. Christensen, and K.R. Rasmussen. 2002. Flow depletion in a small stream caused by ground water abstraction from wells. Ground Water 40(4): 425-437. Sophocleous, M., A. Koussis, J.L. Martin, and S.P. Perkins. 1995. Evaluation of simplified stream-aquifer depletion models for water rights administration. Ground Water 33(4): 579-588.. Hydrology Days 2003. 79.
(13)
Figure

+4


Related documents
Under such scenario, it is clear that, if points below the red line are solely compared with the large-scale streamflow derived T, the average T estimates of the small-scale pump
In addition, Scientific Applications, which generally deal with large tuple sizes, might not suit the Apache Storm design due to an additional latency caused by data
The main findings reported in this thesis are (i) the personality trait extroversion has a U- shaped relationship with conformity propensity – low and high scores on this trait
Såväl det kvantitativa som det kvalitativa resultatet visar också att lärare i hög grad upplever att deras elever får ta ett större ansvar när undervisningen har gått över till
Nacka Kommun med ERP‐system för administrativa uppgifter samt separata IT‐ system för övriga verksamheten. Intrum Justitia AB med arvsystem
Även om Kaisa beskriver en fundersamhet och/eller oro över att barnen kan ha vissa problem så hävdar hon ändå att hon förstår den svårighet som uppstår för asylbarnen när
Ett ökande problem i dagens samhälle är det minskade antalet slutenvårdsplatser för patienter som behöver psykiatrisk vård. Detta medför att fler och fler
The chemical composition of the S1. Kevin Gulch floc and Shingle Mill Gulch sediment, as determined by ICP-AES, is shown in table B~. Fe is the predominant metal in St. Kevin
