Review of the 2003 water year in Colorado, A
12
0
0
Full text
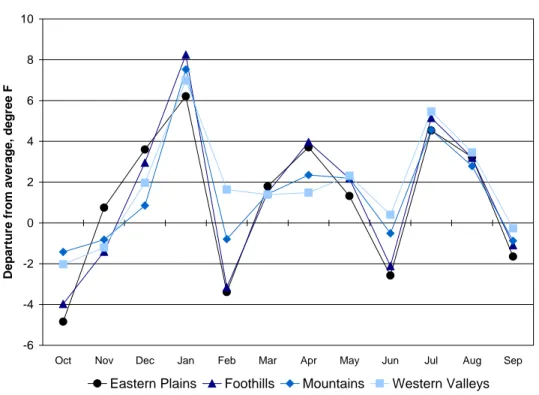
(2) Doesken and Gillespie. 2. Meteorological Description of the 2003 Water Year The 2003 water year (WY2003) refers to the period of twelve consecutive months beginning October 1, 2002 and ending September 30, 2003. It encompasses the winter snow accumulation season and, the spring green-up and snowmelt season, and it ends at the conclusion of the summer growing season (and irrigation season). As WY2003 began, Colorado was reeling from the driest individual year in recorded history. All areas of the state, both the eastern plains, the high mountains, and the western Slope had been impacted severely. Precipitation totals for WY2002 were the lowest on record for many of Colorado’s long-term weather stations, and streamflow volumes were typically only about 25% of average on most major rivers and streams. Rivers were flowing at only a trickle, reservoir levels were critically low, and soils were parched as WY2002 came to an end. Colorado was just ending the worst forest fire season in modern history. While blowing soils were not a bit problem, many of Colorado’s old timers described WY2002 as “worse than the 1930s dustbowl and the 1950s severe drought.” While almost every month during WY2002 was very dry, the year ended on a wetter note. Beginning in late August, many thunderstorms rumbled across the plains, and September was a wet month for much of the state. As WY2003 began, most of the western U.S. including the western Great Plains, were also suffering from drought. The El Nino Southern Oscillation (ENSO) in the tropical Pacific Ocean has been found to relate well at times to current and future temperature and precipitation patterns over wide areas of the globe including portions of Colorado and the western U.S. A very weak warm phase of ENSO had developed going into the fall of 2002. However, this warm phase did not blossom into a full “El Nino” but instead vascillated, leaving climatologists uncertain about the long-range forecast and the likelihood of significant drought recovery. It was an improved situation from the “la Nina” (cold phase of ENSO) that had developed in 1999 and had most likely helped trigger the onset of drought 2000–2002. Correlations of ENSO with Colorado historic precipitation patterns hinted that Colorado may have another dry winter but that conditions might improve during the spring of 2003.. 3. Temperature Patterns During the 2003 Water Year We often emphasize precipitation patterns and snow accumulation as we describe climatic conditions affecting Colorado’s hydrology and water supplies. However, temperatures, while much less variable than precipitation, are also very important. Snow melt, evaporation rates, urban, agricultural and forest water demands, are all affected by temperature. Figure 1 shows regionally averaged temperature departures from average on a month-bymonth basis for WY2003.. 262.
(3) A review of the 2003 Water Year in Colorado. Water Year 2003 10. Departure from average, degree F. 8 6 4 2 0 -2 -4 -6 Oct. Nov. Dec. Jan. Eastern Plains. Feb. Mar. Foothills. Apr. May. Mountains. Jun. Jul. Aug. Sep. Western Valleys. Figure 1. Regionally averaged monthly temperature departures from the 1971-2000 averages, October 2002 through September 2003, for Colorado’s Eastern Plains, the Front Range foothills and adjacent plains corridor, the Colorado mountainous region, and the western valleys and plateau region (Western Slope). Above average temperatures (with respect to the 1971-2000 base period) have been common in recent years here in Colorado and in other parts of the Southwest. WY2003 got off to a cold start in October, but conditions quickly reverted to warmer than average in midwinter. January 2003 was one of the warmest on record for many parts of Colorado. Cold continental air did reach into eastern Colorado in February with some areas more than four degrees F below average for the month. March, April and May were again warmer than average statewide, but not extreme. June was chilly with persistent cool, damp air over the state helping reduce evaporation rates and irrigation water demands as the mountain snowpack finished melting. This was extremely beneficial for water managers and allowed more of the spring runoff to be retained in storage reservoirs. This weather pattern was also excellent for reducing the fire danger in Colorado’s forests. Beginning on July 1, however, hot weather returned. Both July and August were much hotter than average and some weather stations reported their hottest July in recorded history.. 4. Precipitation After a wet September statewide, October 2002 started WY2003 off to a good start with another wetter than average month. Mountain precipitation was as much as 160% of average. In eastern Colorado, much of the prime 263.
(4) Doesken and Gillespie. winter wheat growing areas received more than double the average. While this moisture did not replenish deep soil moisture, it was sufficient to help the young wheat plants to germinate and get established. November brought snow to Colorado’s central mountains and helped Colorado’s winter recreation industry get off to a decent start. Weather patterns then shifted and mid winter was very dry statewide. Large areas of the state had less than half the average precipitation for those months, and some areas east of the mountains had no snow cover in either December or January. February brought colder and snowier weather to the state with portions of extreme southwest Colorado, the northern Mountains and portions of the eastern slope getting double the average February moisture. Coloradoans, especially those who live, work and use water from the Arkansas and South Platte basins, have always known the importance of spring precipitation for both restoring soil moisture and adding to the mountain snowpack. Just a handful of large spring storms often can mean the difference between a critically dry year and having sufficient moisture. The lack of heavy spring storms in 2002 quickly put Colorado into severe drought. In 2003, Colorado got lucky, especially the South Platte basin. A remarkable March snowstorm began on the 17th and did not leave the state until the 20th. Snowfall totals of 3-6 feet were common along the Northern Front Range from this much-needed storm. Even more importantly, the snow was very wet, bringing 3-5 inches of water to the cities of the Front Range urban corridor and up to 8” of water to some foothills and Continental Divide areas. This was one of the heaviest storms of recorded history for the foothills and mountains of the South Platte basin. It could not have come at a better time or in a better way (wet snow) to help bring relief from drought. April also brought beneficial heavy precipitation but only to north-central and northeastern portion of the state. For the drought stricken southwestern mountains of Colorado, dry and warm April weather meant early snowmelt and increased evaporation. October through April precipitation (Figure 2) ended up above average for Colorado’s north central mountains and the Front Range as well as portions of the eastern plains including much of Colorado’s winter wheat belt. Drier than average conditions persisted over southwest and extreme western Colorado. May got off to a good start with some widespread storms, but not all areas benefited. West central and some of eastern Colorado ended up wetter than average for the month, but many other areas of the state were dry. June was cool and wet east of the mountains which really helped lower irrigation demand and helped range and pasture conditions to improve. Southwestern Colorado, however, was very dry. Beginning in early June, hot dry air covered the entire state and most of July was much drier than average. Some localized storms dropped heavy rains in a few locations in the mountains. August was also hot and very dry, especially over southeastern Colorado. Extreme drought again gripped areas of the Arkansas Valley. Meanwhile, thunderstorms developed each day in the mountains. August precipitation exceeded 200% of average from Vail to Grand Lake. Very heavy rains late in the month also soaked the northern Front Range. Finally, as WY2003 came to 264.
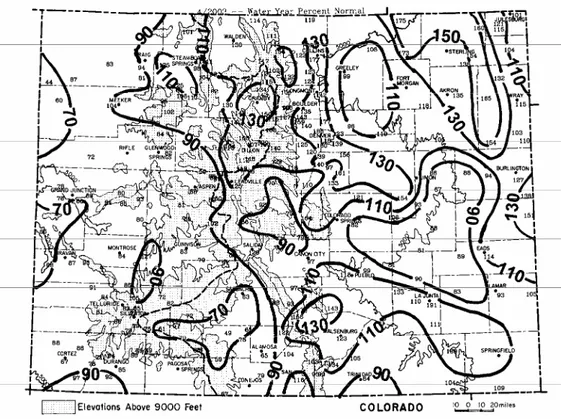
(5) A review of the 2003 Water Year in Colorado. an end, beneficial moisture, in excess of 150% of average in some locations, moistened the southern and central mountains of Colorado and the lower valleys. Meanwhile, very dry conditions expanded east of the mountains.. Figure 2. Colorado accumulated precipitation for winter 2003, October 2002 through April 2003, as a percent of the 1971-2000 average. Growing season precipitation (Figure 3) was below average over much of Colorado with the driest areas found in the Arkansas River Valley, Jefferson and Douglas County, and extreme northwest Colorado. These areas received less than 70% of the average growing season precipitation. Local wet spots were scattered across the state, but widespread near to above average summer precipitation fell over much of the higher mountain areas in west central Colorado including Gunnison, Aspen, Dillon, Vail and Winter Park. For WY2003 as a whole (Figure 4), it was definitely a better year than 2002 in terms of statewide precipitation. Precipitation was not sufficient, however, to make up for lingering deficits. The only areas of the state that ended the year with 110% of average or more were portions of the upper Colorado River basin in Eagle, Summit and Grand Counties, the Front Range north of Denver hit so hard by the March snowstorm, and a few pockets of good moisture out on the plains. For most of the state, 2003 was another dry year with most of southern and western Colorado running about 80% of average with a few areas in the Arkansas and Rio Grande basins with less than 70% of the average precipitation for the second year in a row. Colorado is clearly in the grips of a long-term widespread drought that will require several wet seasons and perhaps several wet years to fully recover from. 265.
(6) Doesken and Gillespie. Figure 3. Colorado May through September 2003 growing season precipitation totals as a percent of the 1921-2000 average.. Figure 4. Water-year precipitation, October 2002 through September 2003 as a percent of the 1971 – 2000 average.. 266.
(7) A review of the 2003 Water Year in Colorado. 5. Snowpack Accumulation 2003 snowpack conditions improved markedly from 2002. Nevertheless, this was the 6th consecutive year with below average snowpack accumulation in Colorado. Significant snows fell early in Colorado’s central and northern mountains, but then the entire state suffered through a prolonged period of dry weather in midwinter. Statewide snowpack dropped to only 71% of average by February 1 (Figure 5) but recovered to 94% of average by April 1. COLORADO SNOWPACK Summary for 2003 USDA Natural Resources Conservation Service JANUARY. FEBRUARY. MARCH. APRIL. MAY. JUNE. 120 110 100. % OF AVERAGE. 90 80 70 60 50 40 30 20 10 0 Gunnison. Colorado. S. Platte. N. Platte. Yampa-White. Arkansas. Rio Grande. San Juan*. State. *Includes Animas, Dolores, San Miguel Basins. Figure 5. 2003 monthly progression of snowpack for major watersheds in Colorado as a percent of the 1971-2000 averages. Figure 6 shows daily accumulations of snow water equivalent at three selected locations in Colorado. The midwinter drought was most pronounced in southern Colorado as noted on the graph for Wolf Creek Summit. Snows increased in February throughout the state, but ended for a time in March. Then came the March 17-20th snowstorm. The Berthoud Summit SNOTEL showed this storm very well. For the Front Range, this single storm accounted for ¼ to 1/3 of the moisture for the entire winter. The northern mountains continued to see more spring snow accumulation. By early May, snowpack had exceeded the long-term averages in both the upper Colorado, the North Platte and the South Platte basins. The Arkansas basin was also near average. Unfortunately, the story was not so good for southern Colorado where late season snowfall was very limited. May 1 snow water equivalent readings in the Rio Grande, San Juan, Dolores and Animas basins were only a little above 50% of average. Throughout the state, snow melted quickly in May and by June 1 the remaining statewide snow water equivalent was only 32% of average with almost all of southern Colorado’s snow melted. 267.
(8) Doesken and Gillespie 60 SNOW WATER EQUIV.. PRECIPITATION. AVERAGE PRECIP.. AVERAGE SWE. 50. Inches of Water. Joe Wright SNOTEL 40. 30. 20. Water Year 2003. 10. 0 OCT. NOV. DEC. JAN. FEB. MAR. APR. MAY. JUN. JUL. AUG. SEP. 40 SNOW WATER EQUIV.. PRECIPITATION. AVERAGE SWE. AVERAGE PRECIP.. 35. Inches of Water. 30. Mesa Lakes SNOTEL. 25 20 15. Water Year 2003 10 5 0 OCT. NOV. DEC. JAN. FEB. MAR. APR. MAY. JUN. JUL. AUG. SEP. 30 PRECIPITATION. SNOW WATER EQUIV.. AVERAGE PRECIP.. AVERAGE SWE. 25. Inches of Water. Slumgullion SNOTEL 20. 15. Water Year 2003 10. 5. 0 OCT. NOV. DEC. JAN. FEB. MAR. APR. MAY. JUN. JUL. AUG. SEP. Figure 6. Daily precipitation (heavy solid line) and snowpack water equivalent (dotted line) for the 2003 water year and comparisons to average for Joe Wright SNOTEL (north), Mesa Lakes SNOTEL (central), and Slumgullion SNOTEL (south).. 268.
(9) A review of the 2003 Water Year in Colorado 3500. Cache La Poudre River at Mouth of Canyon 3000. Discharge, (1000 CFS). 2003 Discharge. Mean Discharge. 2500. 2000. 1500. 1000. 500. 0 OCT. NOV. DEC. JAN. FEB. MAR. APR. MAY. JUN. JUL. AUG. SEP. MAY. JUN. JUL. AUG. SEP. MAY. JUN. JUL. AUG. SEP. 12000. Colorado River near Dotsero, CO 2003 Discharge. Discharge (1000 CFS). 10000. Mean Discharge. 8000. 6000. 4000. 2000. 0 OCT. NOV. DEC. JAN. FEB. MAR. APR. 5000 4500. Animas River at Durango, CO 2003 Discharge. Mean Discharge. Discharge, (1000 CFS). 4000 3500 3000 2500 2000 1500 1000 500 0 OCT. NOV. DEC. JAN. FEB. MAR. APR. Figure 7. Daily streamflow discharge in cubic feet per second during the 2003 water year and period of record averages from USGS gauging stations on the Cache La Poudre River (top), the Colorado River near Dotsero (middle) and the Animas River at Durango (bottom).. 269.
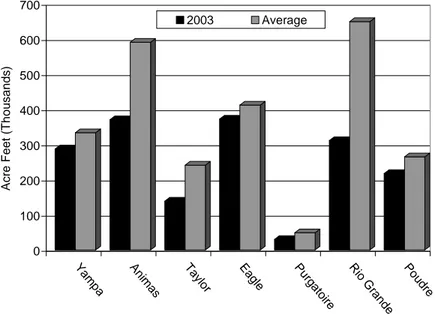
(10) Doesken and Gillespie. 6. Runoff and Streamflow Streamflow represents the integration of each year’s complex and unique combinations of temperature, precipitation, snow accumulation, evaporation and sublimation. It also is influenced by previous years’ weather that affects long-term base flows. Figure 7 (above) shows daily discharges for selected basins in northern, central and southern Colorado. Flows on the Poudre River in northern Colorado recovered nicely from the 2002 drought with a fairly typical snowmelt peak in late May (a little earlier than normal) and fairly typical flows throughout the summer. The white water rafting industry was delighted to see this improvement. The picture was not quite so good on the Colorado River where prolonged dry conditions are greatly limiting base flows. Despite an excellent peak runoff period, discharges dropped quickly, and June through August volume flow was well below average. Late season widespread heavy rains in the upper basin improved flows late in the season. The Animas River in southwestern Colorado also showed a fairly typical snowmelt peak followed by an extremely rapid return to baseflow conditions by later July. A very heavy and widespread rain event in early September contributed to a large surge in September flow. Southwestern Colorado is prone to fall storms associated with tropical storms over the Pacific, and this was an excellent example. Seasonal streamflows for selected watersheds are shown in Figure 8 with respect to long-term average flows. Due in part to the effects on longterm drought on base flows and diversions, all rivers still showed below average flows for 2003. Northern Colorado rivers fared best as well as rivers draining the eastern slope of the Rockies. WY2003 total volume streamflows were far below average in southwestern Colorado where some rivers such as the Rio Grande only yielded about 50% of average. 700 2003. Average. Acre Feet (Thousands). 600 500 400 300 200 100 0 Po nd ra e. e oir. re ud. G. at rg. r. as. gle. o Ri. Pu. Ea. im. pa m. y lo Ta. An. Ya. Figure 8. 2003 water year streamflow volumes in thousands of acre-feet compared to period-of-record averages for selected rivers in Colorado.. 270.
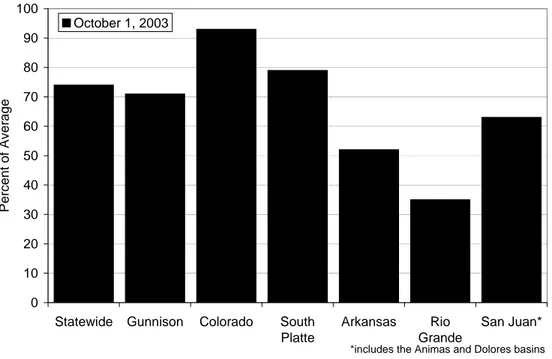
(11) A review of the 2003 Water Year in Colorado. 7. Water Supplies and Reservoir Storage Colorado ended the 2002 water year with reservoir storage volumes at just 48% of average – the lowest levels since many of the states large reservoir and delivery systems were built. With the help of a better precipitation in 2003, and with very dedicated water conservation efforts, Colorado ended the 2003 water year with reservoirs holding 74% if average on October 1, 2003 (Figure 9). While still far below the long-term average and even farther below the typical levels of the 1980s and 1990s, this was still a significant improvement considering that snowpack and precipitation were not exceptionally great. Dillon Reservoir, a critical component of Denver Water Department’s water storage and delivery system improved greatly as did Lake Granby, the cornerstone of the Colorado Big Thompson project. 100 October 1, 2003 90. Percent of Average. 80 70 60 50 40 30 20 10 0 Statewide. Gunnison. Colorado. South Platte. Arkansas. Rio Grande. San Juan*. *includes the Animas and Dolores basins. Figure 9. Reservoir storage at the end of the 2003 water year as a percent of average for each major watershed in Colorado.. 8. Conclusions and Historical Perspective The impacts of drought from the record-breaking WY2002 continued to linger into 2003. WY2003 was again dominated by warmer than average temperatures but with occasional cool interludes. Precipitation for the state as a whole was slightly below average but with considerable local variations (as usual). The nature of the hydroclimate of a semiarid region was demonstrated in grand form in WY2003 as a single snowstorm in mid March delivered prolific drought-breaking precipitation to parts of Colorado. Areas hit by the storm made considerable progress in recovery from the extreme drought of 2002 while areas of southern Colorado not so affected by the storm remained in drought. Mid summer was extremely hot statewide, bringing a return to drought stress. Heavy September rains in western Colorado caused some. 271.
(12) Doesken and Gillespie. local flooding and produced significant runoff contributing to higher reservoir levels in some areas. This was the sixth consecutive year with below average snowpack on April 1st – a key date for water resource planning and management decisions. Peak runoff occurred earlier than average on most of Colorado’s major rivers. Thanks in part to bold water conservation efforts both in agriculture and in urban areas, overall surface water supplies improved in 2003. Despite mediocre streamflows, reservoir levels improved significantly. Each time Colorado has experienced severe and widespread drought since the late 1800s, society has responded with bold and aggressive actions to help lesson the impacts of future droughts. Drought has again stirred the water management pot here in Colorado and it will be very interesting to look back 50 years from now and see how we responded. Acknowledgments. Colorado Climate Center, Department of Atmospheric Science, College of Engineering, is funded by the Colorado Agricultural Experiment Station.. 272.
(13)
Figure


+5


Related documents
”Aller Realitet Quelle ist das
Frågor som intresserat och engagerat mig är vad det innebär för Pontus och andra unga människor att bli utredda i en institutionsmiljö, hur utredningarna bidrar
39 The reports regarding transfer pricing published by the OECD can therefore be assumed to have a substantial international value as source of interpretation unless the
Detta är något som även respondent D uppfattar, respondenten anser att organisationen bör arbeta mer aktivt kring att synliggöra organisationen som arbetsgivare externt,
Det framkommer att barns kroppsliga integritet ska respekteras och deras arbete ska syfta till att göra barn medvetna om rätten till sin egen kropp.. Det framgår att
For a long period, the VTI (Swedish National Road and Transport Research Institute) has been working on the development of wear resistant asphalt pavements and equipment/methods
De främsta förutsättningarna för lärande finns därför, enligt Dysthe (1996) i ett dialogiskt klassrum där eleverna får uttrycka sina tankar och idéer i kommuni-
The aim of this study was to describe and explore potential consequences for health-related quality of life, well-being and activity level, of having a certified service or
