Ft. Collins, Colorado, USA, 7-9 September 2016 Protections 2016
2nd International Seminar on Dam Protection Against Overtopping ISBN: 978-1-1889143-27-9 DOI:
Advances in the Understanding of the Hydraulic Behavior of Wedge-Shape
Block Spillways
F. J. Caballero
1, M. Á. Toledo
1, R. Morán
1,2, J. San Mauro
2and F. Salazar
21
Dam Safety Research Group (SERPA), Technical University of Madrid (UPM)
Escuela de Caminos, Canales y Puertos
Calle Profesor Aranguren, s/n, 28040 Madrid
Spain
2
International Center for Numerical Methods in Engineering (CIMNE)
Technical University of Catalonia Barcelona Tech
Campus Norte UPC, 08034 Barcelona
Spain
E-mail: jcaballero@caminos.upm.es
ABSTRACTThe technology of wedge shaped blocks (WSB) for spillways has had a rising development through the last forty years, and has proved its reliability for practical applications with spillways executed during the last decade. Ongoing additional research aims to complete the understanding of the hydraulic behavior, improve current design criteria and make this technology available to practitioners, in order to consider this type of spillway together with the conventional alternatives when designing an embankment dam spillway. A summary is here shown of recent research performed by the consortium formed by the research organizations: Research Group in Dam Safety (SERPA) of the Technical University of Madrid (UPM) and the International Center for Numerical Methods in Engineering (CIMNE) and the company PREHORQUISA. Even though the experimental campaign has not been completed, some preliminary conclusions can be addressed about the developed pressures along the block tread and the leakage flow from the joints among blocks and the drainage holes.
Keywords: Wedge-shape block, WSB protections, overtopping, embankment dam, pressure, drainage flow.
1. INTRODUCTION
The original concept of dam protections against overtopping by overlapping concrete blocks placed on the downstream shell of embankment dams arose from the work carried out by P.I. Gordienko, from Moscow Institute of Civil Engineering in the late 1960’s (Hewlett et al., 1997). Professor Y. Pravdivets took up the first concepts by Gordienko and continued the research with Grinchuk (1977) and Slissky (1981). The research progressed along the next decades by Baker, Hewlett et al. (1994-1997), Clopper (1989), Slovensky (1993), Gaston (1995), Frizell (2000-2007), and Thornton el al. (2006). From these experiences the first design guide for wedge shaped block spillways was published (Hewlett et al., 1997), and a US patent for the WSB tested at the Colorado State University (ArmorwedgeTM), held by the company Contech, Inc. In 2007, Barriga Dam in Spain (Morán and Toledo, 2014) was the first dam having a service spillway of wedge shaped blocks using the ArmorWedgeTM articulated concrete block system. Later on, Bruton Dam (Pether, Marsh, and Cartwright, 2009) and Ogden Dam (Booth, 2012 and Thomson, 2014) followed with auxiliary spillways made up of wedge-shape blocks. Norton-Fitzwarren dam (Morton et al, 2008) was built in United Kingdom and also Friendship Village auxiliary spillway in Missouri, USA (FEMA, 2014).
In the last decade, Relvas and Pinheiro (2008-2011) from the University of Lisbon in Portugal have deepened theoretical aspects of the hydraulic behavior of WSB technology. In the most recent years, SERPA, of the UPM, CIMNE and PREHORQUISA, in Spain, are complementing the theoretical and practical knowledge of WSB technology (Caballero et al, 2014).
2. EXPERIMENTAL SET UP
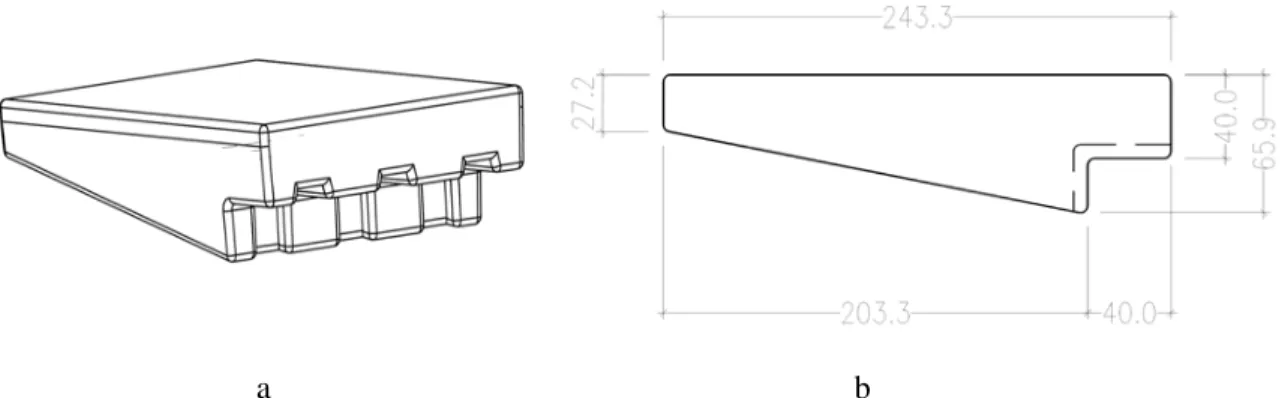
The experimental set up includes a 0.50 m wide steel and methacrylate testing channel constructed on a 2H:1V slope, which provides a 4.7 m vertical drop (Figure 1a). Walls are 0.85 m high, measured normal to the base. A maximum unit discharge of 0.24 m2/s is available. Water is delivered to the channel head from an upper metallic tank with a horizontal section 2.5x2.5 m2. From Caballero et al (2014): "A non-slip metallic grid allows the wedge shaped blocks to stand 0.2 m over the channel bottom (Figure 1b). The purpose of this grid is to collect and measure the flow that seeps down freely between the lateral faces and drainage holes of the WSBs. This seepage flow is collected at the end of the chute through a tube that flows over a triangular weir and then returns to the lower tank.
At the downstream end of the test channel, the flow enters into a stilling basin that reduces water velocity and allows the control of the water discharge through a rectangular weir before returning to the lower tank to be pumped again to the upper tank".
a b
Figure 1: Experimental facility up at CEDEX hydraulic laboratory (Madrid).
a
b
Figure 2: Wedge-shape block tested: (a) 3d view; (b) longitudinal section (sizes in mm). Block width: 165 mm Also from Caballero et al (2014): "The test set up includes measuring devices that can be grouped into four main categories:
• Measuring devices for water levels and flows:
- Electromagnetic flow meter for pumped flow measurement.
- Triangular sharp crested weir to measure the flow that seeps through the open joints between blocks and drainage holes.
- Electromagnetic limnimeters (4), for measuring the water level in the upper feeding tank, at the beginning of the test channel, on the aforementioned sharp crested weir, and on the final rectangular weir.
• Pressure measurement system, formed by a set of 12 Messtech submersible pressure transducers XA-700, installed in the methacrylate measuring block, and a Scanivalve DSA3207 Corp. model sockets 16 with piezometers installed on another instrumented block. Both types of measuring devices are used to register the water pressures at several points on the footprint, base and the rise step of the WSBs.
• Fiberglass probe and equipment for two-phase flow local measurements. The probe measures the concentration of air bubbles in the water-air two-phase flow, and to determine the depth of the flow according to a specified criterion.
The data acquisition is performed by means of a data collection equipment (cDAQ) made by National Instruments. A conventional video camera is used for recording the tests."
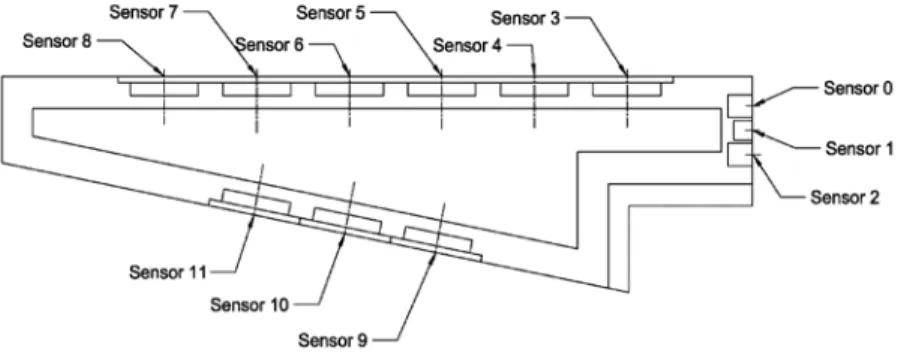
"Two methacrylate wedge shaped blocks were designed to measure pressures on the blocks. Pressure sensors were placed on the block faces (Figure 3). Data acquisition occurs in a time interval of 5 minutes per tested flow". More details can be found in abovementioned reference (Caballero et al, 2014).
The facility has 47 rows of wedge shape blocks. The methacrylate measuring blocks have been installed on the rows 5, 10, 15, 25, 30 and 35. This paper shows some results of pressure records on the row 25 which is located approximately 2.5 meters of vertical drop from the spillway crest.
The leakage flow that seeps down through the joints between blocks and the drainage ports of the blocks was measured using a triangular weir. Data acquisition takes 5 minutes per tested flow rate. The maximum unit discharge tested was 0.24 m2/s, with a corresponding critical depth of 0.11 m at the top of the channel (Table 1). In order to compare the results of different authors, they were expressed in a dimensionless way, following the criteria from Relvas and Pinheiro (2011).
Figure 3: Location of pressure sensors in a measuring wedge shaped block. Source: Caballero et al (2014)
Table 1 : Tested flow rates; hc is the flume critical depth; hs is the height of riser of the steps (see figure 4); q is the
unit discharge.
h
´=h
c/h
s4.51 3.99 3.44 2.84 2.52 2.17 1.37
q (m
2/s) 0.24 0.20 0.16 0.12 0.10 0.08 0.04
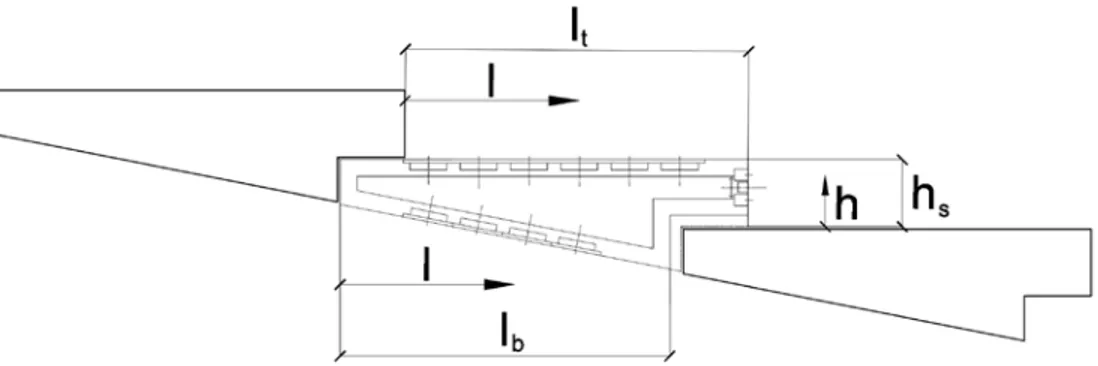
Figure 4: Geometric parameters of the block
3. HYDRODYNAMIC PRESSURE
3.1. Background
Pressures on the blocks were first measured by Bramley and Baker (1989), later by the US Bureau of Reclamation and Colorado State University in the United States (Slovensky 1993), and recently by Relvas and Pinheiro (2008-2011) from the University of Lisbon in Portugal. All of them measured pressures on the tread of the blocks. Bramley and Baker (1989) and Slovensky (1993) also measured pressure on the riser; and finally Bramley and Baker (1989) and Relvas and Pinheiro (2011) measured pressures on the backside (lower face) of the block.
The limit between negative and positive pressures on the tread was obtained from 30% to 40% of the tread length (lt)
(see figure 4) by all the researchers, with the exception of Slovensky, that locates that limit around 50% of lt for a rate
hc/hs (h´) of 2.98.The maximum positive pressure was obtained, in all cases, around 60% of lt. Slovensky (1993) cites
two exceptions for that location of the point with maximum positive pressure. Such exceptions were obtained for low flow rates and for the first steps in the testing channel.
Relvas and Pinheiro (2011) present a comparison between the pressures measured by them and by the rest of researchers on the tread in a uniform flow regime situation. Their graphs show rather good agreement.
On the bottom side of the block, the one in contact with the drain material, pressures were measured by Bramley and Baker (1989), and Relvas (2008). Bramley and Baker registered negative values, while Relvas and Pinheiro (2011) measured low pressures, close to zero. Slovensky (1993) measured the pressure in the drain layer (6 inches; 15cm approximately) under the blocks. However, the location was not on the bottom face of the blocks. Nevertheless, the cited researchers apparently were not intending to check an assumed suction on the backside of the block rather than trying to characterize the flow through the drain layer.
Finally, pressures were measured on the riser of the block by Bramley and Baker (1989) and Slovensky (1993). However, neither of them presented the results obtained as a pattern of pressures along the riser.
3.2. Results
Pressure records on the backside and riser of the block were negative (suction). The sign of the pressure registered on the tread was variable: sensors 7 and 8 (Figure 3) measured negative pressures; sensors 3, 4 and 5 measured positive pressures; and pressures fluctuated between negative and positive at sensor 6.
3.2.1. Pressures on the block tread
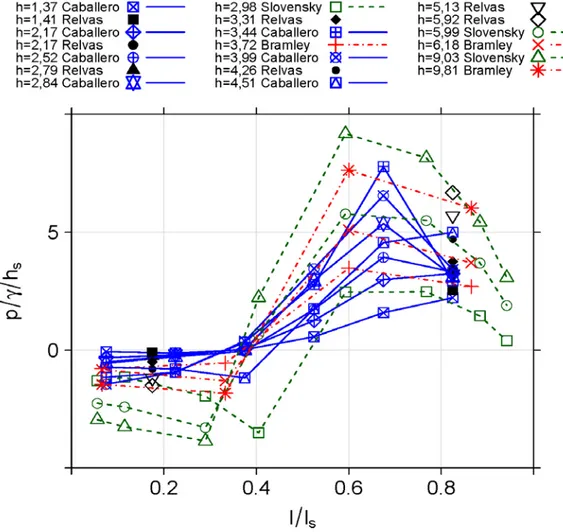
In order to compare the pressure records with the ones registered by different authors, results were expressed in a dimensionless way, following criteria from Relvas and Pinheiro (2011). Figure 5 shows the mean pressures at the sensors located on the block tread at row 25 for unit discharges from 0.04 to 0.24 m2/s, and also those reported by Bramley and Baker (1989), Slovensky (1993) and Relvas and Pinheiro (2011) for a uniform flow regime. The tread length (l) is referred to the unit length (lt) (see figure 4); to obtain the dimensionless parameter (l/lt), where l is the
distance measured from the upstream end of the exposed tread and lt is the total length of the exposed tread. Similarly,
the pressure head (p/γ) is referred to the riser height of the block (hs) to get the dimensionless parameter (p/γ/hs).
Registered pressure heads agreed with conclusions of Slovensky (1993): a) the boundary between negative and positive pressures in the tread of the block was located between 30% and 40% of the tread length; b) the maximum positive pressure heads were registered systematically between 52% and 67% of the tread length.
Figure 5: Mean pressures on the tread of the block at row 25 for unit discharges from 0.04 to 0.24 m2/s (Caballero et al), and those reported by different authors (h´= h
c/hs)
3.2.2. Pressures on the backside of the block
The experimental set up shows a difference related to that used by other researchers: a non-slip metallic grid allows the wedge shaped blocks to stand 0.2 m over the channel bottom (Figure 1b). Therefore, the blocks are not supported on a granular drainage layer that could become saturated, and drainage of the leakage flow is guaranteed without under pressure. In fact, negative pressures were measured on the backside of the blocks (Figure 6). This result suggests that
a properly designed drainage layer, would not only prevent a positive (uplift) pressure, but also improve the block stability due to the negative (suction) pressure on the backside of the block.
Figure 6: Pressure heads on the backside of the block at row 25: q1=0.16 m2/s; q2=0.24 m2/s
3.2.3. Pressures on the block riser
As previously mentioned, Bramley and Baker (1989) and Slovensky (1993) measured pressures on the block riser. However, they did not show results as a pressure distribution along the riser. Three sensors were placed along the block riser of the measurement blocks (Figure 3) in order to characterize the pressure distribution on the block riser. As expected, pressures on the riser were negative or close to zero and the higher suction was located at the top of the riser (Figure 7). Given that the drainage holes are located at the riser base, a positive pressure in that area, although low, implies water passing into the drainage layer through the holes, as is the case of the lower unit discharge of 0.16 m2/s at the block located in row 25 (Figure 7).
4. DRAINAGE FLOW
4.1. Background
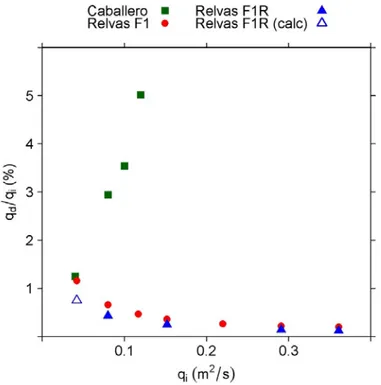
Relvas and Pinheiro (2010) reported the unit drainage flows for different discharge flow rates. They concluded that "the water infiltration through the joints and holes of the blocks is much less than the discharge (less than 0.25% for the higher discharges, which represents the skimming flow regimes of more interest for stepped chutes prototypes)", see Figure 8. A decrease in the drainage flow is observed as the discharge flow rate increase. It may be due to the fact that the drainage layer is saturated (positive pressures are reported for the backside of the blocks), and a fraction of the drainage flow returns to the surface flow because of the suction pressure at the holes that are located at the riser base and on the upstream face of the tread, where pressure is negative. Furthermore, as the negative pressure at the holes increases, the drainage flow rate is further reduced.
4.2. Registered Drainage Flow
As previously discussed, there is a 0.2 m layer of free space under the blocks. Since the metal grid in this space carries drainage water away, that layer is never saturated, and the return of the drainage water to the surface of the spillway is not possible. The leakage flow is evacuated at the end of the chute and pass through a triangular weir, where it is measured.
Unlike results reported by Relvas and Pinheiro (2010), the first tests show that leakage flow (refered to as drainage flow by Relvas and Pinheiro) increases as the discharge flow rate becomes higher (see Figure 8). However, the measured flows are in agreement with Relvas and Pinheiro results for the lowest flow rate. This result suggests that the drainage layer of Relvas and Pinheiro tests was not completely saturated for low flow rates. It should be noted that the total length of WSBs joints for the tests under Relvas F1R label in Figure 8 exactly matches the total length of joints in the now reported tests.
Figure 8: Drainage unit flow (qd), expressed as a percentage of the unit discharge flow, (qi), for different unit
5. BLOCK STABILITY AND DESIGN CONSIDERATIONS
Slovensky (1993) and Relvas (2008) analyzed the stability of wedge shaped blocks subject to hydrodynamic forces. They considered different failure modes. One of them was the removal of one or several blocks because of hydrodynamic instability. The stability was analyzed under several assumptions: a) the loss of the block is assumed to be caused by lifting in the direction perpendicular to the slope; b) forces considered were: impact forces; forces at the separation zone; submerged weight of the block and uplift forces on the lower side of the block, normal to the surface, caused by the saturation of the drainage layer; c) the favorable forces due to block overlap were neglected and constitute an added safety margin. They concluded that, under the tested conditions, the wedge shaped blocks were decidedly stable. Slovensky (1993) cites an exception, although failure of the spillway did not occur: "In only
one situation did analysis show the stability of the blocks to be questionable. This occurred at the toe of the embankment at a very low unit discharge. Better drainage though the toe structure would probably have greatly increased block stability at the toe by alleviating the stagnation pressure which developed in the drain there".
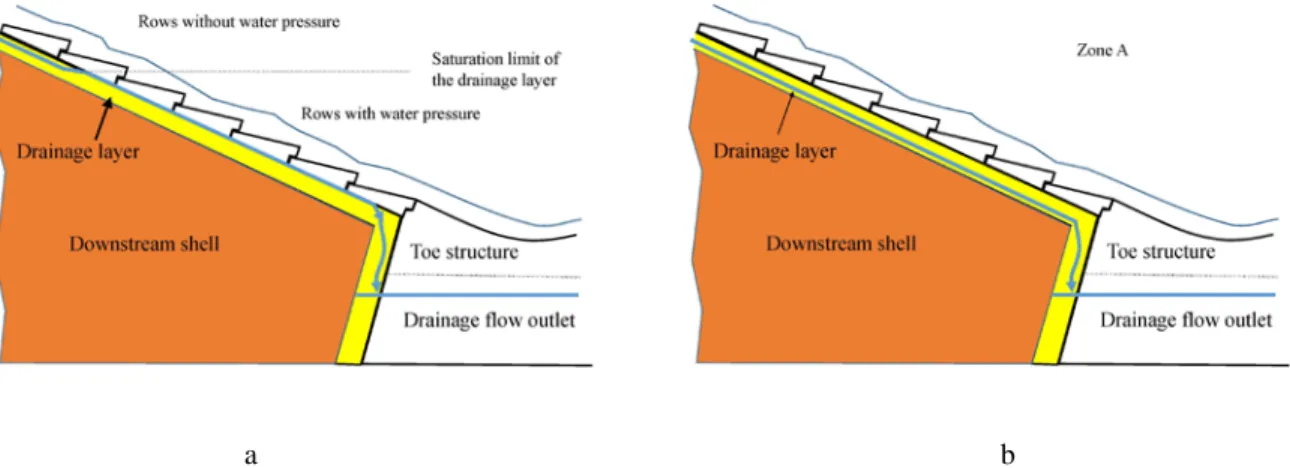
It is remarkable that authors who reported stability analyses of the blocks when the drainage layer is saturated noticed either uplift or down thrust forces on the backside of the block. The sign of this force depended on the negative pressure developed downstream the riser (see figure 9a). . However, if the drainage layer is designed with a flow capacity high enough to convey the drainage flow without saturation, uplift pressures cannot be developed on the backside of the blocks, improving the stability (see figure 9b). Therefore, one aspect to discuss can be whether saturation of the drainage layer should be considered as a normal or accidental situation. Two different issues should be considered: dam type, and the drainage flow outlet, which has a relation with the terminal structure of the spillway.
a b
Figure 9: Sketches of saturation (a) and unsaturation (b) condition of the drainage layer under the blocks
Drainage layer is only needed if the downstream shell of the dam which supports the blocks has a low permeability, insufficient to rapidly convey downward the water flow coming from the spillway, as happens for homogeneous embankment dams. In this case, no significant water flow is expected to come from the impervious dam body. It is assured that all the flow conveyed through the drainage layer is the flow from the leakage of the spillway. In spillways over rockfill dams, a regularization layer under the blocks is necessary to facilitate the placement of the blocks. However, the drainage function can be unnecessary if the permeability of the material of the downstream shell is high enough. In this case, the saturation condition under the blocks may only occur due to accidental causes with a very low probability of occurrence such as the failure of the impervious element (the clay core or the upstream face) or an overtopping scenario.
The type of terminal structure of the spillway is relevant to the saturation condition under the rows of blocks located at the end of the spillway. The hydraulic jump stilling basin should be designed to avoid the saturation condition under the blocks (see figure 9). Additionally, the high turbulence may affect the stability of the blocks as it has been observed in the first tests developed. Although the high permeability of the rockfill allows a rapid drainage of the water in the dam body, the descent of water level in the stilling basin may be even faster and provoke an unfavorable situation for
the stability of the blocks. This condition could be solved by substituting the wedge shaped blocks by a conventional reinforced concrete end sill in that area. Similarly, a ski jump/flip bucket could be a good alternative for the terminal structure if it is acceptable depending on the maximum discharge flow and geological conditions downstream. With this type of terminal structure the wedge shaped blocks are not affected by the action of returning the flow to the river (Morán and Toledo, 2014).
6. CONCLUSIONS
Although the experimental testing has not been completed yet, some preliminary conclusions can be addressed. A general agreement with the measurements of previous studies was observed for pressures recorded on the block tread. This experimental research shows two singular features:
1. The drainage layer was modeled by a completely empty space simulating a layer designed to avoid saturation. Such space was limited below by the methacrylate channel and on top, by the wedge blocks. The contact between the blocks and the walls of the channel were sealed manually with a waterproof mastic.
2. Thus, a positive water pressure on the backside of the blocks was prevented. As expected, negative pressures (suction) were registered on the backside, favorable to improve the stability of the blocks.
3. Three pressure sensors were set in the riser of the measurement blocks in order to characterize the pressure pattern on it.
As expected, pressure records in the riser were negative or close to zero and the greatest negative pressure occurred at the top point. It is remarkable that in some cases pressure, although low, is positive in the lower area of the riser, and then the block holes allow water passing to the drainage layer, increasing the drainage flow.
Differing from previous studies, the non-saturated state of the drainage layer avoids one of the effects of the block drainage holes when pressure is negative on the lower area of the riser. Specifically, the holes in this study cannot facilitate the return of water to the surface flow over the spillway. Consequently, drainage flow increases when the discharge flow rate becomes higher, opposite of what is reported by previous authors.
More tests are planned in the near future and additional analysis will be completed after the experimental campaign is finished.
7. ACKNOWLEDGEMENT
The research was founded by the Spanish Ministry of Economy and Competitiveness (Ministerio de Economía y Competitividad, MINECO) through the projects ACUÑA (IPT-2011-0997-020000) and DIABLO (RTC-2014-2081-5). This article has been developed under the agreement of collaboration termed AULA CIMNE-UPM.
8. REFERENCES
Armortec Erosion Control Solutions (2006). Pre-cast concrete units. Barriga dam project. Burgos. Spain, Submittal documents edn. (Confidential).
Baker, R., and Gardiner, K. (1994). “Construction and performance of a wedge block spillway at Brushes Clough reservoir”. Proceedings of the 8th Conference of the British Dam Society on Reservoir Safety and the Environment,
214-223.
Baker, R. and Gardiner, K.D. (1995). “Building blocks”, International Water Power and Dam Construction, vol. 47,
no. 11, pp. 2.
Booth, N. (2012). “Technical visit: Grane Valley reservoir spillway improvements”.Dams and Reservoirs 2012
volume 22, issue 3-4, September 2012, pp. 113–115. http://dx.doi.org/10.1680/dare.13.00009. Institution of Civil Engineers (ICE) Publishing.
Bramley, M. and May, R. and Baker, R. (1989). Performance of wedge-shaped blocks in high velocity flow. CIRIA Research Project 407. Stage 1 Report- July 1989.
Caballero, F.J.; Toledo, M.A.; San Mauro, J. and Salazar, F. (2014). "Physical and numerical modeling for understanding the hydraulic behavior of wedge-shaped-blocks (WSB) spillways". Dam Protections against
Overtopping and Accidental Leakage. CRC Press/ Balkema, ISBN 978-1-138-02808-1, pp. 193-206
Cloppper, P.E. (1989). Hydraulic stability of articulated concrete block revetment systems during overtopping flow. FEMA. (2014). Technical manual: Overtopping protection for dams U.S. Department of Homeland Security. Frizell, K. H. (1997, September). “Protecting embankment dams with concrete stepped overlays”. Hydro Review, 16,
36-45.
Frizell, K.H. (2007). ArmorwedgeTM analysis report: block size scaling and bedding information. (Confidential). Gaston, M. L. (1995). Air entrainment and energy dissipation on a stepped block spillway. M.S. thesis, Colorado State University, Fort Collins, CO.
Grinchuk, A.S. and Pravdivets, Y. P. and Shekhtman (1977). “Test of earth slope revetments permitting flow of water at large specific discharges”. Translated from GidrotekhnicheskoeStroitel´stvo, nº4, pp. 22-26, April, 1977. Hewlett, H., Baker, R., May, R., and Pravdivets, Y. P. (1997). Design of stepped-block spillways. London, U.K.: Construction Industry Research and Information Association.
Morán, R., and Toledo, M. A. (2014). “Design and construction of the Barriga dam spillway through an improved wedge-shaped block technology”. Canadian Journal of Civil Engineering, 41(10), 924-927
Morton, D. et al (2008). “Norton Fitzwarren flood alleviation dam”http://www.hyderconsulting.com/insights/Documents/
Pether, R., Marsh, P., and Cartwright, P. (2009). “An innovative new spillway for Bruton flood storage reservoir”.
Dams and Reservoirs, 19, 67-72.
Pravdivets, Y. P., and Slissky, S. M. (1981). “Passing floodwaters over embankment dams”. International Water
Power and Dam Construction, 33(7), 30-32.
Relvas, A.T. (2008). Descarregadores de Cheias de Blocos de Betão Prefabricados em Forma de Cunha sobre Barragens de Aterro (in portuguese). Ph.D. Thesis, UniversidadeTecnica de Lisboa, Instituto Superior Técnico. Relvas, A.T. and Pinheiro, A.N. (2008). “Inception Point and Air Concentration in Flows on Stepped Chutes Lined with Wedge-Shaped Concrete Blocks”. Journal of Hydraulic Engineering, Vol.134, issue 8, 1042-1051
Relvas, A.T. and Pinheiro, A.N. (2010). “Closure of "Inception Point and Air Concentration in Flows on Stepped Chutes Lined with Wedge-Shaped Concrete Blocks". Journal of Hydraulic Engineering, Vol.136, issue 1, 86-88 Relvas, A.T. and Pinheiro, A.N. (2011). “Stepped chutes lined with wedge-shaped concrete blocks: hydrodynamic pressures on blocks and stability analysis”. Canadian Journal of Civil Engineering, 38, 338-349
Relvas, A.T. and Pinheiro, A.N. (2011). “Velocity Distribution and Energy Dissipation along Stepped Chutes Lined with Wedge-Shaped Concrete Blocks”. Journal of Hydraulic Engineering, Vol. 137, No. 4, April, 423–431
Slovensky Jr, G.G. (1993). Near-prototype testing of wedge-block overtopping protection. M.S. thesis, Colorado State University, United States.
Takaware, S.W. and Tatewar, S.P. (2010). “Discussion of Inception Point and Air Concentration in Flows on Stepped Chutes Lined with Wedge-Shaped Concrete Blocks by A.T. Relvas and A.N. Pinheiro”. Journal of Hydraulic
Engineering, Vol.136, issue 1, 86-88
Thomson, D. (2014). “United efforts at Grane Valley reservoir”. Water Power and Dams Construction. http://www.waterpowermagazine.com/features/featureunited-efforts-at-grane-valley-reservoir-4273851/