www.dcidj.org 6
ORIGINAL RESEARCH
*Corresponding Author: Björn Ekman, Associate professor at the Medical Faculty, Lund University, Sweden.
Email: bjorn.ekman@med.lu.se
Disability, Sociodemographics, and Discrimination: A
Descriptive Analysis of Household Survey Data from
Bangladesh
Björn Ekman1, Johan Borg2, AHM Noman Khan3, Nazmul Bari3, Moin Tanbir3,
Maria Emmelin1
1. Medical Faculty, Lund University, Sweden
2. School of Education, Health and Social Studies, Dalarna University, Sweden 3. Centre for Disability in Development, Dhaka, Bangladesh
ABSTRACT
Purpose: Disability affects upwards of one billion people worldwide, the majority
of whom live in low- and middle-income countries. Based on survey data from Bangladesh, the aim of the study is to contribute to an improved understanding of the experiences of people with disabilities in terms of discrimination, health, and sociodemographic indicators.
Method: A descriptive analysis of data is presented, from a survey implemented
in 2016 on a sample of adult persons with disabilities from 18 districts in Bangladesh (n=1,900). The summary statistics of main indicators and correlation analysis of key variables are given.
Results: Women comprised around 40% of the sample. The mean age was
36 years (minimum 18 years and maximum 55 years). Women had lower socioeconomic status than men (p<0, 01), were less likely to be well-educated or employed, had worse self-assessed health (p<0, 05), and were less likely to be able to read and write. Men were more likely to have a physical disability than women (p<0, 01). Both women and men reported unmet needs in terms of access to assistive products and not receiving a benefit. Around 40 % of the sample reported having experienced discrimination, with no significant differences between women and men.
Conclusion and Implications: Many women and men with disability
experience some forms of discrimination, including in matters pertaining to
healthcare, education, and employment. Such experiences may have a negative impact on their life chances. However, women and men with a disability differ in several important respects, both in terms of socioeconomic status and types of disability. Such differences need to be considered for effective and equitable policy development.
Key words: disability, discrimination, self-assessed health, Bangladesh, survey
INTRODUCTION
Various forms of disability continue to affect hundreds of millions of people across most countries and regions of the world. Global estimates suggest that upwards of one billion people are living with a disability (WHO and World Bank, 2011). The vast majority of people with disabilities live in low-income countries (LICs) where the risk of disability is high and the resources available to improve their lives are scarce (Mont, 2007).
While it is important to understand the prevalence of disability across and within countries in order to address the overall needs for investing in preventive, rehabilitative and accessible services, it is also critical to have a broader and deeper understanding of the lives of people living with a disability. In particular, a more profound appreciation of the experiences of people with disability in their everyday lives, in terms of working, seeking healthcare and obtaining education, would contribute towards the development of more effective policy interventions (Borg et al, 2011; Barber, 2012; Barrett and Marshall, 2013; Bowes et al, 2013). Compared with other members of society, the living conditions of people with disabilities are generally more challenging. Studies have shown that they usually have more difficulties in accessing services, securing an income, and fulfilling their potentials (Potts, 2005; van Brakel et al, 2012). In addition, many people with disabilities, not least in low- and middle-income countries, experience various forms of discrimination that negatively affect their life chances (Cleary, 1997; Carter and Markham, 2001; Erridge, 2005; Turner et al, 2005; Barber, 2012). For example, due to misplaced notions and preconceptions on the part of the general population, persons with disabilities may have less access to healthcare, reduced chances of obtaining or completing an education, or of being accepted for employment (Bjelland et al, 2010; Noone, 2013).
While the current evidence base on the prevalence and experiences of people with disabilities is growing, important gaps remain. For instance, there is still
www.dcidj.org 8
limited knowledge about the experiences of discrimination among persons with disabilities (FHI, 2006; Ali et al, 2013) and their access to social capital (Dutt and Webber, 2010; Gotto et al, 2010). The purpose of this study is to contribute to a broader understanding of the experiences of people with disabilities. In particular, the study presents a descriptive analysis of the findings of the Social Capital and Discrimination in Bangladesh (SCDB) survey of people with disabilities, implemented in 2016. The SCDB survey collected information on a range of issues, including experiences of discrimination, sociodemographic and economic factors, access to social capital, ability to perform various tasks, and on use of assistive products.
Study Context
In Bangladesh, a country of around 160 million people, estimates of the prevalence of disability vary considerably across different studies, from less than 1% in Census surveys to over 14% in a household survey (Titumir and Hossain, 2005; Bangladesh Bureau of Statistics, 2015). The most common types of disabling impairments in Bangladesh are visual (32.2% of the total estimate), physical (27.8%), hearing (18.6%), intellectual (6.7%), multiple (10.7%), and speech (3.9%) (BBS, 2015). Existing surveys also show that the prevalence of different types of disability varies among demographic groups and with socioeconomic status. While Bangladesh has signed the United Nations Convention on the Rights of Persons with Disabilities (UNCRPD) and extensive support is provided by the civil society to realise the aim of the Convention, the lives of people with disabilities in Bangladesh continue to be affected by negative norms and attitudes(Titumir and Hossain, 2005). For example, around one-third of the general adult population of Bangladesh has poor knowledge of people with disabilities, and many have a weak understanding of the causes of disability. Critically, attitudes of the general population toward people with disabilities include name-calling and refusing to let offspring marry a person with a disability (ibid). Such attitudes are not unique to Bangladesh, making the lessons from this study context valuable to other low- and middle-income countries as well.
METHOD
Study DesignThe SCDB survey was a cross-sectional household survey conducted between April and September 2016 in Bangladesh. The survey was implemented in four
divisions of Bangladesh, covering a total of 18 Districts, two of which were municipalities (urban).
Study Sample
The sampling frame of the survey consisted of all people with disability who were registered as such under the Promoting Rights of People with Disabilities (PRPD-DI) project. The PRPD-DI project was implemented by the national non-governmental organisation - Centre for Disability in Development (CDD) - in all regions of the country. Under this project, CDD worked with a number of partner NGOs (P-NGO) to implement a series of activities. (Details are available at http://www.cdd.org.bd/key-focus-areas/current-projects.)
In total, 9920 individuals were included in the original list of participants of the PRPD-DI project. A total of 4816 individuals fulfilled the eligibility criteria of the SCDB survey: adults between 18 and 55 years of age, with a hearing, speech, visual, physical, or combination impairment. To ensure that first-hand information was provided, the study excluded children and persons with a mental or cognitive disability. The participants were randomly selected from the sample frame, employing non-stratified sampling. Based on pre-study power calculations, the aim of the study was to sample around 2,000 individuals to ensure sufficient power of the statistical analysis.
Data Collection
The SCDB household survey questionnaire consisted of a total of 97 questions divided into five separate sections: a) Location; b) Identification, Demographics, and Family; c) Disability; d) Socioeconomics; e) Social Capital; and, f) Discrimination. The draft questionnaire was submitted along with an application to the Bangladesh Medical Research Council (BMRC) for ethical approval. No changes were made to the questionnaire after ethical review and subsequent approval.
The implementation of the survey was led and coordinated by a team of researchers at the CDD headquarters outside of Dhaka. All the interviewers (n=12) had previous experience in administering a household survey questionnaire involving face-to-face interviews with the interviewers filling in the responses. The team of interviewers was given training on how to administer the survey during two separate events, each of which involved testing the survey questionnaire on persons with disabilities. Among other quality control activities, the interviewers
www.dcidj.org 10
were instructed to check that all relevant questions had been addressed and that only legitimate values had been entered. After further post-survey data quality controls, the final sample of the SCDB survey consisted of 1900 respondents.
Statistical Analysis
To provide a detailed description of the main results of the SCDB survey, the data was analysed by means of descriptive statistics and bivariate correlation analysis. The categorical variables are described by means of frequencies and proportions across categories. The continuous variables are presented along means, range, and standard deviations. In addition, graphical illustrations of socioeconomic status across sex and disability are presented.
To obtain an understanding of the association between the sociodemographic characteristics of the sample and relevant indicators of disability, discrimination, and other variables, Pearson’s Chi-squared tests of association were used along with probability values. Differences in mean values for selected groups were analysed by independent sample t-tests. In addition, measures of association were calculated using Chi-squared and non-parametric tests (Wilcoxon rank-sum) statistic. All statistical analyses were made in Stata 16.1.
Ethical Approval
The study received ethical approval from the Bangladesh Medical Research Council (MCRC), reference number BMRC/NREC/2013-2016/621. Before the interviews started, all participants were informed about the aim of the research study, their right to decline to participate, and how the information provided would be handled by the researcher. They were also provided with the contact details of the principal investigators. Each participant then signed a consent form.
RESULTS
This section presents the results of the descriptive analysis of the survey data. The first sub-section looks at the overall distribution of the main demographic and socioeconomic variables by sex. The second sub-section presents the analysed results of the correlation between various indicators of relevance to people living with a disability, such as access to assistive devices, a mobile phone or the internet, levels of literacy, and the ability to perform certain everyday activities. These indicators are presented by sex and type of disability. The next sub-section looks at experiences of discrimination, and the final sub-section presents the results of
the statistical analyses of the relationship between key indicators, including sex, income, and self-assessed health (SAH).
Demographics and Socioeconomic Status by Sex
As noted above, the SCDB survey applied a non-stratified sampling approach to identify the individuals to be included in the survey. This resulted in around 42% of the sample being women and around 58% being men (Table 1).
Table 1: Demographics, Socioeconomic Status, and Disability by Sex
Female Male Total
(N = 804) (N = 1096) (N = 1900) Age Mean (SD) 35.4 (10.3) 36.0 (10.3) 35.7 (10.3) Median (Q1, Q3) 34.0 (27.0, 44.0) 35.0 (28.0, 44.0) 34.0 (27.5, 44.0) Min, Max 18, 55 18, 55 18, 55 Monthly spending (BDT) Mean (SD) 2816 (2087) 4394 (3711) 3726 (3223) Median (Q1, Q3) 2500 (1500, 4000) 4000 (2000, 6000) 3000 (2000, 5000) Min, Max 0, 20000 0, 50000 0, 50000 Sex Female 804 (100%) 804 (42.3%) Male 1096 (100%) 1096 (57.7%) Disability type Hearing 162 (20.2%) 150 (13.7%) 312 (16.5%) Mobility 466 (58.0%) 742 (67.9%) 1208 (63.7%) Visual 175 (21.8%) 201 (18.4%) 376 (19.8%) Duration of problem
Less than 1 year 3 (0.4%) 5 (0.5%) 8 (0.4%) Between 1 and 5 years 38 (4.8%) 53 (5.0%) 91 (4.9%) More than 5 years 351 (44.4%) 543 (50.8%) 894 (48.1%) Always 399 (50.4%) 467 (43.7%) 866 (46.6%) Location Urban 159 (19.8%) 165 (15.1%) 324 (17.1%) Rural 645 (80.2%) 931 (84.9%) 1576 (82.9%) Education No education 513 (64.8%) 587 (54.4%) 1100 (58.8%) Primary 157 (19.8%) 222 (20.6%) 379 (20.3%) Secondary 95 (12.0%) 198 (18.4%) 293 (15.7%) Higher secondary 11 (1.4%) 41 (3.8%) 52 (2.8%) Post-secondary 16 (2.0%) 31 (2.9%) 47 (2.5%) Employment status Unemployed 686 (85.9%) 462 (42.4%) 1148 (60.8%) Employed 113 (14.1%) 627 (57.6%) 740 (39.2%)
The mean age of the participants was around 36 years. The median age was 34 years, indicating a fairly normal age distribution of this sample of adults aged between 18 and 55 years. There was no difference in the distribution of age between women and men. Most people with a disability in the sample were affected by mobility impairment. Around 47% of the sample reported being
Health, Social Capital, Assistive Products, and Abilities
Table 2 shows the frequency and shares across sex of some of the main analytical indicators on which the survey collected data. Around 45% of the respondents reported their overall health to be “good”. However, more than half of the sample assessed their health to be less than good, with more than 8% saying their health was “very bad”.
Table 2: Self-assessed Health, Access to Technology, and Abilities by Sex
Female Male Total
(N = 804) (N = 1096) (N = 1900)
SAH
Very bad 76 (9.5%) 80 (7.3%) 156 (8.2%) Bad 160 (19.9%) 193 (17.7%) 353 (18.6%) Neither bad nor good 206 (25.7%) 295 (27.0%) 501 (26.4%) Good 354 (44.1%) 509 (46.6%) 863 (45.5%) Very good 7 (0.9%) 16 (1.5%) 23 (1.2%) People can be trusted
No 336 (43.5%) 382 (36.0%) 718 (39.1%) Yes 436 (56.5%) 680 (64.0%) 1116 (60.9%) Member in groups No 587 (73.0%) 726 (66.2%) 1313 (69.1%) Yes 217 (27.0%) 370 (33.8%) 587 (30.9%) Problem walking No problem 340 (42.4%) 409 (37.5%) 749 (39.6%) Mild problem 71 (8.9%) 104 (9.5%) 175 (9.2%) Moderate problem 113 (14.1%) 143 (13.1%) 256 (13.5%) Severe problem 184 (22.9%) 267 (24.5%) 451 (23.8%) Complete problem 94 (11.7%) 167 (15.3%) 261 (13.8%) Problem using hands
No problem 460 (57.8%) 636 (58.5%) 1096 (58.2%) Mild problem 71 (8.9%) 96 (8.8%) 167 (8.9%) Moderate problem 86 (10.8%) 107 (9.8%) 193 (10.2%) Severe problem 117 (14.7%) 157 (14.4%) 274 (14.5%) Complete problem 62 (7.8%) 92 (8.5%) 154 (8.2%) Able to write No 539 (68.0%) 629 (58.3%) 1168 (62.4%) Yes 254 (32.0%) 450 (41.7%) 704 (37.6%) Able to read Yes 144 (17.9%) 280 (25.7%) 424 (22.4%) Yes with some problems 90 (11.2%) 148 (13.6%) 238 (12.6%) No usually not 91 (11.3%) 111 (10.2%) 202 (10.7%) No not at all 478 (59.5%) 551 (50.6%) 1029 (54.4%) Disability benefit
No 560 (69.7%) 722 (65.9%) 1282 (67.5%) Yes 244 (30.3%) 374 (34.1%) 618 (32.5%) Use of assistive products
No 679 (84.7%) 789 (72.1%) 1468 (77.4%) Yes 123 (15.3%) 305 (27.9%) 428 (22.6%) Access to cell phone
No 299 (37.5%) 278 (25.6%) 577 (30.6%) Yes 498 (62.5%) 810 (74.4%) 1308 (69.4%) Access to internet
No 765 (96.1%) 1016 (93.0%) 1781 (94.3%) Yes 31 (3.9%) 76 (7.0%) 107 (5.7%)
www.dcidj.org 14
With respect to social capital, two different types of indicators were included. First, slightly less than two-thirds of the entire sample agreed with the statement that people can generally be trusted (an indicator of cognitive social capital) (Kawachi et al, 2008). However, a larger share of men did so, compared to women. Second, around one-third of the total sample reported being a member of at least two social groups, such as an association, a cooperative, or a religious congregation (an indicator of structural social capital) (ibid). A slightly larger share of men than women reported being a member of at least two such organisations.
More than 60% of the respondents said they experienced some problems with walking. While such a problem may be predominantly concentrated among those with a mobility impairment, further analysis showed that those with a hearing (and vision) impairment also reported having some problems moving about (not shown).
The vast majority of respondents reported not being able to write, did not use an assistive product, and did not receive any form of disability benefit. Furthermore, a larger share of women than men reported not being able to read. Finally, while more than two-thirds reported that they had access to a mobile phone (of any type), the majority of respondents did not have access to the internet. The shares for women and men were similar for these indicators.
Disability and Discrimination
The SCDB survey asked several questions about the respondents’ experiences of discrimination. Discrimination was defined in the survey as “being treated negatively in some sense or situation.” (See SCDB Questionnaire, Section F: Discrimination, for details). Overall, around 40% of the participants reported having been discriminated against at some point in life in some unspecified context (Table 3, Panel A).
Table 3: Ever been Discriminated Against (Panel A) and Discriminated in past 12 months (Panel B)
Panel A Panel B
Ever been
discriminated Freq. Percent Discriminated in past 12 months Freq. Percent
No 1,123 60 No 177 23
Yes 743 40 Yes 605 77
Total 1,866 100 Total 782 100
Among those who reported having experienced discrimination, around 77 % confirmed that this had happened in the past 12 months (Panel B).
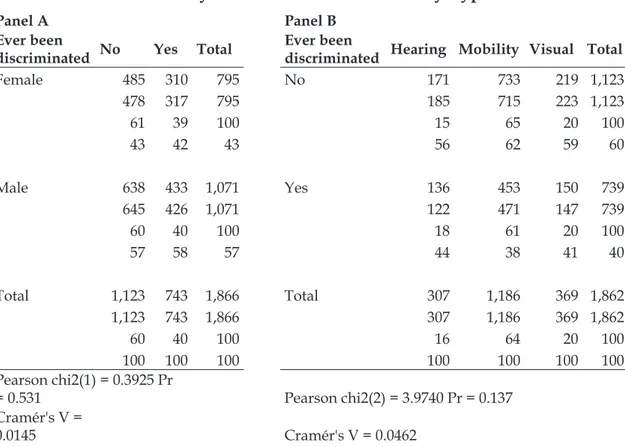
While these are noteworthy shares, there was no evidence that women living with a disability were more at risk of discrimination than men (Table 4, Panel A) or that persons afflicted by a particular type of disability were more prone to discrimination than others (Panel B).
Table 4: Discrimination by Sex (Panel A) and Disability Type (Panel B)
Panel A Panel B
Ever been
discriminated No Yes Total Ever been discriminated Hearing Mobility Visual Total
Female 485 310 795 No 171 733 219 1,123 478 317 795 185 715 223 1,123 61 39 100 15 65 20 100 43 42 43 56 62 59 60 Male 638 433 1,071 Yes 136 453 150 739 645 426 1,071 122 471 147 739 60 40 100 18 61 20 100 57 58 57 44 38 41 40 Total 1,123 743 1,866 Total 307 1,186 369 1,862 1,123 743 1,866 307 1,186 369 1,862 60 40 100 16 64 20 100 100 100 100 100 100 100 100 Pearson chi2(1) = 0.3925 Pr = 0.531 Pearson chi2(2) = 3.9740 Pr = 0.137 Cramér's V = 0.0145 Cramér's V = 0.0462
(Note: Total frequency; Expected frequency; Row percentage; Column percentage)
Statistical and Sensitivity Analyses
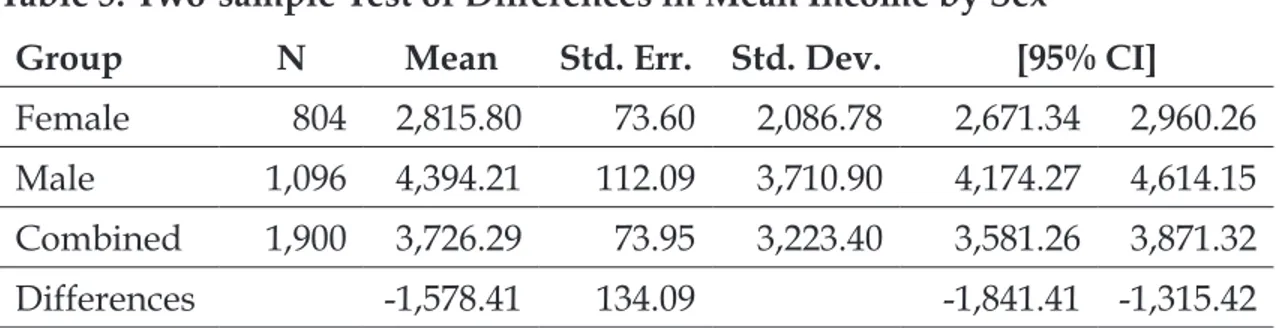
In addition to the above analyses of the survey sample, statistical analyses were performed to measure the relationship between selected variables. Table 5 shows the result of a two-sample test of the differences in mean income by sex.
www.dcidj.org 16
Table 5: Two-sample Test of Differences in Mean Income by Sex
Group N Mean Std. Err. Std. Dev. [95% CI]
Female 804 2,815.80 73.60 2,086.78 2,671.34 2,960.26
Male 1,096 4,394.21 112.09 3,710.90 4,174.27 4,614.15
Combined 1,900 3,726.29 73.95 3,223.40 3,581.26 3,871.32
Differences -1,578.41 134.09 -1,841.41 -1,315.42
H0: diff=0, H1: diff<0, Pr(T<t)=0.0000. t=-11.7711, Satterthwaite d.f.=1789.16.
The differences reported above were statistically significant (p<0.01). Furthermore, the estimated mean difference of income of around 1600 BDT was close to half of the estimated standard deviation, indicating that the effect is relatively strong. With respect to the reported difference in self-assessed health between men and women in the current sample, there was some support for this measure of overall health being significantly better among men compared with women (p<0.05) (Table 6).
Table 6: Two-sample Wilcoxon rank-sum (Mann-Whitney) test of difference in Self-Assessed Health (SAH) by Sex
Group N Rank sum Expected
Female 803 73,9469.0 7,61,645.5
Male 1,093 10,58,887.0 10,36,710.5
Combined 1,896 17,98,356.0 17,98,356.0
H0: SAH female = SAH male; z=-2.007, Prob>|z|=0.0448
Similar two-sample tests of proportions for the indicators reported above were conducted. The results suggest that the reported differences between men and women are statistically significant at p<0.01 for employment status, literacy, use of assistive product, access to benefits, and access to mobile phone (not shown). In addition, as noted above, the share of women in the current sample appeared to be larger than that reported in other recent studies of disability in Bangladesh (BBS, 2015). To adjust for this over-sampling, the above set of analyses was repeated using population weights for sex. However, the results of the weighted estimates did not produce any material differences to those reported above.
Finally, a power analysis was performed to assess the overall validity of the survey sample in terms of size. The test used Stata’s chi2power-command set at sample size factor 1 with increments of 1 to factor 10. The test showed that for power size factor of 1 (i.e., the actual sample size of n≈1896 individuals), the power was 0.9899, suggesting that the sample size was adequate for the types of analyses conducted above (not shown).
DISCUSSION
Using data from a household survey about the lives of people living with disability in various districts throughout Bangladesh, the study found several aspects that are worth noting. There are considerable and important variations to be found among the group of people living with disabilities. Women and men are affected by different types of disabilities, and their economic and social experiences vary. In line with the general situation of women in Bangladesh and elsewhere, women respondents in the current survey tend to be poorer, less able to read and write, use an assistive product to a lesser extent, have less access to a mobile phone, and are in worse health than the men.
While the study does not aim to make statistical inferences with respect to the relationships between the various indicators presented in the analysis, the noteworthy finding is that around 40% of the sample reported having experienced discrimination of some sort. Underscoring the risk of discrimination and social stigma, a previous study in Bangladesh with a sample of 583 participants with hearing or mobility limitations, between 15-55 years of age, found that about six out of ten respondents had experienced negative attitudes from neighbours. They also reported difficulties in making and maintaining friendships (Borg et al, 2012). The implications and effects of such behaviours and attitudes on the part of the general population towards people with disabilities most likely varies across contexts. However, a general understanding of the nature and scope of these issues is important for effective interventions aiming to improve the lives of people living with a disability.
The findings of this study complement those of other investigations into the prevalence, impacts, and experiences of people living with disability in Bangladesh. The current study extends the understanding of these issues by focusing on a set of key indicators and factors of relevance, including types of disabilities, differences between women and men, and experiences of discrimination. While all contexts are particular, several of these findings can be translated to other countries and
www.dcidj.org 18
regions. For example, the risk of discrimination is likely to be real in most, if not all, contexts where people with disabilities live (Erridge, 2005; Hanna and Linden, 2009; Échevin, 2013). Likewise, the seemingly poorer outcomes for women with disabilities as compared with men are also all but universal.
The study also found that people with disabilities in Bangladesh have access to different types of social capital, both cognitive and structural. The evidence for the role of social capital in improving population health and for reducing the risk or prevalence of discrimination is relatively strong (Erridge, 2005; Derose and Varda, 2009; Gotto et al, 2010; Eriksson, 2011). Developing and implementing interventions to support access to social capital for people with disabilities would thus appear to be a matter of priority. However, the results also show that women and men differ with respect to social capital. This means that care needs to be taken when designing such interventions in order to ensure their effectiveness and fairness.
Although care should be taken with respect to concrete policy implications, the findings from a descriptive analysis such as this one do suggest that policies to address the needs of people living with disabilities need to take into careful consideration the diversity in experiences, abilities, and opportunities of these groups of individuals. Indeed, people living with disabilities often have idiosyncratic needs and abilities. The capacity of others to address these needs requires particular and individually tailored solutions. Broadly however, actions should be taken to reduce the risk of discrimination against people living with disability so as to ensure that their human and civil rights are protected.
Further analysis is needed to understand the causal directions of some of the associations included in the study. Such analyses are challenging, given the complex nature of the processes of the impact of discrimination on social and economic outcomes. Furthermore, discrimination takes many different forms and is experienced in different contexts. Additional analysis of the SCDB survey data will contribute to a more profound understanding of some of these questions.
Limitations
There are several limitations of the study that need to be taken into consideration when interpreting the results. First, while the sample is relatively large for this type of study, it is not nationally representative. A large category of disability, namely that of cognitive and mental disability, is not included in the study. Also,
the study only looks at adult individuals. The experiences of children and young people living with disability most likely differ in important ways from those of adults. Broad generalisations based on this study alone should therefore be avoided.
In addition, and as noted above, the study adopts descriptive univariate and bivariate analysis of the survey data to investigate distributions of and associations between variables of relevance. In combination with the cross-sectional study design this precludes any causal analysis of relationships.
CONCLUSION
Based on the above results and limitations, the study concludes that people living with disabilities make up a diverse group of individuals whose specific abilities and challenges need to be considered for effective policy development. The situation of women with disabilities differs significantly in some respects from that of men, and these differences also need to be properly understood when designing interventions to support people with disabilities. Finally, both women and men living with disabilities experience discrimination in different situations. Such experiences most likely affect people with disabilities in a negative way, and policies should be developed to reduce the risk of such experiences and limit their impacts.
Implications for Rehabilitation
• People living with a disability frequently experience various forms of discrimination with respect to healthcare, education, and employment. • Interventions to support people with disabilities need to consider the
heterogeneity of individuals, both across sex and socioeconomic status as well as by type of disability.
• Differences between women and men are of particular concern for effective and equitable policy development.
• Further research is needed to understand the role of social capital to mitigate the risk of being discriminated against in various contexts.
www.dcidj.org 20
ACKNOWLEDGEMENT
This study was funded by a research grant from the Swedish Research Council (Vetenskapsrådet 2013-06584).
The authors acknowledge the support provided by the collaborating organisations and by all interviewees.
All contributing authors participated in the planning of the study, including its design, sampling approach, and questionnaire development. The corresponding author can be contacted for any queries related to the data used in the study.
Conflict of Interest
The authors declare no conflict of interest. The current study did not aim to evaluate the effects of the work of CDD or its partner NGOs in any way.
REFERENCES
Ali A, Scior K, Ratti V, Strydom A, King M, Hassiotis A (2013). Discrimination and other barriers to accessing health care: perspectives of patients with mild and moderate intellectual disability and their carers. PLoS One 8(8): e70855. https://doi.org/10.1371/journal.pone.0070855 PMid:23951026 PMCid:PMC3741324
Bangladesh Bureau of Statistics - BBS (2015). Disability in Bangladesh: Prevalence and pattern. Population Monograph: Volume-5. Statistics and Informatics Division, Ministry of Planning, Dhaka. Vol 5
Barber C (2012). Disability discrimination should not be tolerated. Br J Nurs; 21(22): 1302 https://doi.org/10.12968/bjon.2012.21.22.1302 PMid:23249793
Barrett H, Marshall J (2013). Implementation of the World Report on Disability: Developing human resource capacity to meet the needs of people with communication disability in Uganda. International Journal of Speech-Language Pathology; 15(1): 48-52 https://doi.org/1 0.3109/17549507.2012.743035 PMid:23190008
Bjelland M J, Bruyere SM, von Schrader S, Houtenville AJ, Ruiz-Quintanilla A, Webber DA (2010). Age and disability employment discrimination: Occupational rehabilitation implications. J Occup Rehabil; 20(4): 456-471 https://doi.org/10.1007/s10926-009-9194-z PMid:19680793 PMCid:PMC2980632
Borg J, Larsson S, Ostergren PO, Rahman AA, Bari N, Khan AN (2012). Assistive technology use and human rights enjoyment: A cross-sectional study in Bangladesh. BMC Int Health Hum Rights; 12(1): 18 https://doi.org/10.1186/1472-698X-12-18 PMid:22992413 PMCid:PMC3519502
Borg J, Lindstrom A, Larsson S (2011). Assistive technology in developing countries: A review from the perspective of the Convention on the Rights of Persons with Disabilities. Prosthetics
and Orthotics International; 35(1): 20-29 https://doi.org/10.1177/0309364610389351 PMid:21515886
Bowes A, Dawson A, Greasly-Adams C (2013). Literature review: The cost effectivenes of assistive technology in supporting people with dementia, University of Sterling.
Carter JM, Markham N (2001). Disability discrimination. BMJ; 323(7306): 178-179 https://doi. org/10.1136/bmj.323.7306.178 PMid:11473898 PMCid:PMC1120822
Cleary Y (1997). Disability discrimination. Ment Health Care; 1(2): 68
Derose KP, Varda DM (2009). Social capital and health care access: A systematic review. Med Care Res Rev; 66(3): 272-306 https://doi.org/10.1177/1077558708330428 PMid:19174538 PMCid:PMC5661991
Dutt K, Webber M (2010). Access to social capital and social support among South East Asian women with severe mental health problems: A cross-sectional survey. Int J Soc Psychiatry; 56(6): 593-605 https://doi.org/10.1177/0020764009106415 PMid:19734179
Échevin D (2013). Employment and education discrimination against disabled people in Cape Verde. Applied Economics; 45(7): 857-875 https://doi.org/10.1080/00036846.2011.613775 Eriksson M (2011). Social capital and health implications for health promotion. Global Health Action; 4: 1-11 https://doi.org/10.3402/gha.v4i0.5611 PMid:21311607 PMCid:PMC3036711 Erridge P (2005). Disability discrimination. Br Dent J; 199(7): 407, 409 https://doi.org/10.1038/ sj.bdj.4812821 PMid:16215549
FHI (2006). Discrimination - A threat to public health: Final report - Health and Discrimination Project. Stockholm, Ombudsman for ethnic discrimination
Gotto GS, Calkins CF, Jackson L, Walker H, Beckmann C (2010). Accessing social capital: Implications for people with disabilities. Washington, DC, UCEDD.
Hanna R, Linden L (2009). Measuring discrimination in education. NBER Working Paper Series. Washington, DC, NBER https://doi.org/10.3386/w15057
Kawachi I, Subramanian SV, Kim D (Eds.) (2008). Social capital and health. New York, NY, Springer. 71311-3_1 https://doi.org/10.1007/978-0-387-71311-3 https://doi.org/10.1007/978-0-387-https://doi.org/10.1007/978-0-387-71311-3_14
Mont D (2007). Measuring disability prevalence. Social Protection Discussion Paper No. 0706. World Bank.
Noone P (2013). Monitor: Disability discrimination: A population health issue. Occup Med (Lond); 63(5): 387 https://doi.org/10.1093/occmed/kqt058 PMid:24000387
Potts B (2005). Disability and employment: Considering the importance of social capital. Journal of Rehabilitation; 71(3): 20-25
Titumir RAM, Hossain J (2005). Disability in Bangladesh: Prevalence, knowledge, attitudes, and practices. Dhaka, Handicap International, NFOWD, Unnayan Onneshan/The innovators.
www.dcidj.org 22
Turner MA, Herbig C, Kaye D, Fenderson J, Levy D (2005). Discrimination against persons with disabilities: Barriers at every step. Washington, DC, Office of Policy Development and Research: US Department of Housing and Urban Development.
van Brakel WH, Sihombing B, Djarir H, Beise K, Kusumawardhani L, Yulihane R, Kurniasari I, Kasim M, Kesumaningsih K I, Wilder-Smith A (2012). Disability in people affected by leprosy: The role of impairment, activity, social participation, stigma and discrimination. Glob Health Action: 5. https://doi.org/10.3402/gha.v5i0.18394 PMid:22826694 PMCid:PMC3402069 World Health Organisation and World Bank (2011). World report on disability. Geneva. Available at: https://www.who.int/disabilities/world_report/2011/report.pdf