This is the published version of a paper published in The Lancet.
Citation for the original published paper (version of record):
Wang, H., Naghavi, M., Allen, C., Barber, R M., Bhutta, Z. et al. (2016)
Global, regional, and national life expectancy, all-cause mortality, and cause-specific mortality
for 249 causes of death, 1980-2015: a systematic analysis for the Global Burden of Disease
Study 2015.
The Lancet, 388(10053): 1459-1544
https://doi.org/10.1016/S0140-6736(16)31012-1
Access to the published version may require subscription.
N.B. When citing this work, cite the original published paper.
Permanent link to this version:
Global, regional, and national life expectancy, all-cause
mortality, and cause-specifi c mortality for 249 causes of
death, 1980–2015: a systematic analysis for the Global
Burden of Disease Study 2015
GBD 2015 Mortality and Causes of Death Collaborators*
Summary
Background
Improving survival and extending the longevity of life for all populations requires timely, robust evidence
on local mortality levels and trends. The Global Burden of Disease 2015 Study (GBD 2015) provides a comprehensive
assessment of all-cause and cause-specifi c mortality for 249 causes in 195 countries and territories from 1980 to 2015.
These results informed an in-depth investigation of observed and expected mortality patterns based on
sociodemographic measures.
Methods
We estimated all-cause mortality by age, sex, geography, and year using an improved analytical approach
originally developed for GBD 2013 and GBD 2010. Improvements included refi nements to the estimation of child and
adult mortality and corresponding uncertainty, parameter selection for under-5 mortality synthesis by spatiotemporal
Gaussian process regression, and sibling history data processing. We also expanded the database of vital registration,
survey, and census data to 14 294 geography–year datapoints. For GBD 2015, eight causes, including Ebola virus
disease, were added to the previous GBD cause list for mortality. We used six modelling approaches to assess
cause-specifi c mortality, with the Cause of Death Ensemble Model (CODEm) generating estimates for most causes. We used
a series of novel analyses to systematically quantify the drivers of trends in mortality across geographies. First, we
assessed observed and expected levels and trends of cause-specifi c mortality as they relate to the Socio-demographic
Index (SDI), a summary indicator derived from measures of income per capita, educational attainment, and fertility.
Second, we examined factors aff ecting total mortality patterns through a series of counterfactual scenarios, testing the
magnitude by which population growth, population age structures, and epidemiological changes contributed to shifts
in mortality. Finally, we attributed changes in life expectancy to changes in cause of death. We documented each step
of the GBD 2015 estimation processes, as well as data sources, in accordance with Guidelines for Accurate and
Transparent Health Estimates Reporting (GATHER).
Findings
Globally, life expectancy from birth increased from 61·7 years (95% uncertainty interval 61·4–61·9) in 1980
to 71·8 years (71·5–72·2) in 2015. Several countries in sub-Saharan Africa had very large gains in life expectancy from
2005 to 2015, rebounding from an era of exceedingly high loss of life due to HIV/AIDS. At the same time, many
geographies saw life expectancy stagnate or decline, particularly for men and in countries with rising mortality from
war or interpersonal violence. From 2005 to 2015, male life expectancy in Syria dropped by 11·3 years (3·7–17·4), to
62·6 years (56·5–70·2). Total deaths increased by 4·1% (2·6–5·6) from 2005 to 2015, rising to 55·8 million
(54·9 million to 56·6 million) in 2015, but age-standardised death rates fell by 17·0% (15·8–18·1) during this time,
underscoring changes in population growth and shifts in global age structures. The result was similar for
non-communicable diseases (NCDs), with total deaths from these causes increasing by 14·1% (12·6–16·0) to 39·8 million
(39·2 million to 40·5 million) in 2015, whereas age-standardised rates decreased by 13·1% (11·9–14·3). Globally, this
mortality pattern emerged for several NCDs, including several types of cancer, ischaemic heart disease, cirrhosis, and
Alzheimer’s disease and other dementias. By contrast, both total deaths and age-standardised death rates due to
communicable, maternal, neonatal, and nutritional conditions signifi cantly declined from 2005 to 2015, gains largely
attributable to decreases in mortality rates due to HIV/AIDS (42·1%, 39·1–44·6), malaria (43·1%, 34·7–51·8),
neonatal preterm birth complications (29·8%, 24·8–34·9), and maternal disorders (29·1%, 19·3–37·1). Progress was
slower for several causes, such as lower respiratory infections and nutritional defi ciencies, whereas deaths increased
for others, including dengue and drug use disorders. Age-standardised death rates due to injuries signifi cantly
declined from 2005 to 2015, yet interpersonal violence and war claimed increasingly more lives in some regions,
particularly in the Middle East. In 2015, rotaviral enteritis (rotavirus) was the leading cause of under-5 deaths due to
diarrhoea (146 000 deaths, 118 000–183 000) and pneumococcal pneumonia was the leading cause of under-5 deaths
due to lower respiratory infections (393 000 deaths, 228 000–532 000), although pathogen-specifi c mortality varied by
region. Globally, the eff ects of population growth, ageing, and changes in age-standardised death rates substantially
diff ered by cause. Our analyses on the expected associations between cause-specifi c mortality and SDI show the
regular shifts in cause of death composition and population age structure with rising SDI. Country patterns of
Lancet 2016; 388: 1459–544 This online publication has been corrected. The corrected version first appeared at thelancet.com on January 5, 2017
See Editorial page 1447 See Comment pages 1448 and 1450
*Collaborators listed at the end of the Article
Correspondence to: Prof Christopher J L Murray, 2301 5th Avenue, Suite 600, Seattle, WA 98121, USA cjlm@uw.edu
See Online for infographic http://www.thelancet.com/gbd
Introduction
Comparable information about deaths and mortality
rates broken down by age, sex, cause, year, and geography
provides a starting point for informed health policy
debate. However, generating meaningful comparisons of
mortality involves addressing many data and estimation
challenges, which include reconciling marked
dis-crepancies in cause of death classifi cations over time and
across populations; adjusting for vital registration system
data with coverage and quality issues; appropriately
synthesising mortality data from cause-specifi c sources,
such as cancer registries, and alternative cause of death
identifi
cation tools, such as verbal autopsies; and
developing robust analytical strategies to estimate
cause-specifi c mortality amid sparse data.
1–6The annual Global
Burden of Disease (GBD) analysis provides a standardised
approach to addressing these problems, thereby
enhancing the capacity to make meaningful comparisons
across age, sex, cause, time, and place.
Previous iterations of the GBD study showed
substantial reductions in under-5 mortality, largely
driven by decreasing rates of death from diarrhoeal
diseases, lower respiratory infections, malaria, and,
in several countries, neonatal conditions and
premature mortality (measured as years of life lost [YLLs]) and how they diff er from the level expected on the basis of
SDI alone revealed distinct but highly heterogeneous patterns by region and country or territory. Ischaemic heart
disease, stroke, and diabetes were among the leading causes of YLLs in most regions, but in many cases, intraregional
results sharply diverged for ratios of observed and expected YLLs based on SDI. Communicable, maternal, neonatal,
and nutritional diseases caused the most YLLs throughout sub-Saharan Africa, with observed YLLs far exceeding
expected YLLs for countries in which malaria or HIV/AIDS remained the leading causes of early death.
Interpretation
At the global scale, age-specifi c mortality has steadily improved over the past 35 years; this pattern of
general progress continued in the past decade. Progress has been faster in most countries than expected on the basis
of development measured by the SDI. Against this background of progress, some countries have seen falls in life
expectancy, and standardised death rates for some causes are increasing. Despite progress in reducing
age-standardised death rates, population growth and ageing mean that the number of deaths from most
non-communicable causes are increasing in most countries, putting increased demands on health systems.
Funding
Bill & Melinda Gates Foundation.
Copyright
© The Author(s). Published by Elsevier Ltd. This is an Open Access article under the CC BY license.
Research in context
Evidence before this study
In 2012, the Global Burden of Disease 2010 study was published,
providing results from the fi rst complete revision of the Global
Burden of Disease (GBD) since the fi rst assessment in 1993. The
study reported on mortality and causes of death between 1990
and 2010 in 187 countries. In response to demand for up-to-date
information on the health of populations to inform health policy
debates, annual updates of the GBD study are now prepared,
with the fi rst of these, the GBD 2013 study, published in 2015.
For the fi rst time, collaborative teams undertook subnational
assessments for China, Mexico, and the UK as part of this study.
Added value of this study
The GBD 2015 assessment of mortality and causes of death
provides new and more robust evidence on the health of
populations worldwide through the inclusion of subnational data
from an expanded group of countries, including Brazil, India,
Japan, Kenya, Saudi Arabia, South Africa, Sweden, and the USA, in
addition to updates for China, Mexico, and the UK. This study
complies with the Guidelines for Accurate and Transparent Health
Estimates Reporting (GATHER) recommendations. Estimation of
mortality levels, patterns, and distribution for several new causes,
including Ebola virus disease, further disaggregations of
carcinoma and leukaemia, motor neuron disease, and mortality
attributable to environmental heat and cold exposure have been
added for the GBD 2015 study. Furthermore, this analysis extends
the concept of sociodemographic status fi rst reported in GBD
2013, with important changes to computational methods,
resulting in a new Socio-demographic Index (SDI) for a more
robust positioning of countries and territories on the
development continuum.
Implications of all the available evidence
This study provides the most comprehensive assessment to date
of patterns and levels of mortality worldwide, expanding on
previous analyses by further investigating the main determinants
of epidemiological patterns and trends across geographies and
over time. The GBD 2015 study entails a complete reanalysis of
trends for each cause of death from 1990 to 2015; the time series
published here supersedes the results of the GBD 2013 study. The
expansion of geographic units, from 296 in GBD 2013 to 519 for
GBD 2015, is envisaged to continue so as to sustain comparability
over time and across all geographies. The comparison of
estimates of observed mortality levels with patterns expected
based on the SDI provides an in-depth understanding of national
health challenges and priority areas for intervention.
malnutrition.
7–11Non-communicable diseases (NCDs)
and injuries claimed increasingly more lives throughout
the world, although age-standardised death rates fell
for many causes and countries.
7Examination of
epidemiological convergence among high-income,
middle-income, and low-income countries showed the
importance of evaluating both absolute and relative
changes in mortality, as solely focusing on absolutes can
mask rising relative inequality among certain age groups
and causes. The GBD 2015 study expands on these
analyses by further evaluating the drivers of
epi-demiological patterns across countries and over time.
Such mortality trends are generally shaped by a
combination of factors, including changes in income per
capita, educational attainment, fertility, shifts in clinical
care and health system responsiveness, emergent health
threats such as disease outbreaks or increasing rates of
obesity, and geography-specifi c health contexts. An
in-depth understanding of national health gains and priority
areas for intervention can be provided by comparing
estimates of expected mortality patterns. These results
are of particular importance amid debates on fi nancing
and policy options for the newly adopted Sustainable
Development Goals, which include both ambitious
targets for maternal and child health and a much broader
health agenda also encompassing NCDs and injuries.
The GBD 2010 study presented results for
187 countries, encompassing all those with a population
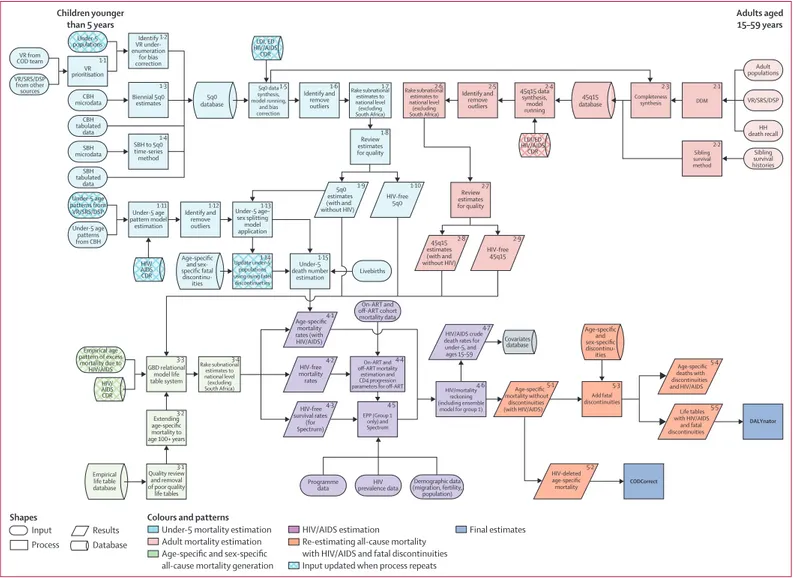
Figure 1: Estimation of all-cause mortality by age and sex and HIV/AIDS incidence, prevalence, and mortality for GBD 2015
Data and analyses are indicated by shape and the fl ow chart is colour coded by major estimation component. The process depicted is performed twice to bring in updated under-5 population estimates and crude death rates due to HIV/AIDS. The inputs that are updated in the second run of the process are shown by patterned boxes in this fl ow chart. Because of the very large and changing eff ects of HIV/AIDS on all-cause mortality in several countries with large HIV epidemics and limited data on all-cause mortality, the estimation of HIV/AIDS and all-cause mortality are closely linked and are presented jointly here. GBD=Global Burden of Disease. 5q0=probability of death from birth to age 5 years. 45q15=probability of death from age 15 to 60 years. ART=antiretroviral therapy. CBH=complete birth histories. CDR=crude death rate. COD=causes of death. DSP=disease surveillance points. ED=educational attainment in years per capita above age 15 years and mother’s educational attainment in years per capita for children younger than 5 years. EPP=Estimation and Projection Package. HIV CDR=crude death rate due to HIV/AIDS. LDI=lagged distributed income per capita. SBH=summary birth history. SRS=Sample Registration System. VR=vital registration.
HIV/ AIDS CDR Covariates database Children younger than 5 years Adults aged 15–59 years VR from COD team CBH microdata Under-5 populations VR/SRS/DSP from other sources Under-5 age patterns from VR/SRS/DSP VR prioritisation 1·1 Identify VR under-enumeration for bias correction 1·2 Biennial 5q0 estimates 1·3 SBH to 5q0 time-series method 5q0 estimates (with and without HIV) 1·4 Under-5 age pattern model estimation 1·11 Livebirths On-ART and off-ART cohort mortality data HIV prevalence data Programme data Demographic data (migration, fertility, population) 5q0 database 45q15 database Age-specific and sex-specific fatal discontinu-ities Identify and remove outliers 1·12 5q0 data synthesis, model running, and bias correction 1·5 45q15 data synthesis, model running 2·4 Completeness synthesis 2·3 DDM 2·1 Sibling survival method 2·2 Identify and remove outliers 1·6 Identify and remove outliers 2·5 Rake subnational estimates to national level (excluding South Africa) 1·7 Rake subnational estimates to national level (excluding South Africa) 2·6 Review estimates for quality 1·8 1·9 HIV-free 5q0 1·10 Age-specific mortality rates (with HIV/AIDS) 4·1 HIV/AIDS crude death rates for under-5, and ages 15–59 4·7 HIV-free mortality rates 4·2 HIV-free survival rates (for Spectrum) 4·3 45q15 estimates (with and without HIV) Review estimates for quality 2·7 2·8 HIV-free 45q15 2·9 Under-5 age– sex splitting model application Under-5 death number estimation 1·13 1·15 CBH tabulated data VR/SRS/DSP Sibling survival histories Adult populations HH death recall SBH microdata SBH tabulated data Under-5 age patterns from CBH HIV/ AIDS CDR Empirical age pattern of excess mortality due to HIV/AIDS GBD relational model life table system 3·3 Extending age-specific mortality to age 100+ years 3·2 Quality review and removal of poor quality life tables 3·1 Empirical life table database Age-specific and sex-specific discontinu-ities Age-specific mortality without discontinuities
(with HIV/AIDS) Life tables
with HIV/AIDS and fatal discontinuities 5·1 Rake subnational estimates to national level (excluding South Africa) 3·4 On-ART and off-ART mortality estimation and CD4 progression parameters for off-ART
4·4 EPP (Group 1 only) and Spectrum 4·5 HIV/mortality reckoning (including ensemble
model for group 1) 4·6 LDI, ED HIV/AIDS CDR Update under-5 populations using using fatel discontinueties 1·14 LDI/ED HIV/AIDS CDR Add fatal discontinuities 5·3 5·5 Age-specific deaths with discontinuities and HIV/AIDS 5·4 HIV-deleted age-specific mortality 5·2 CODCorrect DALYnator Input Process Shapes
Under-5 mortality estimation Adult mortality estimation Age-specific and sex-specific all-cause mortality generation Colours and patterns
HIV/AIDS estimation Re-estimating all-cause mortality with HIV/AIDS and fatal discontinuities Input updated when process repeats
Final estimates Results
greater than 50 000 in the year 2000.
12In the GBD 2013
study, collaborative teams produced subnational
assessments for the UK, Mexico, and China, expanding
the number of geographies included in the GBD
analysis to 296.
7,13–15The value of such subnational
assessments to local decision makers
16has driven
further geographical disaggregation for GBD 2015
including in Brazil, India, Japan, Kenya, Saudi Arabia,
South Africa, Sweden, and the USA, in addition to
updates for China, Mexico, and the UK. The expansion
of the geographical units in the GBD studies will
continue in a way that will sustain the comparability
over time for the period 1990 to present and across all
geographic entities.
As with all revisions of the GBD, the GBD 2015 study
provides an update for the entire time series from
1990 to 2015 based on newly identifi ed data sources
released or collected since GBD 2013. In response to
published commentaries and unpublished seminars
and communications about GBD methods, various
methodological refi nements have been implemented.
17,18Additionally, in the GBD 2015 cycle, a major eff ort
towards data and code transparency has been made. As
with each GBD cycle, the full time series published here
supersedes previous GBD studies. This detailed
assessment of causes of death allows the exploration of
key questions including what are the leading causes of
deaths in each geography, which causes are increasing or
decreasing, what is the expected pattern of change in
causes of death with the epidemiological transition and
how does this expected pattern over time diverge across
geographies.
Methods
Overview
GBD employs various analytical tools and a diverse set of
data sources to generate comparable estimates of deaths
and mortality rates broken down by age, sex, cause, year,
and geography. Multiple publications show more detail
on the various aspects of the methods.
7,8,12,19Part 1 of the
methods appendix (pp 4–51)
is a structured and succinct
explanation of each step. Figure 1 shows all of the inputs,
analytical processes, and outputs from the analysis of
all-cause mortality and HIV/AIDS mortality, included
because of its important eff ects on all-cause mortality in
countries with large HIV epidemics, and fi gure 2 does
the same for cause-specifi c mortality. Each input or
process is numbered for reference, with part 2 of the
methods appendix (pp 52–70)
providing explanation for
each step. The GBD analytical approach to estimation is
guided by standardised solutions to some general
analytical problems: inconsistent case defi nitions or
coding over time or across geographies; missing data;
confl icting data for the same year and geography;
and population groups (eg, the poor, minorities,
and vulnerable groups) who are often missed in
administrative data sources. In this Article, we provide
only a very high-level summary. This analysis adheres to
the new Guidelines for Accurate and Transparent Health
Estimates Reporting (GATHER) proposed by the World
Health Organization (WHO) and others, which includes
recommendations on documentation of data sources,
estimation methods, and statistical analysis.
20Table 1
shows the precise ways in which we have adhered to each
element of the GATHER agreement.
Geographic units
We have organised geographies into a set of hierarchical
categories: seven super-regions; 21 regions nested
within the seven super-regions; and 195 countries and
territories nested within the 21 regions (table 2). Details
on the classifi cation of each geographical unit into each
level of this hierarchy are provided in the methods
appendix (pp 670–83). Compared with GBD 2013, we
have added seven territories—American Samoa,
Bermuda, Greenland, Guam, the Northern Mariana
Islands, Puerto Rico, and the Virgin Islands—because
of the availability of high-quality vital registration data.
These territories were not previously included in the
national totals of the USA, UK, or Denmark, and were
included only in GBD 2013 regional totals. We have
further disaggregated data for selected countries or
territories into subnational units: 26 states and one
district for Brazil, 34 provinces and municipalities for
China, 31 states and union territory groupings for India
that include 62 rural and urban units, 47 prefectures for
Japan, 47 counties for Kenya, 32 states and districts
for Mexico, 13 regions for Saudi Arabia, nine provinces
for South Africa, two regions for Sweden, 13 regions for
the UK (Northern Ireland, Scotland, Wales, England,
and nine subregions of England), and 51 states and
districts for the USA. At the fi rst subnational unit level,
we have 256 geographic units. Subnational level 1
geographies in the GBD 2015 analysis include countries
that have been subdivided into the fi rst subnational
level, such as states or provinces. The subnational
level 2 category applies only to India and England. In
this Article we present national, territory, and previously
published subnational units in the UK.
13Figure 2: Development of the GBD 2015 cause of death database Figure shows (A) diff erent strategies used to model diff erent causes and to (B) combine them into a consistent set of cause-specifi c deaths for each location, age, sex, and year. Data and analytical processes are indicated by shape and the fl ow chart is colour coded by major estimation component. GBD=Global Burden of Disease. BTL=basic tabulation list. CDC=Center for Disease Control and Prevention. COD=cause of death. CODEm=Cause Of Death Ensemble model. CR=cancer registry. CRS=civil registration system. DSP=disease surveillance points. ICD=International Classifi cation of Diseases. MI=mortality/incidence ratio. MCCD=medical certifi cation of causes of death. MM=maternal mortality. MMR=maternal mortality ratio. MMS=maternal mortality surveillance. PAF=population-attributable fraction. SCD=survey of causes of death. SEER=Surveillance, Epidemiology, and End Results Program. SRS=Sample Registration System. SR MAD=super-region median average deviation. ST-GPR=spatiotemporal Gaussian process regression. VA=verbal autopsy. VR=vital registration. YLL=years of life lost. See Online for appendices
ICD7A with complete age
ICD8-detail VR
ICD defined codes and expert opinion ICD9-detail VR ICD10-detail VR China CDC VR China DSP ICD9 China DSP ICD10 Russia ICD9-TAB Russia ICD10-TAB ICD9-USSR-TAB India MCCD ICD9 India MCCD ICD10 India CRS India SCD India SRS ICD10 VA INTER VA Indonesia VA Other VA Survey/census maternal MMR MM surveillance China MMS China Child Surveillance Survey/census injuries Police records Cancer Registry ICD10-TAB ICD9-BTL(TAB) GBD age–sex restrictions by cause Restrictions from ICD codes (1.1) Disaggregation (1.2) State splitting (2) Map to GBD cause list (1.3) Region–sex– cause to state– urbanicity– sex–age– cause algorithm (3.1) Generate global age–sex weights by cause (4) Correct age–sex violations (5.1) Redistribute HIV-related garbage (5) Redistribution (5.2) Regress garbage codes vs non-garbage codes (6) HIV misclassification correction (9) Drop VR country–years or mark as non-representative based on completeness (3) Age–sex splitting (1.4) Calculate non-maternal deaths Formatted detail VR Formatted TAB VR Source-specific maps Mapped high-quality VR with complete age (1) Standardise input data (2.1) India urban/rural splitting Mapped VR with incomplete age or low completeness Formatted India MCCD Global age–sex weights by cause Data with complete age distribution Non-VR with corrected age–sex violations specific packages VR before redistribution Redistributed VR Source-specific proportional packages Regression packages specific fixed proportion packages Redistributed VR with low HIV prevalence HIV-corrected VR, not China CDC+DSP All-cause mortality sent to mortality Formatted India SRS Complete formatted data Survey/census maternal, MMR, MM surveillance formatted data maternal data sources Data sources excluding sibling history and census All HIV-free and free data aggregated Aggregated VA, VR, and cancer registry VR and CR VA Maternal with no HIV in denominator Maternal data sources Maternal requiring spectrum adjustment Maternal sibling history and census Compiled data excluding VR, VA, and CR Noise reduced, compiled VR and CR Noise reduced, compiled VA MI ratio model estimates Mapped India CRS Mapped India SCD Mapped non-VR Livebirths
and envelope (GBD etimate)Population DDM results from mortality (VR completeness) Population (GBD estimate) Population (GBD estimate) Population (GBD estimate) Literature reviews/ multiple COD/
expert opinion misclassifiedList of HIV-candidate causes
Review VR age pattern for HIV epidemic Global relative age pattern by cause (2.2) State splitting Redistributed non-VR HIV corrected garbage codes and all redistributed garbage codes All nationally and subnationally representative data HIV-corrected VR, only China CDC+DSP (7) Scale strata to province (11) Remove shocks and HIV/ AIDS maternal adjustments (11.3) HIV/AIDS correction of sibling history, census, and survey data (11.4) HIV/AIDS correction of other maternal mortality data Combine MI estimates with best incidence data Map mortality data to GBD cause list Combine matching incidence and mortality data Model selection based on out of sample RMSE Modelling ST-GPR Zeta (data): 0·9 Zeta (no data): 0·5
Omega: 2 Lambda (data): 1 Lambda (no data): 3
Scale: Amplitude: SR MAD (11.2) Remove HIV/AIDS deaths from maternal mortality sources (11.1) Remove HIV/AIDS, shocks from denominator HIV/AIDS in cause list
(10) Cause aggregation (5.3) VA anaemia adjustment (8) Restrictions post redistribution VR Non-VA Non-VR VA GBD 2013 severe anaemia aetiologies distribution DDM results from mortality (VR completeness)
A
B
HIV/AIDS deaths from GBD estimates Envelope with HIV/AIDS PAFs (12.1) VR and CR noise reduction (12.2) VA noise reduction Retain best incidence data ICD10 subtotal disaggregation Redistribute cancer data Cause disaggre-gation Outlier MI data Retain best matched MI data Linear step models with validation (80/20) Map incidence data using non-fatal cause list Age–sex splitting COD database Cancer mortality Source-specific maps Cancerincidence mortality Cancer
Disaggregated cancer incidence Disaggregated cancer mortality COD age–sex weights by cause for mortality Proportions from C15, NORDCAN, and SEER for
incidence Cancer registry data:
contains incidence and mortality data (mortality data mostly from VR)
Prevalence-based models Sub-cause proportion models Natural history models Negative binomial models CODEm models Fatal discontinuities HIV/AIDS model Vital registration/ verbal autopsy Intervention coverage Covariates Negative binomial regression models
Case fatality rate from published studies
Case fatality rate metaregression Model-based geostatistics Case notifications Covariates Incidence regression model Published surveys and scientific literature on disease prevalence Vital registration in select high-income countries Excess mortality estimation DisMod-MR 2.1 Published surveys on aetiology Scientific literature data on aetiology Vital registration DisMod-MR 2.1 CoDCorrect CODEm 167 causes Death estimation incidence × case fatality rate Cause of death database Covariates Add fatal discontinuities and HIV/AIDS Post-CoDCorrect death estimates by age, sex, year
geography
YLLs for each disease and injury by age, sex, year, geography
Reference life table (with HIV/AIDS and fatal discontinuities) EPP/Spectrum
Fatal
discontinuities discontinuitiesFatal model data HIV/AIDS programme data and UNAIDS files Key for A and B:
Input Process
Shapes
Colours and patterns of COD process
Results Database Data source Standardise input Mapping Age-sex splitting Correct age-sex violations Redistribution HIV correction Scale China stratas Restrictions post-redistribution
VR completeness Cause aggregation Remove shocks and HIV/AIDS Noise reduction Cancer mortality process GBD input Data flow Data input to
GBD cause list
The GBD cause list is the crucial organising framework
for the analysis of causes of death and premature
mortality, as well as disease incidence and prevalence
and years lived with disability.
21The GBD cause list has
evolved during the 25 years of the GBD study to become
a list of causes that have public health and medical care
importance either because they are major causes of lost
health or because of policy relevance.
7,21–24Because
diff erent levels of cause aggregation are appropriate for
diff erent purposes and users, the GBD cause list is
organised hierarchically (table 2). At each level of the
cause hierarchy, the set of causes is mutually exclusive
and collectively exhaustive.
21At the fi rst level of the
cause list, there are three broad causes: communicable,
maternal, neonatal, and nutritional diseases; NCDs;
and injuries. At the second level of the hierarchy, these
three causes are broken down into 21 cause groups
such as neoplasms (cancers) or cardiovascular diseases.
Levels 3 and 4 of the cause list provide more
disaggregated causes. Based on policy interest and by
approval of the GBD Scientifi c Council, we have added
eight causes to the GBD cause list: Ebola virus disease,
motor neuron disease, environmental heat and cold
GATHER checklist item Description of compliance Reference
Objectives and funding
1 Defi ne the indicators, populations, and time periods for which estimates were made
Narrative provided in paper and methods appendix describing indicators, defi nitions, and populations
Main text (Methods—Geographic units, GBD cause list, Time periods) and methods appendix (pp 4–70)
2 List the funding sources for the work Funding sources listed in paper Summary (Funding)
Data inputs
For all data inputs from multiple sources that are synthesised as part of the study
3 Describe how the data were identifi ed and how the data were accessed Narrative description of data seeking methods provided
Main text (Methods) and methods appendix (pp 4–283)
4 Specify the inclusion and exclusion criteria; identify all ad-hoc exclusions Narrative about inclusion and exclusion criteria by data type provided
Main text (Methods) and methods appendix (pp 4–283)
5 Provide information on all included data sources and their main characteristics; for each data source used, report reference information or contact name or institution, population represented, data collection method, years of data collection, sex and age range, diagnostic criteria or measurement method, and sample size, as relevant
An interactive, online data source tool that provides metadata for data sources by component, geography, cause, risk, or impairment has been developed
Online data citation tools
6 Identify and describe any categories of input data that have potentially important biases (eg, based on characteristics listed in item 5)
Summary of known biases by cause included in methods appendix
Methods appendix (pp 4–283)
For data inputs that contribute to the analysis but were not synthesised as part of the study
7 Describe and give sources for any other data inputs Included in online data source tool Online data citation tools
For all data inputs
8 Provide all data inputs in a fi le format from which data can be effi ciently extracted (eg, a spreadsheet as opposed to a PDF), including all relevant metadata listed in item 5; for any data inputs that cannot be shared due to ethical or legal reasons, such as third-party ownership, provide a contact name or the name of the institution that retains the right to the data
Downloads of input data available through online tools, including data visualisation tools and data query tools; input data not available in tools will be made available upon request
Online data visualisation tools, data query tools, and the Global Health Data Exchange
Data analysis
9 Provide a conceptual overview of the data analysis method; a diagram may be helpful
Flow diagrams of the overall methodological processes, as well as cause-specifi c modelling processes, have been provided
Main text (Methods, fi gures 1 and 2) and methods appendix (pp 4–287)
10 Provide a detailed description of all steps of the analysis, including mathematical formulae; this description should cover, as relevant, data cleaning, data pre-processing, data adjustments and weighting of data sources, and mathematical or statistical models
Flow diagrams and corresponding methodological write-ups for each cause, as well as the demographics and causes of death databases and modelling processes, have been provided
Main text (Methods, fi gures 1 and 2) and methods appendix (pp 4–287)
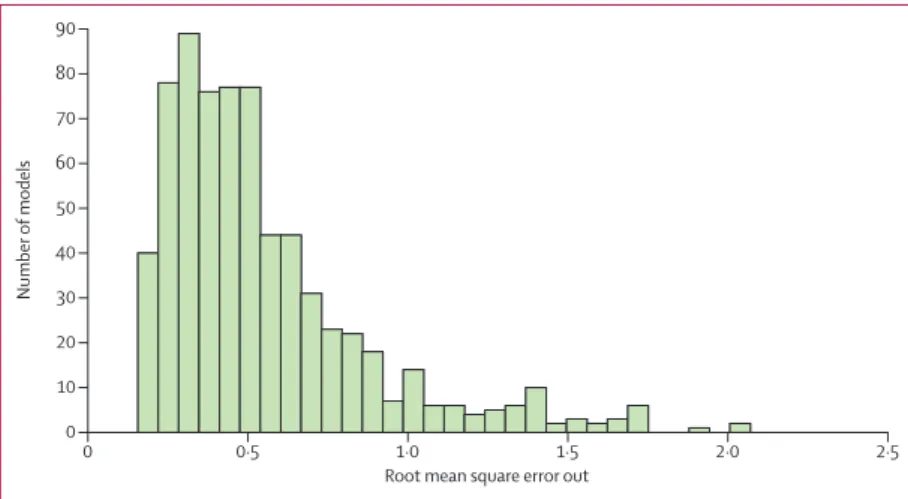
11 Describe how candidate models were evaluated and how the fi nal models were selected
Provided in the methodological write-ups Methods appendix (pp 71–283)
12 Provide the results of an evaluation of model performance, if done, as well as the results of any relevant sensitivity analysis
Provided in the methodological write-ups Methods appendix (pp 71–283)
13 Describe methods for calculating uncertainty of the estimates; state which sources of uncertainty were, and were not, accounted for in the uncertainty analysis
Provided in the methodological write-ups Methods appendix (pp 71–283)
14 State how analytic or statistical source code used to generate estimates can be accessed
Access statement provided Code is provided in an online repository
(Table 1 continues on next page)
For the data citation tools see http://ghdx.healthdata.org/gbd-data-input-sources For the data visualisation tools see http://www.healthdata.org/
results/data-visualizations For the data query tools see http://ghdx.healthdata.org/gbd-data-tool For the Global Health Data Exchange see http://ghdx. healthdata.org/
exposure, squamous-cell carcinoma, acute lymphoid
leukaemia, chronic lymphoid leukaemia, acute myeloid
leukaemia, and chronic myeloid leukaemia. Bulimia
nervosa has also been added as a cause of death. In
total, there are now three causes at Level 1, 21 at Level 2,
166 at Level 3, and 261 at Level 4. Some causes, such as
acne, medication overuse headache, and cutaneous
leishmaniasis, are not considered causes of death
according to the rules of the International Classifi cation
of Diseases (ICD), so the number of causes included in
this analysis of causes of death is three at Level 1, 21
at Level 2, 144 at Level 3, and 200 at Level 4. The
full GBD cause list, including those for which we
estimate deaths, is available in the methods appendix
(pp 684–90).
Time periods
Because of the greater availability of data on all-cause
mortality than cause-specifi c mortality, the all-cause
mortality analysis for GBD 2015 covered 1970 to 2015.
The cause of death analysis of GBD 2015 covered 1980 to
2015. A complete set of age-specifi c, sex-specifi c,
cause-specifi c, and geography-cause-specifi c death numbers and rates
were generated. We present results covering diff erent
periods. However, for the main global and national
results, we have focused on trends in the past decade,
from 2005 to 2015, and detailed fi ndings in 2015. Data
visualisation tools are available online and provide results
for each year from 1990 to 2015.
All-cause mortality and HIV/AIDS mortality
Because of the very large and changing eff ects of
HIV/AIDS on all-cause mortality in several countries
with large HIV epidemics and
scarce data on all-cause
mortality, especially in eastern and southern Africa,
11the
estimation of HIV/AIDS mortality and all-cause mortality
are closely linked and presented jointly in fi gure 1. We
divided the estimation eff
ort into fi ve distinct
components: estimation of under-5 mortality rate (5q0);
estimation of the adult mortality rate (45q15); age-specifi c
mortality estimation; HIV/AIDS mortality estimation;
and addition of the eff ects of events such as wars,
pandemics, and disasters, which can cause abrupt
discontinuities in death numbers (fatal discontinuities).
Because of the interdependencies in the estimation of
HIV/AIDS incidence, prevalence, and mortality and
all-cause mortality, the estimation steps shown in fi gure 1
were repeated, with the HIV/AIDS crude death rates
produced in step 4.7 used as covariates in steps 1.5, 1.11,
2.4, and 3.3 in the fl ow diagram.
Under-5 mortality estimation
Seven types of primary data contributed to the
estimation process (oval shapes in fi gure 1). The most
important set of inputs were the data for estimating the
overall level of under-5 mortality (5q0) that were
obtained from vital registration systems, surveys, and
censuses. Figure 3A provides information about the
proportion of the 519 geographies included in the
analysis for which data were available in each year from
1980 to 2015. Because of lags in reporting of both vital
registration data and the release of household survey or
census data, the availability of data was much lower for
2014 and 2015 than for previous years. Diff erent data
types, such as summary or complete birth histories,
were processed to yield estimates for each year of the
under-5 death rate; country-specifi c and year-specifi c
details of the measurements are provided in the
methods appendix (pp 4–19). Figure 3B shows the
nature of the data and estimation process for under-5
mortality using the example of Zambia, as well as the
uncorrected and bias-adjusted datapoints for each
GATHER checklist item Description of compliance Reference
(Continued from previous page) Results and discussion
15 Provide published estimates in a fi le format from which data can be effi ciently extracted
GBD 2015 results are available through online data visualisation tools, the Global Health Data Exchange, and the online data query tool
Main text, methods appendix, and online data tools (data visualisation tools, data query tools, and the Global Health Data Exchange)
16 Report a quantitative measure of the uncertainty of the estimates (eg, uncertainty intervals)
Uncertainty intervals are provided with all results
Main text, methods appendix, and online data tools (data visualisation tools, data query tools, and the Global Health Data Exchange)
17 Interpret results in light of existing evidence; if updating a previous set of estimates, describe the reasons for changes in estimates
Discussion of methodological changes between GBD rounds provided in the narrative of the Article and methods appendix
Main text (Methods and Discussion) and methods appendix (pp 4–287)
18 Discuss limitations of the estimates; include a discussion of any modelling assumptions or data limitations that aff ect interpretation of the estimates
Discussion of limitations provided in the narrative of the main paper, as well as in the methodological write-ups in the methods appendix
Main text (Limitations) and methods appendix (pp 4–283)
GBD 2015=Global Burden of Disease 2015 Study. GATHER=Guidelines for Accurate and Transparent Health Estimates Reporting.
Table 1: GATHER checklist with description of compliance and location of information in the GBD 2015 mortality and causes of death study
For the online data visualisation tools see http://vizhub.healthdata.org/ gbd-compare
For the online repository see http://ghdx.healthdata.org/ global-burden-disease-study-2015
source. We used spatiotemporal Gaussian process
regression to synthesise the sources and simultaneously
correct for biases in specifi c source types.
8Bias
corrections were made by comparison to reference
sources, which for Zambia were the Demographic and
Health Surveys. Further details of this estimation
process are provided in the methods appendix (pp 4–19).
Because there are many sources for measuring under-5
mortality, such as summary birth histories from censuses
and surveys, that do not provide sex and specifi c age
group detail, we fi rst estimated under-5 mortality and
then split it into mortality for four age groups: early
neonatal (0–6 days), late neonatal (7–28 days),
post-neonatal (29–364 days), and ages 1–4 years. Splitting into
these age groups was based on a statistical model using
the analysis of available data that provide breakdowns
by age and sex. Figure 3C shows the availability by
country–year of data used to build the model to estimate
mortality for specifi c age–sex groups younger than age
5 years. We modelled the ratio of male-to-female
probability of death from birth to age 5 years as a function
of both sexes’ combined under-5 mortality rate and
country and regional random eff
ects. We further
disaggregated sex-specifi c probability of death between
birth and age 5 by modelling the ratio between
age-and-sex-specifi c probability of deaths in the early neonatal,
late neonatal, post-neonatal, and 1–4 year age groups and
sex-specifi c probability of death between birth and age
5 years. This model allowed for the association between
these age-and-sex-specifi c probabilities and the under-5
death rate to be non-linear, and included other covariates
consisting of the death rate due to HIV/AIDS in children
younger than 5 years, average years of schooling among
females of reproductive age, and country and regional
random eff ects. More details, including the equations are
provided in the methods appendix (p 18). Figure 3D
shows an example of the empirical fi t for the
post-neonatal period for Bangladesh. This model was applied
to all countries to generate the under-5 estimates for each
geography–year.
With the estimated mortality by detailed age group, we
generated both deaths and population estimates for the
respective age groups for each location, sex, and year.
Adult mortality estimation
Measurements of adult mortality (45q15) were mainly
derived from vital registration data and household surveys
that ask about the birth and death of siblings.
25In a
smaller set of cases, information was obtained from
censuses or surveys about household deaths in a defi ned
interval before the interview. Figure 4A shows the number
of geographies for which data in each year were available
for adult mortality estimation. Vital registration data were
assessed for completeness with death distribution
methods optimised for performance.
26,27We generated a
best estimate of the completeness of vital registration in
each geography over time by combining estimated
completeness of registration for under-5 deaths with the
results for diff erent intercensal periods of the application
of three death distribution methods. These sources were
combined by use of spatiotemporal Gaussian process
regression—details are provided in the methods appendix
(p 21). Data from sibling histories were corrected for
known biases, including selection bias, zero reporter bias,
and recall bias.
7,25Our sibling history method can also
deal with data sparsity in many sibling survival modules
(ie, sibling history questions and variables from surveys).
The predictive validity of the sibling history analytical
methods has been assessed with simulated data and
shown to be unbiased.
25Additionally, we compared
estimates of adult mortality rates from sibling survival
data with completeness-adjusted vital registration data in
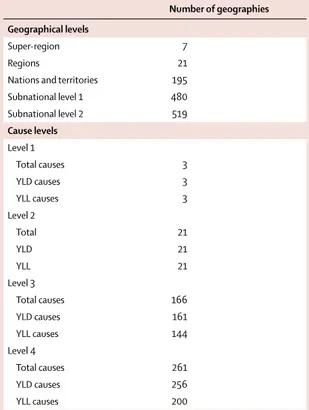
Number of geographies Geographical levels
Super-region 7
Regions 21
Nations and territories 195
Subnational level 1 480 Subnational level 2 519 Cause levels Level 1 Total causes 3 YLD causes 3 YLL causes 3 Level 2 Total 21 YLD 21 YLL 21 Level 3 Total causes 166 YLD causes 161 YLL causes 144 Level 4 Total causes 261 YLD causes 256 YLL causes 200
Nations and territories includes countries, territories, and non-sovereign states. Subnational level 1 includes countries that, in the GBD analysis, have been subdivided into the fi rst subnational level such as states or provinces. Subnational level 2 applies only to India and England. In India, states have been divided into urban and rural units. England has been divided into nine regions. For each level, the number of geographies includes the geographies at that level plus the number of most-detailed geographies at each higher level such that at each level of the hierarchy, all geographies create a collectively exhaustive and mutually exclusive set covering the world. Likewise, the GBD cause list is mutually exclusive and collectively exhaustive. The three Level 1 GBD causes consist of communicable, maternal, neonatal, and nutritional disorders; non-communicable diseases; and injuries. Level 2 causes consist of 21 cause groups, such as neoplasms and cardiovascular diseases. Levels 3 and 4 consist of disaggregated causes, such as liver cancer and cerebrovascular disease (Level 3), and liver cancer due to hepatitis C and ischaemic stroke (Level 4). GBD=Global Burden of Disease. YLD=years lived with disability. YLL=years of life lost.
Table 2: Number of geographies and causes at each hierarchical level for GBD 2015
countries from which both sources are available and
found no systematic biases from sibling survival method
(methods appendix p 292).
7,25,26We synthesised vital
registration data corrected for completeness and adjusted
sibling history data into a best time series estimate of
adult 45q15 using spatiotemporal Gaussian process
regression. Examples of the application of these steps in
three types of settings are shown in fi gure 4.
The spatiotemporal Gaussian process regression
method used to fi t the model to the available data
included lag distributed income per capita, educational
attainment, and the estimated HIV/AIDS death rate as
covariates. Because the estimation of the HIV/AIDS
death rate used the estimate of HIV-free mortality rate by
age and sex as an input, the entire estimation loop was
repeated once, which dealt with this interconnection.
Step 2.9 in fi gure 1 deals with situations in which
an inconsistency exists between the spatiotemporal
Gaussian process regression-estimated adult mortality
rate and the separately estimated crude death rate due to
HIV/AIDS. When the HIV/AIDS death rate as estimated
from the natural history model is too high compared
with demographic sources, there is a risk that HIV-free
death rates are depressed to implausibly low levels. In
step 2.9, we scaled the HIV/AIDS crude death rate by
imposing a maximum proportion of deaths that can be
attributed to HIV/AIDS, as shown in our version of
UNAIDS’ Spectrum model, which estimates HIV/AIDS
prevalence and deaths by age and sex. Our adult mortality
estimation is for ages 15–60 years (45q15), but other adult
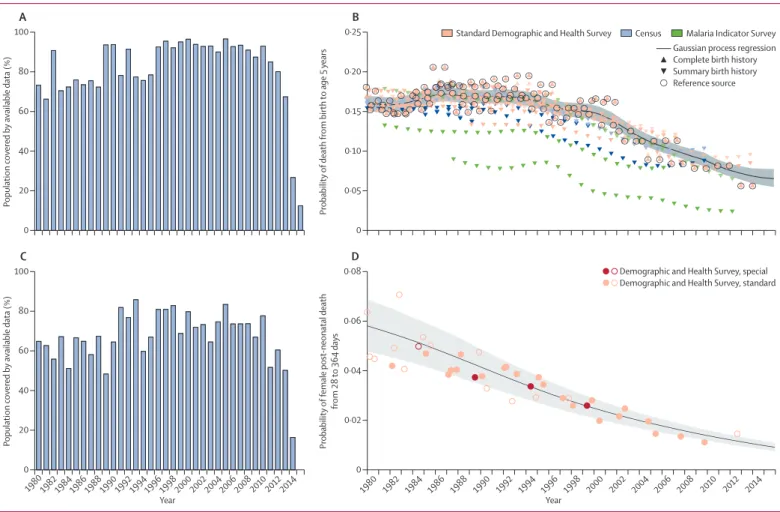
Figure 3: Examples of under-5 mortality data availability and estimation(A) Percentage of global under-5 population covered by under-5 mortality data for each year, 1980−2015. The percentage of under-5 population covered was calculated by dividing the population of children aged 0–4 years in locations covered by available under-5 mortality data by the total global under-5 population. Because of lags in reporting of both vital registration data and the release of household survey or census data, the availability of data was much lower for 2014 and 2015 than for previous years. (B) Country-specifi c example of data and under-5 mortality estimates in Zambia, 1980–2015. The black line shows Gaussian process regression fi t with 95% uncertainty interval shown in grey. Black circles denote reference data. Triangles denote complete birth history data. Inverted triangles denote summary birth history data. Transparent symbols are the data post-adjustment for non-sampling error. Hollow shapes represent data identifi ed as outliers. (C) Percentage of global under-5 population covered by under-5 age-specifi c and sex-specifi c data for each year, 1980–2015. The percentage of under-5 population covered was calculated by dividing the population of children aged 0–4 years in locations covered by available under-5 age-specifi c and sex-specifi c data by the total global under-5 population. Because of lags in reporting both vital registration data and the release of household survey or census data, the availability of data was much lower for 2014 than for previous years, and no data existed for 2015. (D) Country-specifi c example of probability of female post-neonatal mortality in Bangladesh, 1980–2015. Standard Demographic and Health Surveys generally include large population samples and standard sets of questions. Special Demographic and Health Surveys can survey smaller, more targeted populations, such as women who have given birth. The black line shows probability of death, with 95% uncertainty interval shown in grey. Solid circles represent data sources. Hollow circles represent outliers. The post-neonatal period is 28–364 days.
0 20 40 60 80 100 P opulation covered b y available data (%)
A
0 0·05 0·10 0·15 0·20 0·25 Probability ofdeath from birth
to age 5
years
B
Malaria Indicator Survey Standard Demographic and Health Survey
Gaussian process regression Complete birth history Summary birth history Reference source 1980 19821984198619881990 19921994199619982000 2002200420062008 2010 2012 2014 0 20 40 60 80 100 P opulation covered b y available data (%) Year
C
1982 1980 1984 1986 1988 1990 1992 1994 1996 1998 2000 2002 2004 2006 2008 2010 2012 2014 0 0·02 0·04 0·06 0·08 Probability of female post -neonatal death from 28 to 364 days YearD
Demographic and Health Survey, special Demographic and Health Survey, standard
age groups that can be calculated for other purposes
include 35q15 (ages 15–50 years, corresponding to the
reproductive age period), and 20q50 (ages 20–70 years).
Age-specifi c mortality
In demographic estimation, measures of child mortality,
adult mortality, or both are used alongside a model life
table system to predict age-specifi c mortality.
27–30The UN
mostly still uses the Coale-Demeny model life tables,
which were based on 192 empirical tables gathered
before 1963, and in a few cases they use the 33-year-old
UN Model Life Table for Developing Countries.
31,32Murray and colleagues
33developed the Modifi ed Logit
Model Life Table system that is used by WHO to estimate
age-specifi c mortality, which captures a much wider
range of age patterns of mortality through the year 2000.
The GBD approach uses three inputs to generate
age-specifi c mortality: 5q0, 45q15, and a relevant empirical
reference pattern of mortality by age.
7The reference in
the GBD system was selected on the basis of empirical
age patterns that are closest to the population in space
and time.
7The reference was developed with a database
of 16 507 age patterns of mortality from settings that meet
explicit inclusion criteria as described in the methods
appendix (pp 34–42). Table 3 shows a summary of the
availability of empirical age–sex patterns of mortality in
the GBD database.
To account for the eff ect of HIV/AIDS on the age
pattern of mortality, the GBD model life table system
for locations aff ected by HIV/AIDS and without
high-quality vital registration data used a two-step process
whereby we fi rst estimated an HIV-free age pattern of
mortality assuming that deaths due to HIV/AIDS were
removed. This was accomplished by use of the
HIV-free and without-fatal-discontinuity 5q0 and 45q15
estimates, crude death rates due to HIV/AIDS in age
Figure 4: Examples of adult mortality data availability and estimation(A) Percentage of global adult population covered by adult mortality data from vital registration systems, sibling survival surveys, sample registration systems, or censuses, 1980–2015. The percentage of available data was calculated by dividing the population of adults aged 15–59 years in locations covered by available adult mortality data by the total global population aged 15–49 years. Because of lags in reporting both vital registration data and the release of household survey or census data, the availability of data was much lower for 2014 than for previous years, and no data existed for 2015. Country-specifi c examples of (B) vital registration data and adult male mortality (45q15) estimation for a country with complete vital registration and large population (USA), 1980–2015; (C) vital registration data and adult male mortality (45q15) estimation for a country with complete vital registration and small population (Iceland), 1980–2015; and (D) sibling survival data and adult female mortality (45q15) estimation (Malawi), 1980–2015. Black line shows fi nal estimates of adult mortality among males or females in each country, with 95% uncertainty interval shown in grey. Squares show sibling survival histories. 45q15=probability of death from age 15 years to 60 years.
0 20 40 60 80 100 P opulation covered b y available data (%)
A
0 Key colours Key shapes 0·13 0·14 0·15 0·16 0·17 0·18 0·19 Probability ofdeath between ages 15 and 60 (45q15)
B
1980 1982 198419861988 1990 1992 199419961998 2000 2002 2004 2006 2008 2010 2012 2014 0 0·06 0·08 0·10 0·12 0·14Adult male mortality (45q15)
Year
C
1982 1980 1984 1986 1988 1990 1992 1994 1996 1998 2000 2002 2004 2006 2008 2010 2012 2014 0 0·2 0·4 0·3 0·5 0·6 0·7Adult female mortality (45q15)
Year
D
Final estimate Complete vital registration
Final estimate
Complete vital registration Demographic and Health Surveys
Final estimate
Adjusted: death distribution methods
Sibling survival history Unadjusted
Other Census
groups 0–4 and 15–59 years, and the methods detailed
in the methods appendix (p 44), which reconcile the
potential disconnect between HIV/AIDS mortality
implied in the spatiotemporal Gaussian process
regression estimates of all-cause mortality and those
estimated by the Estimation and Project Package
(EPP)-Spectrum. We then added the excess mortality due to
HIV/AIDS to specifi c age groups to match the
with-HIV/AIDS 5q0 and 45q15 by using the estimated age
pattern of excess mortality due to HIV/AIDS for
generalised and concentrated epidemics. These age
patterns of excess mortality were based on
ICD-10-coded vital registration data from various countries,
including high-income countries with good-quality vital
registration data and other middle-income nations that
are aff ected by HIV/AIDS such as South Africa,
Thailand, and Trinidad and Tobago. A list of country–
years for which we obtained the empirical age pattern
of HIV/AIDS excess mortality rate is shown in the
methods appendix (p 313).
Figure 5 shows examples of the life table system
estimates of age-specifi
c mortality compared with
observed patterns for males and females in France in
2011. There was a very close fi t between the estimated
age-specifi c mortality and the observed mortality.
HIV/AIDS estimation
Because HIV/AIDS estimation is so closely connected
to all-cause mortality estimation, we discuss HIV/AIDS
estimation separately here rather than in the later
section about estimating other causes of death. We
divided geographies into two broad groups: countries
with larger epidemics and incomplete or non-existent
vital registration systems and the remaining
geographies. For the fi rst group of geographies for
which we had necessary information about the
transmission of HIV/AIDS among adults and children
and other programme information, we fi tted a modifi ed
version of EPP-Spectrum
11,34to the data on prevalence
collated by UNAIDS from antenatal clinic
sero-surveillance and household surveys. EPP-Spectrum is a
natural history model of the HIV/AIDS epidemic that
has two distinct components. In the EPP component,
data on the prevalence of HIV are used to back-estimate
incidence of HIV. In the Spectrum component, the
estimated incidence and a set of assumptions are used
to estimate prevalence and deaths by age and sex. These
assumptions are informed by published or unpublished
cohort studies on the initial CD4 distribution of new
HIV infections, rates of decline in CD4 counts, death
rates on and off
antiretroviral therapy (ART)
diff
erentiated by age, sex, and CD4 count, and
prevention of mother-to-child transmission (PMTCT)
coverage data, as well as other demographic
assumptions, such as the HIV-free death rate. We have
modifi
ed EPP-Spectrum to enhance the internal
consistency between EPP and Spectrum and to more
1950–59 1960–69 1970–79 1980–89 1990–2000 2000–14
Central Europe, eastern Europe, and central Asia
61 145 240 386 477 555
High income 434 498 611 2481 2399 3056
Latin America and Caribbean
56 170 280 879 948 1416
North Africa and Middle East
2 5 16 27 32 61
South Asia 45 145
Southeast and east Asia and Oceania
3 30 76 171 148 310
Sub-Saharan Africa 2 60 282
Total 556 848 1223 3946 4109 5825
Numbers show available empirical life tables in the GBD 2015 database. All life tables included in the database meet quality inclusion criteria whereby the observed age-specifi c mortality rate in an empirical life table conforms to the age pattern of mortality as described by the Gompertz–Makeham law of mortality and that observed in countries with high-quality vital and civil registration systems. GBD=Global Burden of Disease.
Table 3: Distribution of empirical life tables by GBD super-region and decade, 1950–2015
–10 –8 –6 –4 –2 0
Mortality rate in log space
A
0 1 5 10 15 20 25 30 35 40 45 50 55 60 65 70 75 –10 –8 –6 –4 –2 0Mortality rate in log space
Age (years)
B
Vital registration GBD 2015 estimates Males in France, 2011 Females in France, 2011Figure 5: Age-specifi c mortality estimation with GBD life table method versus observed data excluded from the model
Country-specifi c examples for (A) males and (B) females in France, 2011. The red line shows the GBD 2015 life table system estimates of age-specifi c mortality rates from birth through age 75 years in log space, compared with observed age-specifi c mortality (blue line). Year 2011 selected for illustration purposes. GBD=Global Burden of Disease.