J
Ö N K Ö P I N GI
N T E R N A T I O N A LB
U S I N E S SS
C H O O LJÖNKÖPI NG UNIVER SITY
T h e G r e e n C o n s u m e r
A Study of Income and Organic Consumption
Bachelor Thesis within Economics
Authors: Emma Jacobsen 850415-2722 Maja Svensson 830920-3308 Supervisors: Per-Olof Bjuggren, Helena Bohman
and Hanna Larsson Jönköping January 2008
Bachelor Thesis within Economics
Title: The Green Consumer – A Study of Income and Organic Consumption Authors: Emma Jacobsen 850415-2722
Maja Svensson 830920-3308 Supervisors: Per-Olof Bjuggren
Helena Bohman Hanna Larsson Date: 2008-01-16
Keywords: Organic consumption, income elasticity, Lancaster’s consumer theory, human and technical relationships to characteristics of goods, the green consumer.
Abstract
Organic consumption is currently experiencing a boom of sales on the Swedish and international market. Whether this occurrence is a contemporary trend or if it will prove to be sustainable in the future, the demographics of the so-called ‘green consumer’ are of great interest for economic agents on markets such as foods and textiles. Therefore, the writers have chosen to highlight this topic by focusing on the relation between income and purchase of organic products. Economic data for the Swedish market has been gathered from 2003 to 2006 and analyzed through various statistical and macroeconomic perspectives, where the basis has been Kelvin Lancaster’s models of consumer choice theory. The results showed that income does not generally have a direct effect on the choice of purchasing organic goods in Sweden, although it cannot be fully dismissed when discussing the demographics of the green consumer. Other factors are of importance as well, including education, marital status and geographical location. The study of the green consumer is a rather new area and this study, along with its previous counterparts, has proved it difficult to draw any firm conclusions regarding the characteristics of the organic consumer. Therefore, future studies within this area will have plenty to discover about a subject of increasing interest and importance on the market.
Acknowledgements
The writers would like to thank the following persons for being of assistance and encouragement throughout the process of the thesis: Emelie Löfgren from Axfood, Helena Nilsson from The Nielsen Company, Hanna Larsson, Helena Bohman and Per-Olof Bjuggren.
Kandidatuppsats inom nationalekonomi
Titel: Den gröna konsumenten – en studie om inkomst och ekologisk konsumtion.
Författare: Emma Jacobsen 850415-2722 Maja Svensson 830920-3308 Handledare: Per-Olof Bjuggren
Helena Bohman Hanna Larsson Datum: 2008-01-16
Nyckelord: Ekologisk konsumtion, inkomstelasticitet, Lancasters konsumentteori, mänskliga och tekniska relationer till varukaraktärer, den gröna
konsumenten.
Sammanfattning
Ekologisk konsumtion upplever för närvarande en försäljningsboom på den svenska och internationella marknaden. Oavsett om detta är en tillfällig trend eller om det kommer bestå såväl i framtiden, är demografierna av de såkallade ’gröna konsumenterna’ av stort intresse för ekonomiska agenter inom marknader såsom textil och dagligvaror. Därför har författarna valt att framhäva detta ämne genom att fokusera på relationen mellan inkomst och inköp av ekologiska produkter. Ekonomisk data för den svenska marknaden har samlats in och analyserats genom olika statistiska och makroekonomiska perspektiv, där basen har varit Kelvin Lancasters modeller av konsumentteori. Resultaten har visat på att inkomst generellt inte har en direkt effekt på valet att köpa en ekologisk vara i Sverige, även om denna faktor inte helt kan uteslutas när demografier av den gröna konsumenten diskuteras. Andra faktorer har också betydelse, däribland utbildning, civilstånd och geografisk lokalisering. Studier om den gröna konsumenten är ett relativt nytt område, och denna kandidatuppsatsen har, tillsammans med föregående rapporter inom ämnet, funnit det svårt att dra några fasta slutsatser om den ekologiska konsumentens karaktärer. Därför kommer framtida studier inom detta område ha mycket att upptäcka om ett ämne av ökande intresse och angelägenhet på marknaden.
Tack
Författarna vill tacka följande personer för deras hjälp och uppmuntran under uppsatsprocessen: Emelie Löfgren på Axfood, Helena Nilsson på The Nielsen Company, Hanna Larsson, Helena Bohman and Per-Olof Bjuggren.
Table of Contents
1
Introduction... 1
1.1 Background ...1 1.2 Research Problem...2 1.3 Purpose ...2 1.4 Previous Studies...2 1.5 Outline ...32
Theoretical Framework... 4
2.1 Consumer Theory...42.1.1 A New Approach to Traditional Consumer Theory ...4
2.1.2 Contributions to Traditional Consumer Theory ...5
2.1.3 Extensions of Lancaster’s 1966 Model...5
2.1.4 Limitations of Lancaster’s 1966 Model ...6
2.2 Income Elasticity of Demand ...7
3
Application of Theoretical Framework ... 8
3.1 The Characteristics of Organic Products and Organic Consumers ...8
3.1.1 Technical Relationships...8
3.1.2 Human Relationships ...9
4
Empirical Data and Method ... 10
4.1 Income and Purchase...10
4.2 Empirical Study and Collection of Data ...11
4.2.1 Three Studies of Income and Purchase of Organic Products...11
4.2.1.1 Regression Method...12
5
Empirical Results... 13
5.1 Graph Results ...13
5.1.1 Study 1: Household Income and Purchased Organic Products 2003-2005 and 2006 ...13
5.1.2 Study 2: Regional Income and Purchase of KRAV-products 2005 and 2006 ...15
5.2 Regression Results ...16
5.2.1 Study 3: Income and Education’s Relationship to the Share of KRAV-fields ...16
5.2.2 Problems with Time Series Analysis...16
5.2.3 The Results of the Regressions ...18
6
Analysis ... 19
6.1 The Regression ...19
6.2 The Study by The Nielsen Company ...20
6.3 Study 1: Total Income and Purchased Organic Products 2003-2005 and 2006 ...20
6.4 Study 2: Regional Income and Purchase of KRAV-products 2005 and 2006 ...21
7
Conclusions ... 23
Appendices ... 28
Appendix 1: Income and Purchase of Organic Products 2003-2005 and 2006.28 Appendix 2: Income and Purchase of KRAV Products 2005...29
Appendix 3: Income and Purchase of KRAV Products 2006...30
Appendix 4: Regions in Accordance with The Nielsen Company...31
Appendix 5: Variables Used in Regressions ...32
Appendix 6: Reults of Regressions ...34
Figures... 7
Figure 2.1: Engel Curve ...7
Figure 3.2: Relations to Characteristics ...8
Figure 4.1: Income and Consumption of Organic Goods in Sweden...11
Figure 5.1: Income and Purchase of Organic Products 2003-2005...14
Figure 5.2: Income and Purchase of Organic Products 2006...14
Figure 5.3: Income and Purchase of KRAV Products 2005 ...15
Figure 5.4: Income and Purchase of KRAV Products 2006 ...16
Figure 5.5: Increase in KRAV-fields ...17
Figure 5.6: Increase in Income...17
Figure 5.7: Relationship Income...17
Figure 5.8: Relationship Education ...17
Tables ... 18
Table 5.1: Results of Regressions ...18
Table 5.2: Test for Autocorrelation ...19
Equations ... 7
Equation 2.1: Income Elasticity of Demand...7
1 Introduction
1.1 Background
According to a study by Ogino, Orito, Shimada and Hirooka (2007), producing one kilo of beef in a non-organic way uses an equal amount of energy as driving a car for three hours while keeping the lights on at home. There is a growing awareness of the environmental aspect of our consumption patterns and how our use of energy affects the climate. Replacing conventional products with organic products can help reduce the energy discharge according to KRAV (2004). Producing and transporting artificial fertilizers consume a high amount of energy, which can be decreased through organic agriculture. Environmental aspects are not the only reasons why people choose to buy organic products. In Western countries, health is also an important factor (Jörgensen, 2001). Organic products are thought of as healthier than the conventional alternatives since they contain less artificials. Despite of these aspects, the sales of organic products do not match those of conventional products. The main reason for this is the higher price, which is a result of higher agricultural production costs. People that decide to buy these products in spite of the higher price purchase a product that includes not only the actual good, but also the idea of making a contribution to the environment and the personal health (ibid). The existing, although limited, research shows that the aspects of environment and health play an important role for the consumption patterns of organic products.
According to KRAV (2004), organic production is production that in its process takes care of both the environment and the people in a global manner. The production is to be sustainable in the long run and generate high-quality products. The largest brands for organic products in the Swedish market are KRAV and Änglamark. Major retailers such as ICA and Arla also have their own lines for organic groceries. In 2002, the largest European market for organic products, when looking at the organic share of total food production, was Denmark with 6 %, followed by Austria with 5 %. Sweden had a share of about 2 percent (Hamm, Gronefeld and Halpin, 2002). For members of the European Union, organic or ecological products are defined as products that follow the rules set out by the European Council. These rules cover areas such as cultivation, refining of provisions, import, control, marketing and branding (EurLex, 1991). In order for a product to be advertised and sold as ‘organic’ or ‘ecological’, a number of detailed regulations have to be followed. Examples of these include which fertilizers to use and which medicines to treat cattle diseases with (Jörgensen, 2001).
When organic production first took place, it was carried out on a very low scale, by so-called idealists who pushed for a greater environmental knowledge within the entire grocery industry (ibid). This organic movement began to make its voice heard in the start of the 20th century as a reaction against synthetic fertilizers introduced in the industry (Conford,
2001). The first study by Livsmedelsverket performed on Swedish consumers regarding organic products showed a tendency towards a few consumers purchasing a large amount of organic alternatives available in stores. About 25 percent of consumers purchasing KRAV-branded products constituted 70 percent of the total consumption of these products (Jörgensen, 2001). The study further concluded a small, yet visible, relationship between higher income and higher purchase of organic goods, and a low level of price sensitivity for the products.
According to GfK Sverige (as referred to by Ekoweb Sverige, 2007), the current trend for organic products is for new consumers to be found within the younger generation. Traditionally, the so-called green consumer was a woman with high levels of education and income. But as the awareness of the environment and ecology grows, people below the age of 29 are the fastest to switch from conventional products such as ketchup, pasta, coffee and sugar toward the organic alternatives (ibid).
1.2 Research Problem
Consumption of organic and environmentally friendly goods is currently experiencing a boom, as health becomes an increasingly important issue within people’s lifes and in the coverage of the media. Organic products are in demand, much more so than only a few years ago. To keep up with competition, food chains must be sensitive to the change in consumer demand, and they must know the purchasing pattern of their customers. Studying the green consumer is therefore necessary in a time when the advantages of organic consumption, and perhaps the disadvantages of conventional consumption, are being highlighted.
Numerous studies have previously been carried out to find the demographics of the green consumer. Most of these have approached the income factor, but none of the studies looked upon has highlighted the relation between income and purchase of organic goods as the main research subject. For agents within the rather new industries where organic production is carried out, it is a great benefit if the income factor, along with other demographics, are further examined.
1.3 Purpose
The aim of the thesis is to investigate whether or not income is a positive determinant factor for the consumption of organic goods; if consumption increases along with an increase in income. This forms the research question: how does income affect the purchase of organic products?
1.4 Previous Studies
Studies on organic production and products began in Sweden in the early years of the 1990’s (Ekelund, 2003) and then mostly in the shape of academic theses and government reports. The studies have mainly focused on issues such as consumer attitudes, motives, knowledge, price, willingness to pay and so on, but none of the studies used for this thesis has had the income factor as the main research subject. Numerous studies have been carried out with the aim of identifying the consumer of organic goods, starting from the 1980s and onwards. As environmentalism is becoming a competitive issue (McCloskey and Maddock, 1994), economic agents have an increasing desire to know what drives consumers to purchase organic products.
According to Konsumentverket (2007), it is difficult to determine the contemporary consumers of organic goods by looking at demographical factors. There seems to be no common denominator for this group. Konsumentverket also concludes that consumers in general know very little about what organic production really is, while a majority among consumers seems to recognize organic branding. However, Mathisson and Schollin of 1994 (as referred to by Arvola, Koivisto Hursti, Magnusson, Sjödén and Åberg, 2001) found that
both internationally and on the Swedish market, consumers in general seem to have a rather firm knowledge about the concept of organic food.
A common belief regarding organic goods is that they provide added value for the consumer, in other words; brand equity. This is also true for the producer. For the consumer, the perceived added value can come in various forms, such as better health or better consciousness because of higher protection for animals and farm workers. The ever-increasing health awareness in modern society makes food safety and quality important for the consumer. Many studies show that this health aspect is the single most important factor for the purchase of organic foods (Wier and Calverley, 2002). Environmental reasons are also significant. Other factors determining the demand for organic goods are found to be availability, perceived value for money, perceived quality and personally imposed restrictions of food purchase (Davies, Titterington, and Cochrane, 1995).
The determinants for buying organic food differ between groups of people. The European eco-consumers are generally younger people, below the age of 45. Young people buy organic products for environmental as well as health reasons; older people purchase organic food mainly for health concerns. This is stated by Wandel and Bugge (1997, as referred to by Arvola et al, 2001). A third group, families with children, also focus on the health aspect. According to Wier and Calverley (2002), this group has the highest propensity to buy organic food among all groups in society. This notion is however not mentioned in other studies looked upon.
Although the higher price of organic goods is seen as a negative feature, some researchers believe that consumers are willing to pay 5-10 percent more for organic foods than for conventional (Arvola et al, 2001). Besides the price difference, other obstacles for the purchase of organic products on the Swedish market are said to be limited availability and consumers’ content with conventional products or lack of interest for organic goods (ibid). The green consumer is more often considered to be female than male since women are believed to have a higher interest for organic products than men. Furthermore, people with higher education are more likely to be willing to pay for organic goods (Wandel and Bugge, 1997; as referred to by Arvola et al, 2001). A general finding across most studies about the green consumer is that a positive attitude towards organic products does not always result in a purchase of them (Arvola et al, 2001).
Overall, the green consumers are significantly more likely to participate in other daily activities that demonstrate their care for the environment, as opposed to non-buyers (Ottman 1992, as referred to in Davies,Titterington, and Cochrane, 1995)
1.5 Outline
The outline is the conclusion of Chapter 1, which has provided the reader with an introduction of the thesis in form of a background and a purpose, along with an overview of previous studies. In Chapter 2, the theoretical framework is presented in three sub-sections, including limitations of the models used. Chapter 3 applies the theoretical framework on the aspects of organic consumption. Chapter 4 presents the method used and the data collected for the empirical research as well as an explanation of the regression for the reader. Empirical results is given in Chapter 5, followed by an analysis in Chapter 6 and a conclusion of the thesis in Chapter 7.
2 Theoretical Framework
2.1 Consumer Theory
To analyze which different determinants affect the demand for organic products, consumer theory will be used to understand the technical and human treatments of an organic good. The general demand function for a good is derived from the preferences a consumer has for that good (Varian, 2006). These preferences, in other words the utility a consumer gets from consuming a good, give rise to an optimal choice, which in turn creates the demand function for that good (ibid). Through this view the goods are set out to be the direct objects of utility, while Kelvin Lancaster in his New Approach to Consumer Theory (1966) suggests that it is the characteristics of the good that derive the consumer’s utility. The sections within this chapter will cover Lancaster’s theory of 1966 as well as additional extensions of the basic model of 1966. Even though this theory originates from the 1960’s, the core element of the theory still holds significance. Another relevant theory cannot be found that in a better way can be used to explain the characteristics of organic products and the choice to purchase them.
The theory is gathered, along with extensions, in Lancaster’s Modern Consumer Theory of 1991 as well as by other authors, such as Peston and Corry (1972) and Ratchford (1975), while the theory’s obstacles are put forward by Hendler (1975).
2.1.1 A New Approach to Traditional Consumer Theory
Lancaster’s theory of 1966 suggests that a good is the input of consumption, and the output is a collection of different characteristics derived from that good (Lancaster, 1966). Lancaster noted that traditional theory at this point in time did not mention anything about how consumers reacted to intrinsic properties of the goods, such as variety in quality and the reaction to new commodities. The traditional theory only looked at goods as goods and only described them as either the same commodity, ignoring a possibility of choice, or the existence of different commodities, ignoring that they could be substitutes (ibid).
The basic model that Lancaster created states that consumers are not interested in only the goods, but also in the characteristics they possess; therefore the utility orderings rank collections of characteristics first and thereafter rank the goods in order of the characteristics they possess. This means that these characteristics give rise to utility, and not the other way around. The relationship between the goods and the characteristics they contain is objective and is determined by consumption technology, which decides the restrictions on which set of intrinsic properties that can be produced by a good. The consumption technology is defined by a transformation matrix that shows that several goods are capable of producing one characteristic and that several characteristics can be produced by one good (ibid).
Through this model, the preferences constrain the choice of characteristics and the budget constraint limits the choice of goods, which gives an individual choice within a space of both characteristics and goods linked through the consumption technology. The model explains that the individual preferences determine the relative weights given to the various characteristics in making choices, why different individuals may choose different goods or collections of goods even though they face a common consumption technology (ibid).
2.1.2 Contributions to Traditional Consumer Theory
According to Ratchford (1975), Lancaster’s basic model of 1966 made several contributions to economic theory of consumer behaviour. For example, the model contributes to explaining the role of price when analyzing demand for differentiated products and provides the tools to estimate the price elasticity of demand for different product brands and a perspective on how to determine brand share through models and theory. The model also explains the economic theory behind brand loyalty.
Lancaster has given several other inputs to economic theory of consumer behaviour. The new optimal consumer choice includes an objective efficiency choice, which is the least cost combination of goods that would give the consumer his preferred combination of characteristics. This opens up for the possibility of inefficient choices by consumers and therefore highlights the potential social value of adequate consumer information (Lancaster 1966).
Another difference from the traditional approaches is the natural explanation to why consumers purchase only a small sample of all available goods. This is a result of that the characteristics meeting the consumer in decision-making are relatively small in comparison to the amount of available goods. Aggregate demand has to be derived from diversity of preferences rather than representing a consumer that buys all goods (ibid)
Concepts such as similarity between goods; the difference between a totally new good and a differentiated version of an existing one and complementarity of a good, were before Lancaster’s approach lacking an objective basis. Through the new theory these can be defined in terms of the possession or absence of common characteristics and in differences in the proportions of those characteristics. Thereafter to which group a product belongs can be explained objectively by defining it as a subset of goods possessing the same characteristics and in different proportions not represented by other goods outside of the group (ibid).
2.1.3 Extensions of Lancaster’s 1966 Model
To be able to analyze which characteristics of organic goods that are of relevance, an operational analysis of the characteristics has to be performed. This analysis was put forward by Lancaster in 1972, as an extension to his earlier studies where he describes operationally relevant characteristics. This is published in Peston and Corry’s “Essays in Honour of Lord Robbins” (1972) and summarized in Lancaster’s “Modern Consumer Theory” (1991).
The characteristics relevant to consumer choice could be infinitive. To reduce this amount into a smaller relevant set of operational characteristics, Lancaster created an extentional version of the 1966 model which expresses an operational approach to consumer theory (Lancaster, 1991). The characteristics of this extension are assumed to be objectively observable and measurable, to have linear properties; the double amount of a good has the double amount of the characteristics, and to be additive; if two kilos of good A have one unit of characteristics and one litre of good B has two units of characteristics, these two goods give a joint output of three units of characteristics (ibid). To start with, a characteristic of a good should be considered relevant if when ignored, the conclusion about consumer choice or goods’ orderings is changed. There exist criteria that can be used when deciding which characteristics are of importance for the consumer. According to Lancaster (1991) the characteristics possess two relations to a consumption activity. First,
there exists a technical relationship to the goods they relate to and second, a human relationship to the consumers they relate to. This states that a characteristic can be ignored for either technical or human reasons.
In the technical sense, a characteristic of technical ability could be ruled out by invariant. This means that a characteristic of high technological degree could be ignored if it is possessed by all goods, therefore this would not be of relevance for the consumer, when choosing which good to buy. A characteristic can be redundant, such as a fixed technical property of density, length, width or height that is possessed by all goods and therefore not of importance for the consumer choice. In earlier theories, goods were suggested to be related to people through satisfying their needs. Characteristics in this model are the intrinsic properties of goods and thereby related to people through their ability to generate responses in consuming, which can be thought of as a way of satisfying people’s needs, and shows the human relationship to characteristics (ibid).
Operational irrelevance of characteristics related to people’s needs is connected to a hierarchical approach described by Menger (1950); a dominance relationship and a satiation relationship. The hierarchical approach suggests that a good is selected to satisfy the most urgent need and that the next quantity consumed of a good satisfies the next most urgent need. Hierarchy of goods does not have to explain hierarchy of needs, as a result of a technical relationship such as a consumer preferring organic cheese to conventional cheese but buying the conventional range because of a lack of availability of the organic product. A type of hierarchical pattern is that of dominance. A characteristic is dominant over a group of characteristics if the consumer always prefers a larger amount of the dominant characteristic. For example, a consumer caring only about the environmental aspects of his/her consumption could rank the choice of food in accordance to a technical relationship, such as the impact of the production on the environment irrespective of any other characteristics, such as taste and quality (Lancaster, 1991).
A characteristic can be operationally irrelevant in accordance to its level of satiation, which could be a level of not satisfied, perfectly satisfied or a level beyond satisfaction. To be perfectly satisfied with consuming a characteristic means that there is no further interest for the consumer to consume more of the good containing the characteristic. This satiation level could give either a zero interest in further consumption or a negative interest in further quantities. The technical approach to reduce the number of irrelevant characteristics is dependent on the introduction of new goods to a society but does not have a direct relation to the group of consumers involved. The human criteria depends upon the group of consumers involved (ibid), where for example the content of food might have a different dominant characteristic in a starving Africa than in a McDonald’s born society.
2.1.4 Limitations of Lancaster’s 1966 Model
An author critical to Lancaster’s model of 1966, was Hendler (1975), who describes the boundaries the new theory contains. Hendler states that the major contributions made with the 1966 model are dependent on the ability to distinguish between objective and subjective choice and demand theory. The theory is relevant only under restricted assumptions, where nothing can be said about the efficiency of the consumer unless the goods are known to be mixable or the consumer’s utility function is given (ibid). Lancaster’s new approach of 1966 is therefore limited either in regards to the nature of the goods or in regards to the utility function of the consumer. Rather than being a general
model of consumer demand, it therefore explains the special aspects of consumer choice better (ibid).
Lancaster’s theories of consumer choice might not function better than traditional theory when analyzing consumer demand. However, this thesis will still use the models of Lancaster for further analyzing the different aspects of consumer choice as these models continue to hold great significance; which will be shown further on.
2.2 Income Elasticity of Demand
To analyze the impact of income on the consumer choice of organic goods and to position the organic good in an economic category, the theory of income elasticity of demand will be used. The income elasticity of demand is defined as the percentage change in the quantity demanded of a good as a result of a 1 percent change in income (Varian, 2006). This is represented through the formula:
ε = [∆Q/Q]/ [∆Y/Y] (2.1)
An income elasticity that lies in the range 0 <ε < 1 represents goods that are necessities, for which a change in income produces a less than proportional change in the quantity demanded (ibid). Food is an example of a necessity. Goods that are found in the range ε > 1 are called luxury goods, which mean that a rise in income will result in a more than proportional increase in demand of these goods. The goods that respond negatively to a rise in income are called inferior goods and are found in the range ε < 0.
The relationship between average market income and the respective quantities that will be demanded of a good can be represented by an Engel curve (ibid):
Income
In Figure 2.1 there is a positive correlation between income and the quantity demanded of organic products. Thus, dependent on the proportional increase, this figure either represents a necessity or a luxury good.
Figure 2.1 - Engel Curve
3 Application of Theoretical Framework
This thesis will test whether income is a determinant factor related to the consumer’s choice of organic products. Organic products will be recognized not only as goods, but as goods that possess characteristics, in accordance to Lancaster’s theory with extensions explained in Chapter 2. These specific characteristics of organic products will be analyzed through technical and human relationships in an attempt to explain why consumers choose to buy organic products in favour of conventional products. Figure 3.2 has been drawn to clarify the main factors of the theoretical framework, and how these factors are related. Figure 3.2 Relations to Characteristics
Through the theory of income elasticity of demand, an analysis will be performed to see if an organic good can be treated as a necessity good, an inferior good or a luxury good; that is if the purchase of organic products has increased or decreased with higher income levels. This thesis assumes income and purchase of organic products to have a positive relationship. Since organic products generally have a higher price it could be believed that the consumers of these products also have a higher income. Organic goods are thereby assumed to be either necessities or luxury goods, which means that the purchase of the goods increases due to an increase in income.
3.1 The Characteristics of Organic Products and Organic
Consumers
If we assume consumers to choose goods based on the characteristics they possess in accordance to the theory by Lancaster (1966), then the possible characteristics of organic goods have to be analyzed. Previous studies have shown that an organic good is purchased because of the belief that it is environmentally friendlier, healthier and that it represents better quality. The consumption has also been dependent on the availability and the perceived value for money (Davies, Titterington and Cochrane, 1995).
Through previous studies it is evident that organic goods comprise characteristics that are important for the consumer and that the consumer through these intrinsic properties derives his or her utility. The characteristics to further analyze are those that are operationally relevant, in other words; the characteristics that differ between organic and conventional goods. These characteristics may have a positive or negative influence on consumer choice and their relevance to the good can be ruled out through a technical relationship. Similarly, the characteristics’ relevance to the consumer can be ruled out based on a human relationship (Lancaster, 1991).
3.1.1 Technical Relationships
A possible technical relationship that creates a relevant characteristic of organic goods can be higher production costs that lead to higher prices in comparison to conventional
Organic Good Characteristics Organic Consumer
products. In this case, the relevant characteristic is defined as the higher price. Another relevant characteristic could be the higher possibility that organic products contain toxics that conventional products do not have, even though these toxics come from the nature. This is a result of the technical relationship that chemicals are not allowed to be used against infections, according to organic regulations. These two characteristics can be considered negative in relation to the consumption of organic products, since it might lead consumers to favour conventional products. A third characteristic based on the technical approach could be the availability of products. This could have either a negative or positive impact on the choice of buying organic products. The technical relationship in this case is the absence or presence of organic goods in supermarkets or the absence and presence of KRAV-producers nearby. The characteristic of availability may differ across country boarders; for example, a developing African country might not put as much effort into producing organic products as a Western developed country. There can also be significant differences regarding availability between different regions in a country, due to the availability of KRAV-producers in the local area and KRAV-products in the local supermarket.
Besides negative characteristics, organic goods could also possess positive characteristics created through a technical relationship. One of these is the environment, which is relevant since organic products do not contain any artificial fertilizers because of organic regulations. The same technical relationship could create a characteristic of better health. Although this is contradictory to the previous statement that organic products contain more natural toxics than conventional products, conventional products still contain more toxics in absolute numbers.
3.1.2 Human Relationships
The human relationship deals with how the consumer can respond to the characteristics of a good and thereby decide whether to purchase or not. For example, a human relationship could be the consumer’s ability to respond to higher prices by having a higher income level. Another relationship could be a higher level of education leading to a knowledge about the different characteristics of organic products that benefit or harm the consumer. For example, a consumer that is unaware that organic goods might lead to better health could have a lower propensity to make an actual purchase.
Human relationships are often linked with technical relationships. Through organic regulations, it is possible to protect both animals and workers from exploitation on poorly functioned farms and plantations. This is an example of a technical relationship which gives a characteristic of better conditions for animals and workers. The human relationship would then be a better consciousness for the consumer making the purchase. Therefore, a better consciousness could also be a characteristic of an organic good. Age could also be seen to have a human relationship to the characteristics of an organic product; some previous studies show that organic food buyers tend to be younger than non-buyers (Jolly, 1991; as referred to by Arvola et al, 2001). Even though not all studies give the same results, there are differences between age groups that could generate different responds to the characteristics. It is noticeable that younger generations tend to follow new trends easier than older generations; hence younger people might be more accessible to the organic movement. The younger generation is known as a high-consuming age group, while the older generation is thought of as more savings-oriented and therefore could be considered as more price sensitive than the younger age group. It could also be mentioned that the
younger generation today is higher educated and therefore, according to the earlier discussion, more open to the characteristics of organic products.
According to previous research by Mathisson and Schollin (1994; as referred to by Arvola et al, 2001) and Wandel and Bugge (1997; as referred to by Arvola et al, 2001), women tend to be more interested in organic food than men. Therefore gender as a human relationship can also influence the choice of organic consumption, due to different preferences between the genders. Culture is another factor that could be viewed as a human relationship. For example, Indies are considered to have a healthy culture food-wise, although this might be a changing fact. It could then be assumed that Indies would be more open to the characteristics of organic food than say people from the United States, who are seen as having unhealthier food consumption patterns.
Political views and ideas might also affect the consumption of organic products through the human relationship framework. People supporting the green-oriented party in a country could be considered more interested in the characteristics of organic products than people not supporting this party. Previous research shows that people that tend to engage more in environmental organisations also tend to buy more organic products (Kårebäck, 2006). A final example is the family situation which can also be of importance as a human relationship to the characterisics of organic products. As mentioned in previous studies, families with children usually focus on the health aspect when deciding to buy organic food and have according to Wier and Calverley (2002) the highest propensity to buy among all groups in society. However, families and singles without children can be considered less price sensitive, since they usually have a higher disposable income per capita in the household, and therefore possibly more open to the characteristic of a higher price.
4 Empirical Data and Method
4.1 Income and Purchase
According to a study by Mintel in 1991 (as referred to by Davies, Titterington, and Cochrane, 1995), which income group the consumer belongs to influences the decision to purchase organic goods. One of the findings from Mintel’s study showed that one third of the respondents would purchase organic foods occasionally if the price was lower.
A number of studies show that households with middle to higher income have a greater tendency to buy organic foods than the lower-income counterpart. A higher level of income could be represented by a higher level of education where results from Menghi in 1997 (as referred to by Wier and Calverley, 2002) and Haest in 1990 (ibid) indicate that a high level of education is positively correlated with the propensity to buy organic goods. However, surveys within this matter have shown a significant variation between occupational groups regarding the ratio of non-buyers to buyers. A different study by Ottman in 1992 (as referred to by Davies, Titterington, and Cochrane, 1995), showed the ‘green consumer’ as highly educated, affluent and mainstream, but also frequently female, with a higher income level and possibly with children in the household. Results regarding purchase of organic products and the relation to income are mixed. Haest (1990, as referred to by Wier and Calverley, 2002) states that household income has no significant influence on the demand for organic products. Another study related to income and purchase of organic products was executed by Jörgensen (2001) in Sweden. It showed that if a household spends 100 SEK more (i.e income increases) on everyday commodities, the
probability for the household to purchase more KRAV-branded goods will increase by 0.1-0.3 percentage units. Jörgensen also concluded that if the household initially buys some branded products, there is an increased probability that it will buy other KRAV-branded goods as well.
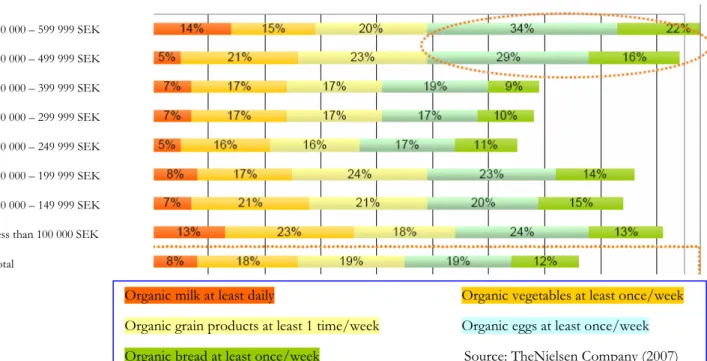
Figure 4.1 is an abstract from a recent report carried out by The Nielsen Company (2007) and it shows that people with a higher income, 400 000 SEK/year – 599 999 SEK/year, consume more organic products than the rest of the population, especially regarding egg, bread and milk. It also shows that the people in the lower income-bracket, less than 100 000 SEK/year – 199.999 SEK/year, are the ones consuming the second most of the organic products. The middle-income bracket, 200 000 SEK/year – 399 999 SEK/year, consumes the least amount of organic goods.
The previous studies looked upon showed mixed results regarding the income and purchasing patterns of organic products. Section 4.2 will show the studies performed in this thesis. Since data on this subject was very limited, it was decided to execute three different studies and it should be pointed out that these studies are based on household groups and regions, which does not provide a per-capita measure. Therefore, the results of these studies can only give an indication of how income and other factors affect organic consumption.
4.2 Empirical Study and Collection of Data
4.2.1 Three Studies of Income and Purchase of Organic Products
For testing whether a relationship exists between higher income and the purchase of organic products, a quantitative analysis has been performed through three different
500 000 – 599 999 SEK 400 000 – 499 999 SEK 300 000 – 399 999 SEK 250 000 – 299 999 SEK 200 000 – 249 999 SEK 150 000 – 199 999 SEK 100 000 – 149 999 SEK Less than 100 000 SEK Total
Organic milk at least daily Organic vegetables at least once/week
Organic grain products at least 1 time/week Organic eggs at least once/week
Organic bread at least once/week Source:TheNielsen Company (2007)
studies. Since organic consumption is a rather new occurence, there does not exist much quantitative data for the purchase of organic products. In Sweden, this data could only be found from 2003 and onwards (Statistics Sweden, 2007). Therefore the decision was made to execute three distinct studies, all of which are relevant to the study of a possible relation between income and purchase of organic products. One of these studies has been performed as a regression analysis of 20 observations.
The first study compiles data collected from Statistics Sweden, where the purchase of organic products could be found divided into different income groups, represented in Appendix 1. The income used to develop a graph is shown as the average disposable income per household group, in percentages of total income over all groups. The purchases are depicted as purchased organic products,in percentages of total purchases of every-day consumption goods.
The second study was performed with data collected from The Nielsen Company and shows regional sales for KRAV-products for the years 2005 and 2006 (Appendix 2 and Appendix 3). The regions represented are the North, Middle, East, West, Southeast and South of Sweden (Appendix 4). The sales were divided by the regions’ specific populations to get the total sales per capita. To achieve the regional income levels, income data for the different Swedish municipalities was collected from Statistics Sweden and thereafter an average income was calculated on a regional level using the regions provided by The Nielsen Company.
The third study included data collected over 20 years, from 1985 to 2005. The study contains three variables; the KRAV-fields’ share of total agricultural fields, the average disposable income per consumption unit and the share of registered students at Swedish universities, in regards to the total population over the age of 20. All of these were collected from Statistics Sweden (Appendix 5). The purpose with this study was to analyze whether the variables average disposable income and the number of registered university students can explain the variable KRAV-fields’ share of total agriculture. Since there does not exist any data for KRAV-product sales dating as far back as 1985, the alternative variable of KRAV-fields’ share was chosen. The study resulted in 20 observations of each variable over time, which was used to execute a regression.
4.2.1.1 Regression Method
The time series collected for the third study contained data for the years 1985 – 2005. This collection was finalized in a linear regression analysis of Ordinary Least Squares. The variables that have been calculated and used in the regression are the following (Appendix 5):
• K - share of KRAV-fields (Livsmedelssverige, 2007) in regards to total agricultural fields in Sweden (Statistics Sweden, 2007). This is the dependent variable.
• I - average disposable income per consumption unit (Statistics Sweden, 2007). This is an independent variable.
• S - share of registered university students of the population above age 20 (Statistics Sweden, 2007). This is an independent variable.
The linear regression equation to estimate looks as follows:
The expectations underlying Equation 4.1 is a positive linear relationship between the dependent variable K and the independent variables I and S.
The hypothesis is stated below as; H0: β1 = β2 = β3 = 0
H1:
at least one
βj > 05 Empirical Results
5.1 Graph Results
5.1.1 Study 1: Household Income and Purchased Organic Products 2003-2005 and 2006
The first empirical study of the thesis was carried out to see if there was any visible relationship between disposable income and the amount of purchased organic products for different Swedish households during the period 2003 - 2005.
For Figure 5.1 and Figure 5.2, the following household groups surveyed by Statistics Sweden (2006) were used:
• Singles without children.
• Singles with one or more children aged 0-19. • Partners without children.
• Partners with one or more children aged 0-19. • Other partners with children.
• Others.
Statistics Sweden has an approach to refine families with children. For example, to belong to the group Partners with one or more children aged 0-19, no child aged 20 or older can be in the household. Singles that have children both under and above the age of 19 end up in the group Others. Partners with children above and under the age of 19 end up in the group Other partners with children. Partners with children aged above 19 are selected to the group Others. (ibid)
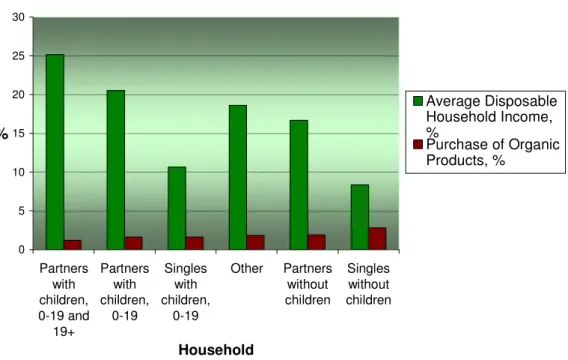
It is evident from Figure 5.1 that the household group enjoying the highest income (Other partners with children), is also the one purchasing the least amount of organic products. For an average disposable household income of approximately 25 % of the total survey’s income, this group’s purchase of organic products only amounted to around 2 % of their total consumption of every-day commodities.
The highest purchase is found in the household group labeled Single without children, with around 3 %. This group has the lowest level of income, about 8 %, in comparison to the other groups. Thus, according to Figure 5.1, income is not a determinant factor for the purchase of organic products.
0 5 10 15 20 25 30 Partners with children, 0-19 and 19+ Partners with children, 0-19 Singles with children, 0-19 Other Partners without children Singles without children Household % Average Disposable Household Income, % Purchase of Organic Products, %
Source: Statistics Sweden (2007)
A similar study was performed for 2006, with average disposable household income and purchased organic products for each household groups, where the household groups are the same as for the study of 2003-2005. The results are depicted in Figure 5.2 and they bear a significant resemblance to the results of 2003-2005.
0 5 10 15 20 25 30 Partners with children, 0-19 and 19+ Singles with children, 0-19 Other Partners with children, 0-19 Partners without children Singles without children Household % Average Disposable Household Income, % Purchased Organic Products, %
Source: Statistics Sweden (2007)
Figure 5.1 Income and Purchase of Organic Products 2003-2005
Figure 5.2 Income and Purchase of Organic Products 2006
Some differences can be seen; the group Partners with children increased its purchases of organic products and was in 2006 the third largest purchaser, compared to the fifth in 2003-2005. The group Others, consisting of singles with children both under and above the age of 19 and partners with childen aged above 19, had decreased organic purchases. Singles with children aged 0-19 also purchased less in 2006. Singles and partners without children were still the top consumers of organic products.
5.1.2 Study 2: Regional Income and Purchase of KRAV-products 2005 and 2006
The second study was performed with data collected for different regions in Sweden; North, Southeast, Middle, South, West and East.
0 50 100 150 200 250 300 NO RTH SO UTH EAST MID DLE SOU TH WES T EAST Region S E
K Annual per-CapitaSales, 1000 SEK
Average per-Capita Income, 1000 SEK
Source: The Nielsen Company (2007) and Statistics Sweden (2007)
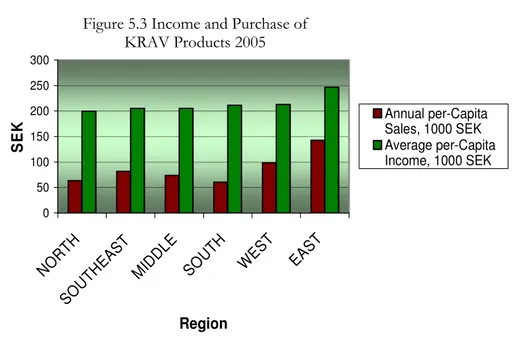
As can be seen in Figure 5.3, in 2005 there may be a relationship between higher income and higher demand for organic products for the regions of North, Southeast, West and East. Noticeable exceptions are the Middle and South regions. The South region enjoyed the third highest average income in Sweden for 2005, but purchased the least amount of KRAV products of all regions.
During 2006, the sales of organic products from KRAV did not show a continuous increasing relationship to consumers with higher income, as depicted in Figure 5.4. Again, the Middle and South regions are the regions deviating from the otherwise coherent trend. For example, the Middle region has the lowest level of average income of all the regions, but is the third largest purchaser of products branded with KRAV.
Figure 5.3 Income and Purchase of KRAV Products 2005
0 50 100 150 200 250 300 MID DLE NO RTH SO UTH EAS T SO UTH WE ST EAS T Region S E
K Annual per-Capita Sales,1000 SEK
Average per-Capita Income, 1000 SEK
Source: The Nielsen Company (2007) and Statistics Sweden (2007)
From these two studies, there appears to be no direct relationship between income and the purchase of organic products. According to the results presented in Figure 5.1 and Figure 5.2, the opposite relation may even hold; the less money the household earns, the more organic products it buys. The regional data shows no coherent relationship either for an increasing or a decreasing relationship between income and purchases. While the East region has the highest demand for organic products and also enjoys the highest level of income, the South region has the third largest income in the country but still purchases the least amount of organic goods.
5.2 Regression Results
5.2.1 Study 3: Income and Education’s Relationship to the Share of KRAV-fields
The calculated variables used at first in the regression were the share of KRAV-fields as the dependent variable, average disposable income and share of registered university students as the independent variables, for the years 1985 - 2005.
5.2.2 Problems with Time Series Analysis
A problem by using variables over time is that they can be correlated without explaining each other as a result of similar trends, also called autocorrelation (Gujarati, 2006). For example, just because two variables rise during the same period of time, they do not have to explain each other’s increases.
As can be seen in Figure 5.5 and Figure 5.6, both the share of KRAV-fields and income give an increasing pattern over the years 1985-2005. This does not have to show that income is an explanatory variable of the increase in KRAV-fields.
Figure 5.4 Income and Purchase of KRAV Products 2006
1985 1986 1987 1988 1989 1990 1991 1992 1993 1994 1995 1996 1997 1998 1999 2000 2001 2002 2003 2004 2005
YEAR, not periodic 0,04 0,05 0,06 0,07 K R A V fi e ld s 1985 1986 1987 1988 1989 1990 1991 1992 1993 1994 1995 1996 1997 1998 1999 2000 2001 2002 2003 2004 2005
YEAR, not periodic 120,00 140,00 160,00 180,00 In c o m e 0,01 0,008 0,006 0,004 0,002 0,00 -0,002 K R A V fi e ld s _ 1 R Sq Linear = 0,016 0,01 0,008 0,006 0,004 0,002 0,00 -0,002 K R A V fi e ld s _ 1 R Sq Linear = 0,449
The pattern could be random and other variables that are not related to KRAV-fields could show the same structure over the same period in time.
To prevent autocorrelation, the variables were changed into DIFF-variables, which means that instead of taking the actual share of KRAV-fields, the difference between the years was taken as a variable instead. This regards average disposable income and share of registered university students as well. After changing the variables into DIFF-variables, the relationships in Figure 5.7 and Figure 5.8 could be shown. It can be seen from Figure 5.7 that income in this case does not explain the dependent variable KRAV-fields, which shows an R2 of 0.016 that measures the goodness of fit of the variables. In Figure 5.8, a
positive relationship can be seen between the independent variable of students and the variable KRAV-fields. The R2 is 0.449, which means that the share of registered students
could to some extent explain the change in KRAV-fields over the years.
Figure 5.7 Relationship Income Figure 5.8 Relationship Education Figure 5.6 Increase in Income Figure 5.5 Increase in KRAV-fields
5.2.3 The Results of the Regressions
In Table 5.1 the regression results are presented. For further information, see Appendix 6. Table 5.1 Results of Regressions
Regression with unchanged variables Regression with DIFF-variables Regression with lagged variable Constant (β1) (t-statistics) 0.45 (4.688)** 0.001 (0.959) 0.000 (0.629) I – Average Disposable Income (β2) (t-statistics) -4.70E-05 (-0.626) -6,02E-005 (-0.838) -6,24E-005 (-0.850) S – Share of Registered Students (β3) (t-statistics) 0.485 (9.811)** 0.375 (3.825)** 0.423 (3.484)** Lag S – Share of Registered Students (β4) -0.116 (-0.914) R-square 0.97 0.686 0.484 F-statistics 289.211** 7,567** 4.686* Durbin-Watson 0.609 1.642 1.931 * = Significant at 5 % level ** = Significant at 1 % level
As can be seen by Table 5.1, the first regression that was using the unchanged variables could be accused for autocorrelation, as a result of a Durbin-Watson of 0.609. When there is no autocorrelation, a test of Durbin-Watson should result in a number close to 2 (Gujarati, 2006). A number close to 0 gives a higher autocorrelation. To prevent autocorrelation, DIFF-variables were used in a second regression. The result shows that there is less autocorrelation with a Durbin-Watson of 1.642. The model shows an R2 of
0.686, which states that the independent variables I and S could have an impact on changes of the dependent variable. The F-statistics for the regression is high and significant at both the 5 % significance level (3.59) and the 1 % significance level (5.42).
Since the Durbin-Watson for this model shows that autocorrelation does exist to some extent, a third regression was performed incorporating the concept of a lagged variable. Including a lagged variable means that a one-year time lag is put on the variable that creates autocorrelation. Hence, a test for autocorrelation was performed on each variable in order to see which variable produced autocorrelation.
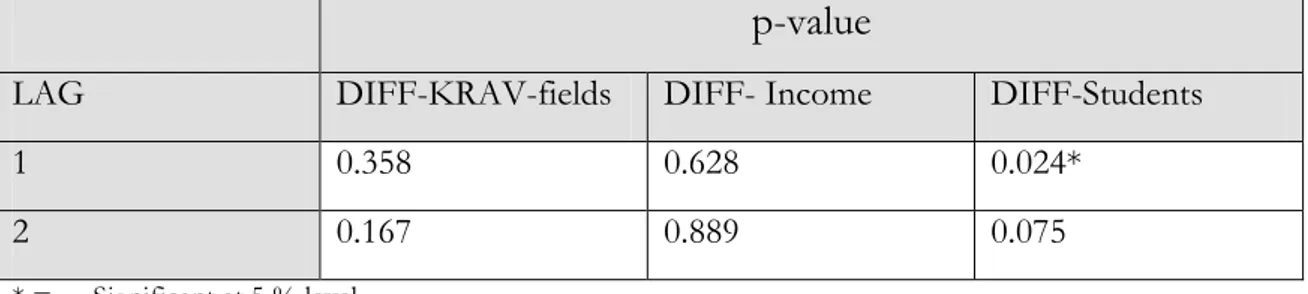
Table 5.2 Test for Autocorrelation
p-value
LAG DIFF-KRAV-fields DIFF- Income DIFF-Students
1 0.358 0.628 0.024*
2 0.167 0.889 0.075
* = Significant at 5 % level ** = Significant at 1 % level
As seen in Table 5.2, the DIFF-variable of share of registered university students is significant on Lag 1 at the 5 % significant level (0.024<0.05), which means that this is the variable creating the autocorrelation. Therefore a lag was put on this DIFF-variable and thereafter a new regression was executed.
As seen in the last regression, with a lagged variable, the Durbin-Watson is almost 2 (1.931), which means that the model is corrected for autocorrelation. The F-statistics is significant at the 5 % level for this model, which makes at least one of the variables significant and therefore the null hypothesis of H0: β1 = β2 = β3 = 0 can be rejected. R2
(0.484) shows that the independent variables have an impact on changes in the dependent variable to some extent.
In all regressions, the variable of income shows to be insignificant at the 5 % level of significance. The opposite refers to the variable share of registered university students that shows significance in all regressions at both the 5 % and 1 % significance level. However, it should be pointed out that just because the value of Durbin-Watson is sufficient, the regression itself may not lead to a firm conclusion that the number of registered students have an impact on the increase in the share of KRAV-fields. This is a problem with performing time-series regressions, and it will be considered while analysing the findings.
6 Analysis
6.1 The Regression
The three studies performed in this thesis all appeared to show no clear linear relationship between an increased income and an increased demand for organic products in Sweden. The third study that was carried out using a regression showed that income had neither a positive nor a negative significant impact on the share of KRAV-fields in Sweden, which could mean that income does not explain changes in the share of agriculture devoted to organic production. The regression did show a potential relationship between being highly educated and being a consumer of organic products, where education was measured as the share of registered university students from 1985 to 2005 in Sweden and organic consumption was measured as the share of agriculture devoted to organic production. However, since a time-series regression was performed, these results are not certain even though autocorrelation as measured by Durbin-Watson was low. To improve the validity of the results, previous studies together with Study 1 and Study 2 will be analyzed. Although these studies do not either show a clear relationship between income and demand for
organic products, they could function as potential evidence to why a clear connection cannot be seen.
6.2 The Study by The Nielsen Company
Referring back to Figure 4.1, this study did not show a linear relation between income and consumption of organic products in Sweden. The figure shows that the three highest income levels purchase the highest amount of organic products, the three lowest income levels purchase the second highest amount, and the middle income levels purchase the least. If it is assumed that students comprise a large part of the low income level group, it can als be assumed that this group is on average younger than the rest of the population. The regression results pointed to a higher share of KRAV-fields in Sweden over time along with an increasing number of registered university students. Therefore, the results of the study by The Nielsen Company could give increased validity to the regression results by indicating that knowledge as a human relationship between the consumer and the characterisics of organic products could be significant. This study also indicates that age as a human relationship affects the openness to the characteristics of organic goods. Even though this study does now show a linear relationship between income and organic consumption, the income factor can not be dismissed because of the possibility of a nonlinear relationship.
6.3 Study 1: Total Income and Purchased Organic Products
2003-2005 and 2006
The first study that was performed showed a negative relationship between income and demand for organic products in Sweden (see Figure 5.1), where the household group holding the lowest income level was the group purchasing the largest amount of organic products, in regards to their other expenditures. The group representing the highest household income level purchased the least organic products. However, it should be pointed out that although differences exist, they are not significantly large. Household groups deviating from this pattern in 2003-2005 were the households representing Singles with children aged below 19 that purchased the second least of organic products and had the second lowest level of income; the other was the household representing Partner with children aged below 19 that purchased the third least of organic products and had the second highest level of income. In 2006, results were similar; Singles without children purchased the largest amount of organic products, followed by Partners without children. Partners with children aged 0-19 had increased their purchases and came on third place, instead of fifth place as in the previous years (see Figure 5.2).
In accordance to the theory of income elasticity of demand, this study describes an organic good as an inferior good, which means that there is a negative response in demand for that good to a rise in income (Varian, 2006). The expectation before this study was to receive a positive relationship to income, where an organic good is considered as either luxury or necessity. Since organic goods tend to have higher prices, assumptions were made about less willingness to pay for organic products if the respective income was lower.
The human relationships that the different household groups have to the characteristics of organic products may explain the conflicting result. The group that corresponds to the lowest income level is represented by Singles without children, which could be characterized by a younger fraction of the population. As discussed earlier, the age factor could change the
accessibility towards the characteristics of organic products. Younger people tend to be more open to new trends, less price-sensitive and maybe even be more educated, which could all be reasons for them to consume more organic goods. If the younger people are the ones buying more organic goods as noted by Jolly (1991; as referred to by Arvola et al, 2001), a positive linear relation to income in this aspect cannot be shown, since younger people tend to be positioned in the lower income bracket. These findings could also be supported by the study carried out by The Nielsen Company, since this study pointed to a higher purchase frequency by the lower income brackets (see Figure 4.1). Furthermore, the assumption that younger people often have a higher education, and are thereby more open to the characteristics of organic products, could give support to the regression results pointing to a relationship between an increasing amount of university students and an increasing share of KRAV-fields.
The household group representing the higher level of income; Partners with children aged above and below 19, could correspond to an older fraction of the population, since they have children above the age of 19. If older generations are assumed to have human relationships to the characteristics of organic products in the form of less openness to new trends, a higher price sensitivity and less education, this is not a surprising result. But the pattern of Figure 5.1 is not linear as a result of the household group Others, consisting of both singles with children aged above and below 19 and partners with children aged above 19, that does not follow the otherwise existing age trend. Even though this can be considered an older fraction of the population, the purchase of organic products is the third highest.
Some previous studies have shown a propensity for families with children to buy more organic products than others. However, in relation to this study, this is not relevant since the groups purchasing most organic products are the groups having no children: Singles without children and Partners without children (see Figure 5.1 and Figure 5.2). In both 2005 and 2006 Singles without children was the household group purchasing the largest amount of organic products. As mentioned before this is also the group possibly representing the youngest population and therefore it might not be a surprising result following previous discussion. It could also be true that a single person could have a different human relationship to the characteristics of organic food, given that the person is more open to the assumed health benefits of organic food, believing they give for example an increased attractiveness. This assumes that he or she is in fact in search for a partner. Antoher factor to point out is that singles without children tend to have more time and a higher disposable income to spend on themselves. People buying for a larger household tend to buy big-packs and are therefore assumed to be more price sensitive, which makes their human relationship less open to the price characteristics of organic products.
To clarify, the demographics of a household group are examples of human relationships. Even though a positive linear relation between income and purchase of organic products could not be found, the possibility of a positive relationship within the different household groups can not be ruled out. This is because within a household group, it might be the persons having the highest income of the group that buy the most. However, this possible relation cannot be seen from the data since it is not based on individuals.
6.4 Study 2: Regional Income and Purchase of
KRAV-products 2005 and 2006
For the second study there could neither be shown a positive nor a negative relationship between income and demand for organic products in Sweden. In 2005, the South region of