Department of Aquatic Sciences and Assessment
Analysis of per- and polyfluoroalkyl
substances (PFASs) and phenolic
compounds in Swedish rivers over
four different seasons
Analys av PFAS och fenolära
ämnen i flodmynningar
Lutz Ahrens, Lisa Vogel, Karin Wiberg
Rapport till Naturvårdsverket Överenskommelse NV-2213-16-011
NATIONELL MILJÖÖVERVAKNING PÅ UPPDRAG AV NATURVÅRDSVERKET ÄRENDENNUMMER AVTALSNUMMER PROGRAMOMRÅDE DELPROGRAM NV-04887-16 2213-16-011 Miljögifter akvatiskt Utveckling och analys
Analys av PFAS och fenolära ämnen i flodmynningar
RapportförfattareLutz Ahrens, SLU Lisa Vogel, SLU Karin Wiberg, SLU
Utgivare
Institutionen för vatten och miljö (IVM) Sveriges lantbruksuniversitet (SLU) Postadress
Box 7050, 750 07 Uppsala Telefon
018-671000 Rapporttitel och undertitel
Analys av PFAS och fenolära ämnen i flodmynningar
Beställare Naturvårdsverket 106 48 Stockholm Finansiering Nationell MÖ Nyckelord för plats
screening, svenska vattendrag, flodmynningar Nyckelord för ämne
PFAS och fenolära ämnen
Tidpunkt för insamling av underlagsdata 2016-09-01 – 2018-02-28
Sammanfattning
Syftet med denna studie var att undersöka miljökoncentrationer, sammansättning, säsongsvariation och flöden av 28 PFAS-substanser och 10 fenolära ämnen i 10 svenska vattendrag över fyra olika årstider (oktober 2016, januari 2017, april 2017 och juli 2017). Totalt detekterades 7 av 28 PFAS-ämnen i relativt låga nivåer (i genomsnitt 3,2 ng per liter för Σ28PFAS) i flodvatten (n = 40). Koncentrationerna av de fenolära föreningarna var generellt högre (genomsnittshalt 230 ng per liter för summan av alla fenoler som mättes; n = 38). Detektionsfrekvensen var dock låg (i genomsnitt 50%), vilket resulterade i låga mediankoncentrationer för summahalten (0 ng per liter). De dominerande PFAS-substanserna var perfluorbutansulfonsyra (PFBS, 38% av Σ28PFAS), perfluoroktansyra (PFOA, 21%) och perfluoroktansulfonsyra (PFOS (grenad), 8,9%) medan de dominerande fenolära föreningarna var 4-nonylfenol NP, 67%), 4-tert-nonylfenol-dietoxilat (4-NP-EO2, 20%) och 2,4,6-tribromfenol (TBP, 10%). Koncentrationerna av PFAS och fenolföreningar uppvisade ingen säsongsvariation under de fyra undersökta årstiderna, vilket indikerar ett relativt stabilt flöde av dessa två ämnesklasser till vattendragen. De uppmätta PFAS-koncentrationerna var inte relaterade till koncentrationerna av fenolära föreningarna, vilket indikerar olika källor för de två ämnesklasserna. Flödena för totalhalterna uppskattades till 220 g per dag (81 kg per år) för Σ28PFAS, och >70 gånger högre för de fenolära ämnena med totalflöden på 16000 g per dag (5700 kg per år). Miljökvalitetsstandarden för ett årligt genomsnitt (AA-EQS) som anges i EU: s ramdirektiv för vatten (WFD) överskreds för 33% (n = 13) av vattenproverna för summan av linjära och grenade PFOS och för 13% (n = 5) av för 4-NP. Detta indikerar att halterna av PFOS och 4-NP utgör en potentiell risk för vattenmiljön. AA-EQS för 4-oktylfenol (4-OP) och pentaklorfenol (PCP) överskreds inte i något fall.
Summary
Per- and polyfluoroalkyl substances (PFASs) and phenolic compounds are emerging organic pollutants characterized by their persistency, bioaccumulation and toxicity potential. In this study, 28 PFASs and 10 phenolic compounds were investigated in 10 Swedish rivers over four different seasons (October 2016, January 2017, April 2017 and July 2017). The objective was to investigate the levels, composition profiles, sesonal trends and fluxes for both compound classes. In total, 7 out of 28 PFASs and 9 out of 10 phenolic compounds were detected in surface water from the 10 rivers. The average concentration in all samples was 3.2 ng L-1 for ∑28PFASs (median 2.4 ng L-1, n = 40), while 230 ng L-1 for the sum of the phenolic
compounds (median 0 ng L-1, n = 38). Highest average ∑28PFAS concentrations were found
in Rönneån with 10 ng L-1 (median 11 ng L-1), followed by Norrström with 9.0 ng L-1
(median 9.1 ng L-1), whereas no PFASs were detected in Umeå älv and Ångermanälven. On the other hand, highest average of the sum of the phenolic compound concentrations were found in Nyköpingsån with 1500 ng L-1 (median 57 ng L-1), while for the other rivers the
average ranged between 50 ng L-1 and 140 ng L-1, except for Emån where TBP was only detected in one sample with 0.33 ng L-1. This indicates that PFASs and phenolic compounds origin from different sources. The dominant PFASs were perfluorobutane sulfonic acid (PFBS, 38 % of the ∑28PFASs), perfluorooctanoic acid (PFOA, 21 %), and perfluorooctane
sulfonic acid (PFOS (branched), 8.9 %), while the dominant phenolic compounds were 4-nonylphenol (4-NP, 67 %), 4-tert-4-nonylphenol-diethoxylate (4-NP-EO2, 20 %), and 2,4,6-tribromophenol (TBP, 10 %). The concentrations of PFASs and phenolic compounds were relatively constant during the four investigated seasons which indicates a relatively steady input of these two compound classes into the river systems. The daily fluxes of Σ28PFAS was
estimated to be in total 220 g d-1 (81 kg year-1), whereas the daily fluxes of phenolic compounds was estimated to be 16000 g d-1 (5700 kg year-1) for all 10 investigated rivers.
The Annual Average Environmental Quality Standard (AA-EQS) of the EU Water Framework Directive (WFD) was exceeded in 33% (n = 13) of the surface water samples for the sum of linear and branched PFOS and in 13% (n = 5) of the surface water samples for 4-NP. This indicates that there is a potential risk for the aquatic environment. The AA-EQS of 4-octylphenol (4-OP) and pentachlorophenol (PCP) was not exceeded in any surface water sample.
1
1. Introduction
Per- and polyfluoroalkyl substances (PFASs) and phenolic compounds (e.g. alkylphenols, bisphenol A and triclosan) are emerging classes of compounds and have received increasing attention due to their persistency, bioaccumulation and toxicity potential (Giesy et al., 2010, Oehlmann et al., 2000). PFASs and phenolic compounds are used for a variety of industry and consumer products. PFASs, for example, have been used in dirt repellent for textiles or paper, and aqueous fire-fighting foams (AFFFs) (Buck et al., 2011), while phenolic compounds have been used in formulations such as detergents, emulsifiers, dispersants, antifoamers, and dyeing assists (Bennie, 1999). Due to their extensive usage, PFASs and phenolic compounds have been detected ubiquitously in the environment, humans and wildlife (Ahrens, 2011, Ahrens and Bundschuh, 2014, Bolz et al., 2001). Important point sources to the aquatic ecosystem are, for example, sewage treat-ment plants (STP) and landfills, while among diffuse sources, atmospheric deposition is considered to be important (Bennie, 1999, Ahrens and Bundschuh, 2014, Ahrens et al., 2015, Voutsa et al., 2006).
Among the PFASs, PFOS is included in the EU Water Framework Directive (WFD) with an Annual Average Environmental Quality Standard (AA-EQS) of 0.65 ng L-1 (The European
Parliament and of the Council, 2013/39/EU). Among the phenolic compounds, nonylphenols, octylphenols, and pentachlorophenol are included in the EU WFD with AA-EQS of 300 ng L
-1, 100 ng L-1, and 400 ng L-1 (The European Parliament and of the Council, 2013/39/EU). The
Swedish National Food Agency has issued risk management recommendations for PFASs in drinking water, and these include 11 PFASs (i.e. PFBA, PFPeA, PFHxA, PFHpA, PFOA, PFNA, PFDA, PFBS, PFHxS, PFOS, and 6:2 FTSA) with an action limit of 90 ng L-1 and a
health-based guidance value of 900 ng L-1for ∑7PFASs (Swedish National Food Agency,
2018).
The aim of the current project was to investigate the occurrence of 28 PFASs and 10 phenolic compounds in 10 Swedish rivers. In addition, composition profiles, sesonal trends and fluxes were evaluated for both compound classes. The sampling was performed over four seasons including October 2016, January 2017, April 2017 and July 2017 and analysed by the POPs laboratory at the Department of Aquatic Sciences and Assessment (IVM) at the Swedish University of Agricultural Sciences (SLU), Uppsala.
2. Materials and methods
2.1 Chemicals
In total, 28 PFASs were included for analysis: four PFSAs (PFBS, PFHxS, PFOS, PFDS), 13 PFCAs (PFBA, PFPeA, PFHxA, PFHpA, PFOA, PFNA, PFDA, PFUnDA, PFDoDA, PFTriDA, PFTeDA, PFHxDA, PFOcDA), three perfluorooctane sulfonamides (FOSAs) (FOSA, MeFOSA EtFOSA), two perfluorooctane sulfonamidoethanols (FOSEs) (MeFOSE, EtFOSE), three perfluorooctane sulfonamidoacetic acids (FOSAAs) (FOSAA, MeFOSAA, EtFOSAA) and three fluorotelomer carboxylate (6:2 FTSA, 8:2 FTSA, 10:2
2
FTSA) (Table 1). In addition, 16 internal standards (IS) were used, which were spiked to the water sample before extraction (i.e. 13C
8-FOSA, d3-MeFOSAA, d5-EtFOSAA, d3-MeFOSA,
d5-EtFOSA, d7-MeFOSE, d9-EtFOSE, 13C4-PFBA, 13C2-PFHxA, 13C4-PFOA, 13C5-PFNA, 13C
2-PFDA, 13C2-PFUnDA, 13C2-PFDoDA, 18O2-PFHxS, 13C4-PFOS).
Table 1. PFAS target compounds
Substance Acronym Molecular formula
PFCAs
Perfluorobutanoic acid PFBA C3F7CO2H
Perfluoropentanoic acid PFPeA C4F9CO2H
Perfluorohexanoic acid PFHxA C5F11CO2H
Perfluorohepanoic acid PFHpA C6F13CO2H
Perfluorooctanoic acid PFOA C7F15CO2H
Perfluorononanoic acid PFNA C8F17CO2H
Perfluorodecanoic acid PFDA C9F19CO2H
Perfluoroundecanoic acid PFUnDA C10F21CO2H
Perfluorododecanoic acid PFDoDA C11F23CO2H
Perfluorotridecanoic acid PFTrDA C12F25CO2H
Perfluorotetradecanoic acid PFTeDA C13F27CO2H
Perfluorohexadecanoic acid PFHxDA C15F31CO2H
Perfluorooctadecanoic acid PFOcDA C17F35CO2H
PFSAs
Perfluorobutane sulfonic acid PFBS C4F9SO3H
Perfluorohexane sulfonic acid PFHxS C6F13SO3H
Perfluorooctane sulfonic acid PFOS C8F17SO3H
Perfluorodecane sulfonic acid PFDS C10F21SO3H
FASAAs
Perfluorooctane sulfonamidoacetic acid FOSAA C8F17SO2N(CH2CO2H)H
N-methylperfluoro-1-octanesulfonamidoacetic acid MeFOSAA C8F17SO2N(CH3)CH2CO2H
N-ethylperfluoro-1-octanesulfonamidoacetic acid EtFOSAA C8F17SO2N(C2H5)CH2CO2H
FOSAs
Perfluorooctane sulfonamide FOSA C8F17SO2NH2
N-methylperfluoro-1-octansulfonamide MeFOSA C8F17SO2N(CH3)H N-ethylperfluoro-1-octanesulfonamide EtFOSA C8F17SO2N(CH2CH3)H FOSEs 2-(N-methylperfluoro-1-octanesulfonamido)-ethanol MeFOSE C8F17SO2N(CH3)CH2CH2OH 2-(N-ethylperfluoro-1-octanesulfonamido)-ethanol EtFOSE C8F17SO2N(C2H5)CH2CH2OH FTSAs
3
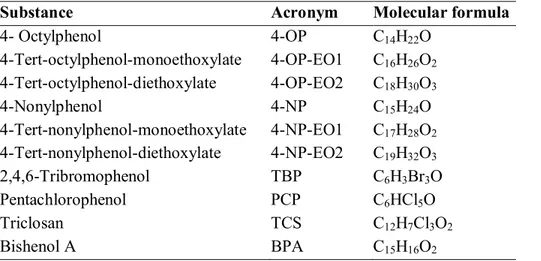
In addition, 10 phenolic substances were analysed including octylphenol (OP), 4-tert-octylphenol-monoethoxylate (4-OP-EO1), 4-tert-octylphenol-diethoxylate (4-OP-EO2), 4-nonylphenol (4-NP), monoethoxylate (4-NP-EO1), 4-tert-nonylphenol-diethoxylate (4-NP-EO2), 2,4,6-tribromophenol (TBP), pentachlorophenol (PCP), triclosan (TCS), and bishenol A (BPA) (Table 2).
Table 2. Phenolic target compounds
Substance Acronym Molecular formula
4- Octylphenol 4-OP C14H22O 4-Tert-octylphenol-monoethoxylate 4-OP-EO1 C16H26O2 4-Tert-octylphenol-diethoxylate 4-OP-EO2 C18H30O3 4-Nonylphenol 4-NP C15H24O 4-Tert-nonylphenol-monoethoxylate 4-NP-EO1 C17H28O2 4-Tert-nonylphenol-diethoxylate 4-NP-EO2 C19H32O3 2,4,6-Tribromophenol TBP C6H3Br3O Pentachlorophenol PCP C6HCl5O Triclosan TCS C12H7Cl3O2 Bishenol A BPA C15H16O2
2.2 Sampling sites and sampling
Surface water samples were collected at 10 sampling sites at the river mouth over four seasons including October 2016, January 2017, April 2017 and July 2017 (Table A1 in the Appendix). The 10 sampling sites included: Ume älv (Stornorrfors), Ångermanälven, Delångersån (Iggesund), Norrström, Nyköpingsån, Emån, Mörrumsån, Rönneån, Göta älv (Alelyckan), and Nordre älv. In total, 40 samples were analysed for PFASs, plus 4 triplicates, 5 field blanks, and 4 laboratory blanks. In addition, 38 samples (two brown glass bottles broke during shipment) + 4 triplicates + 7 field blanks were analysed for phenolic substances. The sampling sites were selected together by the Swedish EPA and IVM (SLU, Uppsala), based on the knowledge of elevated PFAS levels in these rivers. The water samples were collected at about 10 cm below the water surface using 1 L polypropylene (PP) bottles for PFASs and 1 L brown glass bottles for phenolic compounds. All PP and brown glass bottles were rinsed three times with the sample water before the bottles was completely filled. The water samples were stored a 4°C until analysis. Field blanks were collected by opening the PP or brown glass bottles shortly at the sampling site and then treating them like real samples.
2.3 PFAS analysis
All samples were analyzed by the POPs-lab at IVM (SLU, Uppsala). The samples were analysed according to methods described previously (Ahrens et al., 2009). Briefly, the water
4
samples were filtered through glass fibre filters (Whatman™ Glass Microfiber Filters GF/C™, 47 mm diameter, 1.2 μm). The extraction was performed using solid phase extraction (SPE) with Oasis® WAX cartridges (6 cm3, 150 mg, 30 μm, Waters, Massachusetts, USA). Before extraction, the cartridges were preconditioned with 4 mL 0.1% ammonium hydroxide, 4 mL methanol and 4 mL Millipore water. The samples were spiked with 100 μL IS mixture (c = 20 pg μL-1), and each loaded onto the cartridge. The flow was regulated to a flow of one drop per second. After loading (~300 mL), the cartridges were washed with 4 mL of 25 mM ammonium acetate buffer (pH 4) and dried by centrifugation for 2 minutes at 3000 rpm. The cartridges were then eluted into 15 mL PP-tubes by adding 4 mL methanol, followed by 8 mL 0.1% ammonium hydroxide in methanol. The samples were placed under nitrogen evaporation (N-EVAP™ 112) to concentrate the sample to 0.5 mL using a gentle stream of nitrogen gas. Before analysis, 0.5 mL Millipore water was added and then subsequently analysed using high performance liquid chromatography-mass spectrophotometry (HPLC-MS/MS) according to the method described by Ahrens et al. (2009). For PFHxS, PFOS and FOSA, the linear and branched isomers were quantified separately. The concentrations of the branched isomers should be considered as semi-quantitative since they were quantified using the corresponding linear isomer due to lack of standards.
2.4 Analysis of phenolic compounds
The analysis was performed by validated methods from the Swedish Environmental Institute (IVL) (www.ivl.se).
2.5 Blanks and method detection limits (MDLs)
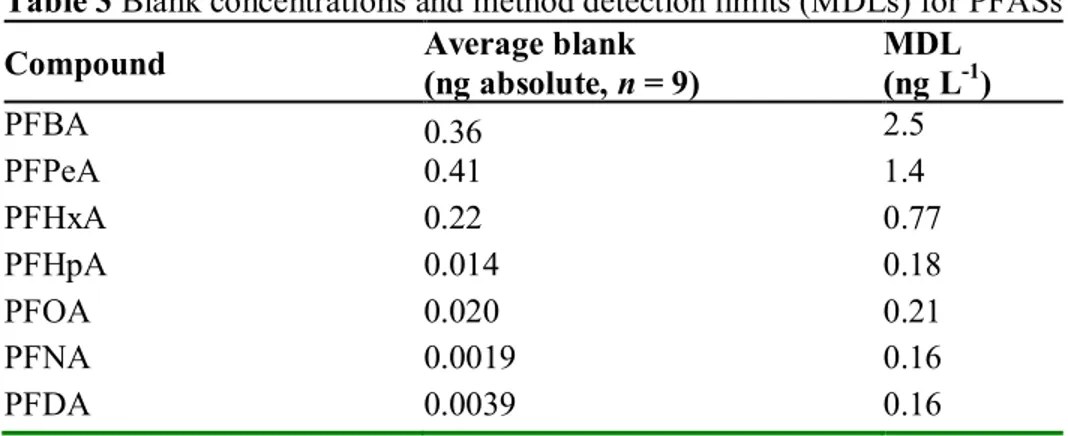
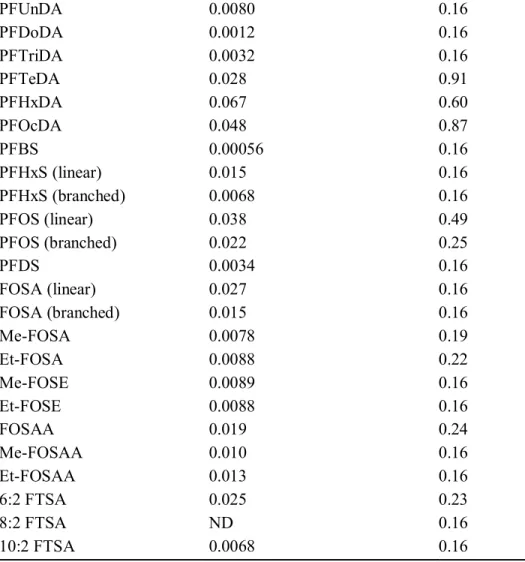
For PFASs, no differences were observed between field and laboratory blanks and therefore both blanks were evaluated together (n = 9). The average blank levels ranged between not detected to 0.41 ng absolute. The method detection limits (MDLs) ranged between 0.16 to 2.5 ng L-1 (for details see Table 3)
Table 3 Blank concentrations and method detection limits (MDLs) for PFASsa Compound Average blank (ng absolute, n = 9) MDL (ng L-1)
PFBA 0.36 2.5 PFPeA 0.41 1.4 PFHxA 0.22 0.77 PFHpA 0.014 0.18 PFOA 0.020 0.21 PFNA 0.0019 0.16 PFDA 0.0039 0.16
5 PFUnDA 0.0080 0.16 PFDoDA 0.0012 0.16 PFTriDA 0.0032 0.16 PFTeDA 0.028 0.91 PFHxDA 0.067 0.60 PFOcDA 0.048 0.87 PFBS 0.00056 0.16 PFHxS (linear) 0.015 0.16 PFHxS (branched) 0.0068 0.16 PFOS (linear) 0.038 0.49 PFOS (branched) 0.022 0.25 PFDS 0.0034 0.16 FOSA (linear) 0.027 0.16 FOSA (branched) 0.015 0.16 Me-FOSA 0.0078 0.19 Et-FOSA 0.0088 0.22 Me-FOSE 0.0089 0.16 Et-FOSE 0.0088 0.16 FOSAA 0.019 0.24 Me-FOSAA 0.010 0.16 Et-FOSAA 0.013 0.16 6:2 FTSA 0.025 0.23 8:2 FTSA ND 0.16 10:2 FTSA 0.0068 0.16 a ND = not detected
For phenolic compounds, the average blank levels ranged between not detected to 70 ng absolute. The method detection limits (MDLs) ranged between 0.013 to 407 ng L-1 (for
details see Table 4).
Table 4 Blank concentrations and method detection limits (MDLs) for phenolic compoundsa Compound Average blank (ng absolute, n = 7) MDL (ng L-1)
4-OP ND 0.47 4-OP-EO1 ND 0.93 4-OP-EO2 0.15 0.92 4-NP ND 5.5 4-NP-EO1 ND 7.5 4-NP-EO2 70 407 TBP 0.033 0.29 PECP ND 0.013 TCS ND 6.2
6
BPA ND 21
a ND = not detected
2.6 Calculation of river fluxes
Fluxes were calculated based on the measured concentration of individual target compound multiplied with the average river flow for Ume älv (367 m3 s-1), Ångermanälven
(399 m3 s-1), Delångersån (12 m3 s-1), Norrström (118 m3 s-1), Nyköpingsån (13 m3 s-1), Emån
(15 m3 s-1), Mörrumsån (18 m3 s-1), Rönneån (9.0 m3 s-1), Göta älv (Alelyckan) (173 m3 s-1), and Nordre älv (403 m3 s-1). It is important to note that the flux calculation is subject to
uncertainties such as varying compound concentration and water flow over time.
3. Results and discussion
3.1 PFAS concentrations, composition profile, sesonal variations and fluxes
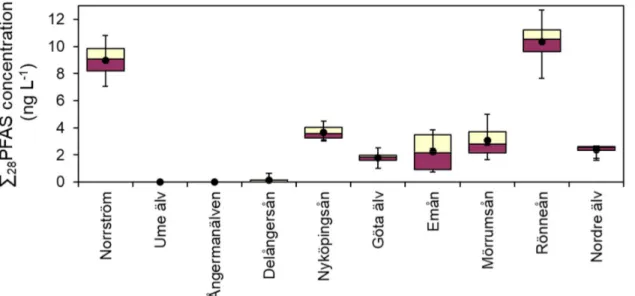
In total, 7 out of 28 PFASs were detected in surface water from the 10 rivers (Table A2 in the Appendix). The average concentration of ∑28PFASs in all samples was 3.2 ng L-1 and
the median 2.4 ng L-1 (n = 40). The PFASs with the highest detection frequency in all samples were PFBS (70%), PFOA (65%), PFOS (branched) (33%), PFHpA (28%), and PFHxS (linear) (20%). Highest average ∑28PFAS concentrations were found in Rönneån with
10 ng L-1 (median 11 ng L-1), followed by Norrström with 9.0 ng L-1 (median 9.1 ng L-1) (Figure 1). No PFASs were detected in Umeå älv and Ångermanälven.
Figure 1. Box-and-whisker plots for ∑28PFAS concentrations in surface water of 10 Swedish
rivers.
7
composition of the ∑28PFASs had PFBS (38 %), PFOA (21%), PFOS (branched) (8.9 %),
PFHpA (4.3 %), PFOS (linear) (4.0 %), and PFHxS (linear) (3.3 %). The composition of the other PFASs was generally <1 %.
Figure 2. Composition profiles (%) for individual PFASs in surface water of 10 Swedish
rivers.
A comparison of the PFAS concentrations during the four seasons October 2016, January 2017, April 2017 and July 2017 is shown in Figure 3. The PFAS concentrations were generally stable over one year. This can be explained by the fact that main PFASs sources such as STP effluents are relatively stable over time (Gago-Ferrero et al., 2017).
Figure 3. Individual PFAS concentrations in surface water of 10 Swedish rivers for the
8
PFOS has an AA-EQS value of 0.65 ng L-1 for fresh water systems (The European Parliament and of the Council, 2013/39/EU) . The AA-EQS was exceeded in 33% (n = 13) of the surface water samples considering the sum of linear and branched PFOS (Figure 4).
Figure 4. Linear and branched PFOS concentrations in surface water of 10 Swedish rivers
for the seasons October 2016 (S1), January 2017 (S2), April 2017 (S3) and July 2017 (S4) and Annual Average Environmental Quality Standard (AA-EQS) of PFOS (0.65 ng L-1) based on the EU Water Framework Directive (WFD).
The daily fluxes of Σ28PFAS was estimated to range between 0 and 92 g d-1 with in total
220 g d-1 for all 10 investigated rivers (Figure 5, Table A3 in the Appendix). The yearly flux was estimated to range between 0 and 33 kg year-1 with in total 81 kg year-1 for all 10 investigated rivers.
Figure 5. PFAS fluxes in g d-1 for individual compound in surface water of 10 Swedish rivers.
9
3.2 Phenolic compound concentrations, composition profile, sesonal variations and fluxes In total, 9 out of 10 phenolic compounds were detected in surface water from the 10 rivers (Table A4 in the Appendix). The average concentration of the sum of the phenolic compounds in all samples was 230 ng L-1, whereas the median was 0 ng L-1 (n = 38). The low median can be
explained by the low detection frequency of 50% for the sum of the phenolic compounds. The phenolic compounds with the highest detection frequency in all samples were 4-NP (32 %), TBP (24 %), 4-OP-EO2 (7.9 %), BPA (5.3 %), and PCP (5.3 %). Highest average of the sum of the phenolic compound concentrations were found in Nyköpingsån with 1500 ng L-1 (median 57 ng L-1), while the for the other rivers the average ranged between 50 ng L-1 and 140 ng L-1, except for Emån where TBP was only detected in one sample with 0.30 ng L-1 (Figure 6).
Figure 6. Box-and-whisker plots for phenolic compound concentrations in surface water of 10
Swedish rivers.
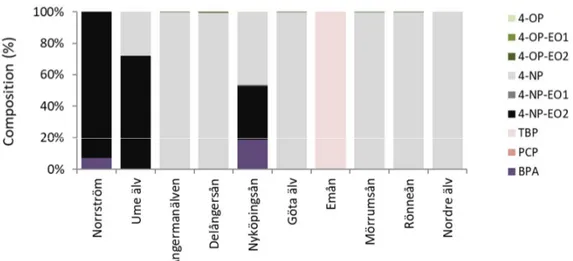
The composition profile of the phenolic compounds differed between the rivers (Figure 7). The highest composition of the sum of the phenolic compounds had 4-NP (67 %), 4-NP-EO2 (20 %), TBP (10 %), and BPA (2.6 %). The composition of the other phenolic compounds was generally <1 %.
10
Figure 7. Composition profiles (%) for individual phenolic compounds in surface water of 10
Swedish rivers.
A comparison of the phenolic compound concentrations during the four seasons October 2016, January 2017, April 2017 and July 2017 is shown in Figure 8. In general, no seasonal trend could be observed. However, one sample at Nyköpingsån showed very high concentrations of the sum of the phenolic compounds (5700 ng L-1) in April 2017, but not during the other seasons.
Figure 8. Individual phenolic compound concentrations in surface water of 10 Swedish rivers
for the seasons October 2016 (S1), January 2017 (S2), April 2017 (S3) and July 2017 (S4). Among the phenolic compounds, 4-NP, 4-OP, and PCP are included in the WFD with an AA-EQS of 300 ng L-1, 100 ng L-1, and 400 ng L-1 (The European Parliament and of the
Council, 2013/39/EU). The AA-EQS of 4-NP was exceeded in 13% (n = 5) of the surface water samples (Figure 9). The AA-EQS of 4-OP and PCP ws not exceeded in any surface water sample (Figures 10 and 11).
11
Figure 9. 4-nonylphenol (4-NP) in surface water of 10 Swedish rivers for the seasons October
2016 (S1), January 2017 (S2), April 2017 (S3) and July 2017 (S4) and Annual Average Environmental Quality Standard (AA-EQS) of 4-NP (300 ng L-1) based on the EU Water Framework Directive (WFD).
Figure 10. 4-octylphenol (4-OP) in surface water of 10 Swedish rivers for the seasons October
2016 (S1), January 2017 (S2), April 2017 (S3) and July 2017 (S4). The Annual Average Environmental Quality Standard (AA-EQS) of the EU Water Framework Directive (WFD) is 100 ng L-1 for 4-OP.
12
Figure 11. Pentachlorophenol (PCP) in surface water of 10 Swedish rivers for the seasons
October 2016 (S1), January 2017 (S2), April 2017 (S3) and July 2017 (S4). The Annual Average Environmental Quality Standard (AA-EQS) of the EU Water Framework Directive (WFD) is 400 ng L-1 for PCP.
The daily fluxes of the sum of phenolic compounds was estimated to range between 0.13 and 4800 g d-1 with in total 16000 g d-1 for all 10 investigated rivers (Figure 12, Table A5 in the
Appendix). The yearly flux was estimated to range between 0.049 and 1700 kg year-1 with in total 5700 kg year-1 for all 10 investigated rivers.
Figure 12. Fluxes of individual phenolic compound in g d-1 in surface water of 10 Swedish rivers.
13
References
1. Giesy, J.P., Naile, J.E., Khim, J.S., Jones, K.C., Newsted, J.L. 2010. Aquatic toxicology of perfluorinated chemicals. Rev Environ Contam T. 202, 1–52.
2. Oehlmann, J., Schulte-Oehlmann, U., Tillmann, M., Markert, B. 2000. Effects of endocrine disruptors on prosobranch snails (mollusca: Gastropoda) in the laboratory. Part I: Bisphenol A and octylphenol as xeno-estrogens. Ecotoxicology. 9, 383–97.
3. Buck, R.C., Franklin, J., Berger, U., Conder, J.M., Cousins, I.T., De Voogt, P., Jensen, A.A., Kannan, K., Mabury, S.A., Van Leeuwen, S.P.J. 2011. Perfluoroalkyl and polyfluoroalkyl substances in the environment: Terminology, classification, and origins. Integr Environ Assess Manag. 7, 513–41.
4. Bennie, D.T. 1999. Review of the environmental occurrence of alkylphenols and alkylphenol ethoxylates. Water Qual Res J Can. 34, 79–122.
5. Ahrens, L. 2011. Polyfluoroalkyl compounds in the aquatic environment: A review of their occurrence and fate. J Environ Monitor. 13, 20–31.
6. Ahrens, L., Bundschuh, M. 2014. Fate and effects of poly- and perfluoroalkyl substances in the aquatic environment: A review. Environ Toxicol Chem. 33, 1921–9.
7. Bolz, U., Hagenmaier, H., Körner, W. 2001. Phenolic xenoestrogens in surface water, sediments, and sewage sludge from Baden-Württemberg, south-west Germany. Environ Pollut. 115, 291–301.
8. Ahrens, L., Norström, K., Viktor, T., Palm Cousins, A., Josefsson, S. 2015. Stockholm Arlanda Airport as a source of per- and polyfluoroalkyl substances to water, sediment and fish. Chemosphere. 129, 33–8.
9. Voutsa, D., Hartmann, P., Schaffner, C., Giger, W. 2006. Benzotriazoles, alkylphenols and bisphenol A in municipal wastewaters and in the Glatt River, Switzerland. Environ Sci Pollut R. 13, 333–41.
10. EU. European Parliament and Council, European Community Directive 2006/122/ECOF, Off. J. Eur. Union, 2006, L 372, 32-34 [
11. The European Parliament and of the Council. Off J Eur Commun EC Directive 2013/39/EU, in Amending Directives 2000/60/EC and 2008/105/EC as regards priority substances in the field of water policy.
12. Swedish National Food Agency (Livsmedelsverket) 2018. Riskhantering - PFAA I dricksvatten. http://www.livsmedelsverket.se/livsmedel-och-innehall/oonskade-amnen/miljogifter/pfas-poly-och-perfluorerade-alkylsubstanser/riskhantering-pfaa-i-dricksvatten/ (28/02/2018).
13. Ahrens, L., Barber, J.L., Xie, Z., Ebinghaus, R. 2009. Longitudinal and latitudinal distribution of perfluoroalkyl compounds in the surface water of the Atlantic Ocean. Environ Sci Technol. 43, 3122–7.
14. Gago-Ferrero, P., Gros, M., Ahrens, L., Wiberg, K. 2017. Impact of on-site, small and large scale wastewater treatment facilities on levels and fate of pharmaceuticals, personal care products, artificial sweeteners, pesticides, and perfluoroalkyl substances in recipient waters. Sci Total Environ. 601-602, 1289–97.
Appendix
14
Appendix
Table A1 Sampling details for the sampling sites
ID Station name SLU-site code Latitudea Longitudea Sampling date
Sampling time October 2016
PFAS - AC1017-1 Ume älv
(Stornorrfors)
AC1017 7090408 748141 2016-10-17 08:15
PFAS - Y0022-1 Ångermanälven Y0022 7006749 614061 2016-10-18 12:40
PFAS - X0027-1b Delångersån
(Iggesund)
X0027 6835609 610559 2016-10-12 11:30
PFAS - AB0037-1 Norrström AB0037 6580488 674315 2016-10-14 08:00
PFAS - D0040-1 Nyköpingsån D0040 6520892 611899 2016-10-12 10:00
PFAS - H0044-1 Emån H0044 6334282 587847 2016-10-11 13:00
PFAS - K0047-1 Mörrumsån K0047 6227369 484539 2016-10-25 NA
PFAS - M0053-1 Rönneån M0053 6221174 384636 2016-10-20 09:25
PFAS - O0069-1 Göta älv
(Alelyckan)
O0069 6406625 321848 2016-10-18 09:40
PFAS - O0075-1c Nordre älv O0075 6415821 316588 2016-10-18 10:40
January 2017
PFAS - AC1017-2 Ume älv
(Stornorrfors)
AC1017 7090408 748141 2017-02-06 NA
PFAS - Y0022-2 Ångermanälven Y0022 7006749 614061 2017-01-13 13:13
PFAS - X0027-2b Delångersån
(Iggesund)
Appendix
15
PFAS - AB0037-2 Norrström AB0037 6580488 674315 2017-01-17 08:20
PFAS - D0040-2 Nyköpingsån D0040 6520892 611899 2017-01-19 11:05
PFAS - H0044-2 Emån H0044 6334282 587847 2017-01-17 13:20
PFAS - K0047-2 Mörrumsån K0047 6227369 484539 2017-01-16 13:00
PFAS - M0053-2 Rönneån M0053 6221174 384636 2017-01-18 12:45
PFAS - O0069-2 Göta älv
(Alelyckan)
O0069 6406625 321848 2017-01-17 09:50
PFAS - O0075-2 Nordre älv O0075 6415821 316588 2017-01-17 11:10
April 2017
PFAS - AC1017-3 Ume älv
(Stornorrfors)
AC1017 7090408 748141 2017-04-11 08:00
PFAS - Y0022-3 Ångermanälven Y0022 7006749 614061 2017-04-10 14:00
PFAS - X0027-3b Delångersån
(Iggesund)
X0027 6835609 610559 2017-04-10 08:45
PFAS - AB0037-3 Norrström AB0037 6580488 674315 2017-04-18 17:00
PFAS - D0040-3 Nyköpingsån D0040 6520892 611899 2017-04-12 10:35
PFAS - H0044-3 Emån H0044 6334282 587847 2017-05-08 14:00
PFAS - K0047-3 Mörrumsån K0047 6227369 484539 2017-04-19 07:30
PFAS - M0053-3 Rönneån M0053 6221174 384636 2017-04-20 08:05
PFAS - O0069-3 Göta älv
(Alelyckan)
O0069 6406625 321848 2017-04-11 09:40
PFAS - O0075-3 Nordre älv O0075 6415821 316588 2017-04-12 NA
July 2017
PFAS - AC1017-4 Ume älv
(Stornorrfors)
AC1017 7090408 748141 2017-07-12 16:00
Appendix
16
PFAS - X0027-4b Delångersån
(Iggesund)
X0027 6835609 610559 2017-07-03 09:40
PFAS - AB0037-4 Norrström AB0037 6580488 674315 2017-07-12 09:45
PFAS - D0040-4 Nyköpingsån D0040 6520892 611899 2017-07-12 09:20
PFAS - H0044-4c Emån H0044 6334282 587847 2017-07-11 11:10
PFAS - K0047-4 Mörrumsån K0047 6227369 484539 2017-07-13 13:30
PFAS - M0053-4 Rönneån M0053 6221174 384636 2017-07-19 13:30
PFAS - O0069-4 Göta älv
(Alelyckan)
O0069 6406625 321848 2017-07-20 09:18
PFAS - O0075-4 Nordre älv O0075 6415821 316588 2017-07-20 11:00
Appendix
17
Table A2 Levels of detected PFASs in Swedish rivers (ng L-1)a
Station name ID PFHpA PFOA PFBS PFHxS
(linear) PFHxS (branched) PFOS (linear) PFOS (branched) FOSA 6:2 FTSA ΣPFASs
October 2016
Ume älv (Stornorrfors) AC1017-1 <0.18 <0.21 <0.16 <0.16 <0.16 <0.49 <0.25 <0.16 <0.23 ND
Ångermanälven Y0022-1 <0.18 <0.21 <0.16 <0.16 <0.16 <0.49 <0.25 <0.16 <0.23 ND
Delångersån (Iggesund) X0027-1-AVG <0.18 <0.21 <0.16 <0.16 <0.16 <0.49 <0.25 <0.16 <0.23 ND
Norrström AB0037-1 0.89 1.6 2.0 1.2 <0.16 2.0 1.8 <0.16 1.2 11
Nyköpingsån D0040-1 0.74 1.0 1.7 <0.16 <0.16 <0.49 1.1 <0.16 <0.23 4.5
Emån H0044-1 <0.18 <0.21 0.98 <0.16 <0.16 <0.49 <0.25 <0.16 <0.23 0.98
Mörrumsån K0047-1 0.67 0.94 0.71 <0.16 <0.16 <0.49 <0.25 <0.16 <0.23 2.3
Rönneån M0053-1 0.62 1.0 1.6 2.3 0.62 2.6 2.0 <0.16 <0.23 11
Göta älv (Alelyckan) O0069-1 <0.18 1.2 0.65 <0.16 <0.16 <0.49 <0.25 <0.16 <0.23 1.8
Nordra älv O0075-1 <0.18 1.2 0.54 <0.16 <0.16 <0.49 0.93 <0.16 <0.23 2.6
January 2017
Ume älv (Stornorrfors) AC1017-2 <0.18 <0.21 <0.16 <0.16 <0.16 <0.49 <0.25 <0.16 <0.23 ND
Ångermanälven Y0022-2 <0.18 <0.21 <0.16 <0.16 <0.16 <0.49 <0.25 <0.16 <0.23 ND
Delångersån (Iggesund) X0027-2-AVG <0.18 <0.21 <0.16 <0.16 <0.16 <0.49 <0.25 <0.16 <0.23 ND
Norrström AB0037-2 0.74 1.4 2.11 0.98 <0.16 1.6 1.7 <0.16 <0.23 8.6
Nyköpingsån D0040-2 0.69 0.99 1.4 <0.16 <0.16 <0.49 <0.25 <0.16 <0.23 3.1
Emån H0044-2 <0.18 <0.21 0.73 <0.16 <0.16 <0.49 <0.25 <0.16 <0.23 0.73
Mörrumsån K0047-2 <0.18 0.81 0.82 <0.16 <0.16 <0.49 <0.25 <0.16 <0.23 1.6
Rönneån M0053-2 <0.18 0.75 1.3 2.3 0.72 2.6 2.5 <0.16 <0.23 10
Göta älv (Alelyckan) O0069-2 <0.18 0.97 0.55 <0.16 <0.16 <0.49 0.99 <0.16 <0.23 2.5
Nordra älv O0075-2 <0.18 1.1 0.60 <0.16 <0.16 <0.49 0.80 <0.16 <0.23 2.5
April 2017
Ume älv (Stornorrfors) AC1017-3 <0.18 <0.21 <0.16 <0.16 <0.16 <0.49 <0.25 <0.16 <0.23 ND
Appendix
18
Delångersån (Iggesund) X0027-3-AVG <0.18 <0.21 <0.16 <0.16 <0.16 <0.49 <0.25 <0.16 <0.23 ND
Norrström AB0037-3 0.62 1.2 2.8 0.94 <0.16 <0.49 1.4 <0.16 <0.23 7.0
Nyköpingsån D0040-3 0.68 0.87 1.7 <0.16 <0.16 <0.49 <0.25 0.563 <0.23 3.8
Emån H0044-3 0.68 0.73 1.9 <0.16 <0.16 <0.49 <0.25 <0.16 <0.23 3.3
Mörrumsån K0047-3 <0.18 0.81 2.5 <0.16 <0.16 <0.49 <0.25 <0.16 <0.23 3.3
Rönneån M0053-3 <0.18 0.71 2.0 1.2 <0.16 2.2 1.5 <0.16 <0.23 7.6
Göta älv (Alelyckan) O0069-3 <0.18 1.0 <0.16 <0.16 <0.16 <0.49 <0.25 <0.16 <0.23 1.0
Nordra älv O0075-3 <0.18 1.1 0.66 <0.16 <0.16 <0.49 <0.25 <0.16 <0.23 1.7
July 2017
Ume älv (Stornorrfors) AC1017-4 <0.18 <0.21 <0.16 <0.16 <0.16 <0.49 <0.25 <0.16 <0.23 ND
Ångermanälven Y0022-4 <0.18 <0.21 <0.16 <0.16 <0.16 <0.49 <0.25 <0.16 <0.23 ND
Delångersån (Iggesund) X0027-4-AVG <0.18 <0.21 0.63 <0.16 <0.16 <0.49 <0.25 <0.16 <0.23 0.63
Norrström AB0037-4 0.77 1.4 2.5 1.2 <0.16 1.8 1.9 <0.16 <0.23 9.5
Nyköpingsån D0040-4 <0.18 1.1 2.2 <0.16 <0.16 <0.49 <0.25 <0.16 <0.23 3.3
Emån H0044-4 <0.18 1.1 2.7 <0.16 <0.16 <0.49 <0.25 <0.16 <0.23 3.9
Mörrumsån K0047-4 0.67 0.95 3.4 <0.16 <0.16 <0.49 <0.25 <0.16 <0.23 5.0
Rönneån M0053-4 <0.18 0.87 2.0 2.75 0.66 3.1 3.3 <0.16 <0.23 13
Göta älv (Alelyckan) O0069-4 <0.18 1.1 0.70 <0.16 <0.16 <0.49 <0.25 <0.16 <0.23 1.8
Nordra älv O0075-4 <0.18 1.0 0.69 <0.16 <0.16 <0.49 0.83 <0.16 <0.23 2.6
Appendix
19
Table A3 Fluxes for individual PFASs in g d-1
PFHpA PFOA PFBS PFHxS (linear) PFHxS (branched) PFOS (linear) PFOS (branched) FOSA (linear) 6:2 FTSA ΣPFASs Ume älv (Stornorrfors) 0 0 0 0 0 0 0 0 0 0 Ångermanälven 0 0 0 0 0 0 0 0 0 0 Delångersån (Iggesund) 0 0 0.17 0 0 0 0 0 0 0.17 Norrström 7.7 14 24 11 0 14 17 0 3.2 92 Nyköpingsån 0.58 1.1 1.9 0 0 0 0.29 0.15 0 4.0 Emån 0.23 0.62 2.1 0 0 0 0 0 0 3.0 Mörrumsån 0.52 1.4 2.9 0 0 0 0 0 0 4.8 Rönneån 0.12 0.67 1.4 1.7 0.40 2.1 1.8 0 0 8.2 Göta älv (Alelyckan) 0 16 7.1 0 0 0 3.7 0 0 27 Nordre älv 0 38 22 0 0 0 22 0 0 82
Appendix
20
Table A4 Levels of detected phenolic compounds in Swedish rivers (ng L-1)a
Station name ID 4-OP 4-NP TBP PCP 4-NP-EO1 4-OP-EO1 BPA 4-OP-EO2 4-NP-EO2
October 2016
Ume älv (Stornorrfors) AC1017-1 <0.47 160 <0.29 <0.013 <7.5 <0.93 <21 <0.92 <407
Ångermanälven Y0022-1 <0.47 390 0.56 <0.013 <7.5 <0.93 <21 1.1 <407
Delångersån (Iggesund) X0027-1-AVG <0.47 <5.5 <0.29 <0.013 <7.5 <0.93 <21 <0.92 <407
Norrström AB0037-1 <0.47 <5.5 <0.29 <0.013 <7.5 <0.93 38 <0.92 <407
Nyköpingsån D0040-1 <0.47 100 <0.29 <0.013 <7.5 <0.93 <21 <0.92 <407
Emån H0044-1 <0.47 <5.5 <0.29 <0.013 <7.5 <0.93 <21 <0.92 <407
Mörrumsån K0047-1 <0.47 120 <0.29 <0.013 <7.5 <0.93 <21 1.0 <407
Rönneån M0053-1 <0.47 140 <0.29 <0.013 <7.5 <0.93 <21 <0.92 <407
Göta älv (Alelyckan) O0069-1 <0.47 <5.5 <0.29 <0.013 <7.5 <0.93 <21 <0.92 <407
Nordra älv O0075-1 NA NA NA NA NA NA NA NA NA
January 2017
Ume älv (Stornorrfors) AC1017-2 <0.47 <5.5 0.35 <0.013 <7.5 <0.93 <21 <0.92 <407
Ångermanälven Y0022-2 <0.47 160 <0.29 <0.013 <7.5 <0.93 <21 <0.92 <407
Delångersån (Iggesund) X0027-2-AVG <0.47 93 <0.29 <0.013 <7.5 <0.93 <21 0.43 <407
Norrström AB0037-2 <0.47 <5.5 0.72 <0.013 <7.5 <0.93 <21 <0.92 <407
Nyköpingsån D0040-2 12 <5.5 1.1 0.61 <7.5 <0.93 <21 <0.92 <407
Emån H0044-2 <0.47 <5.5 0.30 <0.013 <7.5 <0.93 <21 <0.92 <407
Mörrumsån K0047-2 <0.47 360 0.65 <0.013 <7.5 <0.93 <21 1.0 <407
Rönneån M0053-2 <0.47 350 0.77 <0.013 <7.5 <0.93 <21 0.94 <407
Göta älv (Alelyckan) O0069-2 <0.47 350 0.42 0.07 <7.5 <0.93 <21 1.1 <407
Nordra älv O0075-2 <0.47 150 <0.29 <0.013 <7.5 <0.93 <21 <0.92 <407
April 2017
Ume älv (Stornorrfors) AC1017-3 <0.47 <5.5 <0.29 <0.013 <7.5 <0.93 <21 <0.92 410 Ångermanälven Y0022-3 <0.47 <5.5 <0.29 <0.013 <7.5 <0.93 <21 <0.92 <407 Delångersån (Iggesund) X0027-3-AVG <0.47 <5.5 <0.29 <0.013 <7.5 <0.93 <21 <0.92 <407
Norrström AB0037-3 <0.47 <5.5 <0.29 <0.013 <7.5 <0.93 <21 <0.92 500
Appendix
21
Emån H0044-3 <0.47 <5.5 <0.29 <0.013 <7.5 <0.93 <21 <0.92 <407
Mörrumsån K0047-3 <0.47 <5.5 <0.29 <0.013 <7.5 <0.93 <21 <0.92 <407
Rönneån M0053-3 <0.47 <5.5 <0.29 <0.013 <7.5 <0.93 <21 <0.92 <407
Göta älv (Alelyckan) O0069-3 <0.47 <5.5 <0.29 <0.013 <7.5 <0.93 <21 <0.92 <407
Nordra älv O0075-3 <0.47 <5.5 <0.29 <0.013 <7.5 <0.93 <21 <0.92 <407
July 2017
Ume älv (Stornorrfors) AC1017-4 <0.47 <5.5 <0.29 <0.013 <7.5 <0.93 <21 <0.92 <407 Ångermanälven Y0022-4 <0.47 <5.5 <0.29 <0.013 <7.5 <0.93 <21 <0.92 <407 Delångersån (Iggesund) X0027-4B-AVG <0.47 <5.5 <0.29 <0.013 <7.5 <0.93 <21 <0.92 <407
Norrström AB0037-4 <0.47 <5.5 <0.29 <0.013 <7.5 <0.93 <21 <0.92 <407
Nyköpingsån D0040-4 <0.47 <5.5 <0.29 <0.013 <7.5 <0.93 <21 <0.92 <407
Emån H0044-4 NA NA NA NA NA NA NA NA NA
Mörrumsån K0047-4 <0.47 <5.5 <0.29 <0.013 <7.5 <0.93 <21 <0.92 <407
Rönneån M0053-4 <0.47 <5.5 <0.29 <0.013 <7.5 <0.93 <21 <0.92 <407
Göta älv (Alelyckan) O0069-4 <0.47 <5.5 <0.29 <0.013 <7.5 <0.93 <21 <0.92 <407
Nordra älv O0075-4 <0.47 <5.5 <0.29 <0.013 <7.5 <0.93 <21 <0.92 <407
Appendix
22
Table A5 Fluxes for individual phenolic compound in g d-1
4-OP 4-OP-EO1 4-OP-EO2 4-NP 4-NP-EO1 4-NP-EO2 TBP PCP BPA Ume älv (Stornorrfors) 0 0 0 462 0 1185 1.0 0 0 Ångermanälven 0 0 3.5 1732 0 0 1.8 0 0 Delångersån (Iggesund) 0 0 0.041 8.9 0 0 0.032 0 0 Norrström 0 0 0 0 0 465 0.67 0 35 Nyköpingsån 1.2 0.15 0 269 3.4 199 0.11 0.061 110 Emån 0 0 0 0 0 0 0.049 0 0 Mörrumsån 0 0 0.28 68 0 0 0.093 0 0 Rönneån 0 0 0.068 35 0 0 0.056 0 0 Göta älv (Alelyckan) 0 0 1.5 476 0 0 0.57 0.10 0 Nordre älv 0 0 0 635 0 0 0 0 0