o|se _ the. -
cha|leng-" Reprint from Tire Technology International 99, pp. 98 101
,
&
Ulf Sandberg, VTI
&
*
J.A. Ejsmont, P. Mioduszewskiand S. Taryma,
*
Technical University of Gdansk, Poland +
m
05
O'!
v-lIn
N
m
x 0 >-. h ...: a. 35 U)* * * Swedish NationalRoadand
VTI särtryck 325 - 1999
Noise - the challenge
Reprint from Tire Technology International 99, pp. 98 101
Ulf Sandberg, VTI
J.A. Ejsmont, P. Mioduszewski and S. Taryma,
Technical University of Gdansk, Poland
An EU directive laying
own noise emission
limits for tires is underway.
Although tire/road noise
can be reduced further, it
is sometimes implied that
this means sacrificing
safety or economy
U. Sandberg, Swedish National Road
and Transport Research Institute, and
]. A. Ejsmont, P. Mioduszewshi &
S. Taryma, Technical University
of Gdansk, Poland
ar tires are constructed for safe,
economical and environmen-tally friendly driving. Three performance measures that represent the major operational character-istics of tires under those headings are:
' Wet friction;
' Rolling resistance (since the latter
affects fuel consumption it also affects economy and exhaust emissions);
' Noise emission.
It is sometimes claimed that when trying
to reduce exterior noise emission, there is
a conflict with friction, and perhaps with rolling resistance. The implication is that tire/road noise cannot be reduced any fur-ther without sacrificing safety or econ-omy. An EU directive with noise emission limits for tires is under consideration.
Assuming a conflict between require
ments for low noise and high friction, one EU country has suggested that friction
limits should also be introduced. Therefore it is important to study this matter further.
Earlier studies have indicated that there is no consistent conflict between friction and noise characteristics with respect to road surfaces 1. For 12 tires tested on five surfaces2 no significant noise friction cor-relation was found until the friction values were normalised in an unusual way, when weak conflicts between noise and friction were found. Tests in 19923 for 16 car tires and nine truck tires indicated weak and conflicting noise safety correlations, but this may have been biased by the inclusion of a wide range of tire widths. According to Ejsmonti, a general conflict between noise and rolling resistance properties could not be found.
The pilot study discussed in this article was carried out in 1997 to study relations
between exterior tire/road noise emission,
Tire Technology International 99
Figure 1: The trailer from TUG used for measurement of noise with the CPX method. The test tire is in the centre of the enclosure
Figure 3: The drum facility at TUG for measuring rolling resistance. Although not shown here, the roadwheel was equipped with two surfaces: a sandpaper surface and a rough textured surface similar to a chip seal
wet friction and rolling resistance of exist
ing car tires. Exterior tire/road noise was
measured by the Technical University of Gdansk (TUG) on roads close to the Swedish Road and Transport Research
Institute (VTI) with the CPX method,
ISO/CD 11819 2, 1997, (i.e. with two microphones located close to the test tire, the latter enclosed and free rolling, in a trailer of the type shown in Figure 1).
The measuring distance was 160m per
site; two runs were made.
Friction was measured by VTI with the
BV12 friction test vehicle (Figure 2) run
ning at 70km/h with the test tire at a con stant slip, close to the optimum slip (11 per cent), as well as with locked wheel (100 per cent slip). The braking torque on the test tire as well as its rolling circumfer ence were measured, and by knowing the
fixed normal force (4,000N), the friction
coefficient was calculated. The measuring distance was 150m for the optimum slip case and 2 )( 40m for the locked tire case. The surface was wetted, with approxi-mately 0.5mm average water depth.
Vehicle and tire manufacturers usually also make other types of wet friction tests, most notably hydroplaning tests and tests with side forces applied. The budget of
Figure 2: The BV12 friction test vehicle used for friction measurements. The test tire is in the middle between the front and rear axles. Water is ejected in front of the test tire
this project did not allow this. The method chosen here is similar to the method suggested recently to ECE/ GRRF, ECE/GRB and to the European Commission. Recognising that it would be justified to use other measurements of
friction, the method chosen was
consid-ered the most appropriate in this case, because a possible future tire regulation or directive may be based upon it.
Rolling resistance was measured on the laboratory drum facility at TUG (Figure 3) with a test tire rolling against a 1.7m diameter drum. The tire was loaded against the drum surface by gravitational force and the rolling resistance coefficient was measured by the torque method.
The rolling resistance measurements were made basically according to ISO/CD
8767, 1997 (revision of 150 8767 from
1992), but there were deviations with
respect to load and in ation. The load
was fixed to 4,12ON and inflation was
adjusted according to ISO, but assuming that BOOkPa corresponds to maximum load. Temperature corrections were made to a reference temperature of 24°C.
Table 1 presents a summary of meth ods and test parameters. The test surfaces are further described in Table 2; all except these used in the rolling resistance indoor measurements were located near VTI on trafficked roads. Surfaces designated GRB were selected to satisfy the specification for one smooth and one rough reference surface in a proposal to ECE/GRB 1990.
The tested tires are briefly described in Table 3. In total, the data set comprised 28 samples of modern car tires selected to
be as representative as practical. Table 3: Tested tires. One tire per manufacturer in each group, with most 'major' manufacturers represented. One summer and one friction tire were retreaded
104
0 Speed class H tyres ? A Speed class V tyres Ej . Friction tyres E 102 O 8 A % 100 e A
å
4- Lift 9
Oo
' (P
0 98 0En.
2° y = 2,2 9x + 97,87" R2 00248 96 . 0,5 0,6 0,7 0,8 0,9 1,0Friction coeff. (opt. slip)
. 104
s
A 0
E.. 8 102 QS%
..
°
E
31%
% 100 " = 0 ml .O £0 a: (DS 98 OSpeed class H tyres '"
_§_§ y = 2,9 049x + 98.559 ASpeed class v tyres
ZQ R2 : 010429 .Frictlon tyres
96
l
l
0,5 0,6 0,7 0,8 0,9 1,0
Friction coeff. (opt. slip) 104 R y = 5,8018x + 94,983 5 re? = 0,1453
%
"" 102 % o "5 A 2CD& 100 . .))XM_ OA ,.A A ml . O<9
ca
.0 98 . ' 0 Speed class H tyres
% 0 A Speed class V tyres
Z . Friction tyres. .
96 . .
0,5 0,6 0,7 0,8 0,9 1,0
Friction coeff. (opt. slip)
Tire Technology lnternational 99
0,8
104 . .
0 Speed class H tyres
&": ASpeed class V tyres
EE 0 Friction tyres 2102 % A t
a
OA
' A V100 = f .8
ad s/ea
a
;: .19
o 98 o 8 g r = 5,2734x + 97,043 R2 = 0,046 96 0,3 0,4 015 016 017Friction coeff. (locked wheel) 104 (A) ] 102 _.. \ O O
No is e on G R B sm oo th surf ac e [d B
98 OSpeed class H tyres = 4 3761x + 98,591 ASpeed class V tyres
R? : 010314 .Friction tyres
96 l 1
0,3 0,4 0,5 0,6 0,7 0,8
Friction coeff (locked wheel) 104 _. y = 1( ,469X + 94,366 $ F22 = 0,1566
%
'_'1 02 å o % A A .: A9100
.c. O
-O, % å . o &g
l
g 98 * OSpeed class H tyres
g O ASpeed class V tyres . Friction tyres
96 l %
0,3 0,4 0,5 0,6 0,7 0,8
Friction coeff. (locked wheel)
Figure 4: Relation between sound level in dB(A) on the vertical scale, and friction coefficient (optimum slip left, locked wheel right) on the horizontal scale
104 ,
x 0 Speed class H tyres % A Speed class V tyres
E102 0 Friction tyres "l: a o A A A AI
% 10°
o'" ::./"
F KPO .s
ao
_ 6 & g 98 m & y = 196,4 7x + 97,432 2° R2 = 00813 96 , 0,000 0,005 0,010 0,015Rolling resistance, safety walk" surface, 80 km/h
0,020
104 ,
% OSpeed class H tyres
% ASpeed class V tyres 0 A .._..% 102 - | Friction tyres o A "= A
a
"Bey
£ ' ' % 100 få? OA Ull O 8 0 m%
S 98 a) y = 212,63x + 98,377 % R2 = 0,0943 Z 96 0,000 0,005 0,010 0,015Rolling resistance, "safety walk" surface, 80 km/h 0,020 gh su rf ac e [d B( A) ] S No is e on G R B ro u
Measurements of noise emission
were also made with the laboratory drum
method, in which case several more tires were tested, but these results are not
included.
Correlations between the tested para
meters, for all 28 car tires, were calculated (Figures 4 to 6). Wet friction was tested
only on a fairly smooth surface. This was motivated by the fact that wet friction would not be a maj or problem on any rough surface. However, noise is a prob-lem on both smooth and rough surfaces. The same applies to rolling resistance. The sandpaper surface used for rolling resis tance measurements here was the only rea sonable smooth surface available on the drum. It is likely that rolling resistance on
the GRB smooth surface would be similar,
at least with respect to tire ranking, since tire ranking is fairly similar on the two
sur-faces actually used (Safety Walk and APS).
Data here is condensed since averaging has been made with respect to microphone position (two- microphones were used in the noise tests), and with respect to test speeds in the noise and rolling resistance tests (80km/h). So far, frequency spectral correlations have not been studied.
Correlation coefficients higher than 0.37 (corresponding to R2 > 0.14) for the data set of 28 tires indicate a relationship that is statistically significant on the 95 per cent level. Such correlations occurred only for noise on the rough textured road surface when related to friction on the smooth textured surface, i.e. in only two of the siX tested cases. The relationship was so weak that there are many tires that give both high friction and low or
medium noise (Figure 4), albeit the trend
is the same as that noted by Nelson et 2113. The relation between noise and rolling
resistance was never significant in this test (Figure 5).
Random errors in the noise measure
ments must be very small since the
%
y = 146,38x + 97,067 R? = 0057A 100 A; A ' Väg./A
. . r;>
98 4 OSpeed class H tyres .A Speed class V tyres CF 0 . Friction tyres
96 l
0,000 0,005 0,010 0,015 0,020
Rolling resistance, rough surface (APS), 80 km/h
Tire Technology International '99
104 104 104 ä. % y=0,825l9x+14,919 å,: - A o % % R == 0,8402 19. / få 102 "5 102 8 102 o (0 (U %:: gm - %tn
Sr; 100
00100
8100
" ' a?
9 9 g 4g9
8 98 class H tyresgå
0 98n/
7 0 Speed Class H tyres _a?
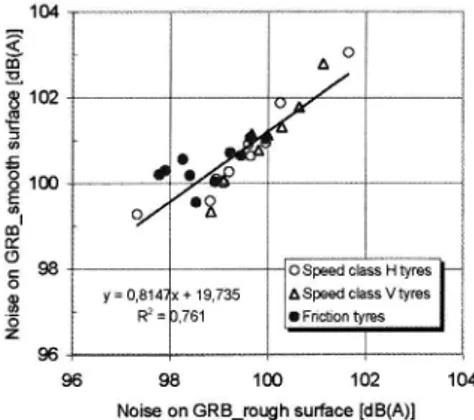
C 98 0 Speed class H tyres& class V tyres % _ A Speed class V tyres 8 y = 0,8147x + 19,735 A Speed class V tyres å z o Friction tyres g ~ R2 = 0761 o Friction tyres
96 z
9696 98 100 102 104 96 98 100 162 104 9696 98 100 102' 104
Noise on GRB__rough surface [dB(A)]
Noise on GRB__smooth surface [dB(A)] Noise on GRB__rough surface [dB(A)]
Figure 6: Relation between the sound level in dB(A) from tires, measured on three surfaces
relationships between the various noise unlikely to sacrifice wet friction or rolling 4- Ejsmont,]., Tire/mad 056 and Hing mmm
. . . Is there a trade-off. Proc. of the International
measurements, conducted independently. . . resrstance. However, further investigations. . Tire/Road Norse Conference, Gothenburg, 1990._ _ on different surfaces, are high, With the are recommended in order to include
highest being R2 = 0.96 (Figure 6). A more tires in the analyses. Such measure corresponding analysis of rolling resis~ merits have been conducted very recently, tance measurements on the Safety Walk but results are not yet available. . and APS surfaces, conducted totally inde. . _ References *
pendently, also indicated a gOOd relation, 1. Sandberg, U., Noise and the road Is there a Wthh mUSt mean that random errors con ict between requirements for safety and
are small even in the rolling feSiStaHCe noise? , Journal Ingén. de FAutornobileJan-Feb measurements, 1987 (Reprint No.]ZO, VTI, Linhoping, Sweden).
ln conclusion, the pilot study appears Z . Denher, D., Tread noise and driving safety ,
to indicate that there is no significant DOC'NSZ bmm m ISO/TC43/5C1/
. . . . WGZ 7, 1989.
conflict between friction and norse or ., . . .
b ll' _ Cl _ h 3. Nelson, P., et al., An examination of the
relation-etweén ro trig-re stance an nOise. _T ship between tire noise and safety performance , reduction Of nOise em1551on by EStathh Doc. lll/5029/94 submitted to the ERGA-Noise
ing limits to tire/road noise from tires is group under the EU Commission, 1993.
ow to measure braking and steering forces
under closely controlled conditions
At the VTI Tyre Testing Facility in Sweden this can be performed on different types of road surfaces. One of the most important applications is testing on an ice-covered road surface.
Inside a 154 metre long building, a 55 metre long moving steel track, representing the road surface, is moved back and forth under the measuring wheel. The track is pulled by a hydraulic motor with a steel cable at speeds of up to 36 km/h. Braking and steering forces can be measured under closely controlled conditions, including climate.
Typical applications of the tyre testing facility are tyre development, stud development, tyre data for calculating, future functional type testing, consumer information and research into tyre friction on ice.
We welcome new commissions. Please contact lVlr Olle Nordström, Senior Research Leader.
VTI Tyre Testing Facility measures braking and steering forces in lorry and car tyres. Tyre testing on ice is an
important speciality.
Swedish National Road and
' Transport Research Institute
RESEARCH FOR MOBILITY
Swedish National Road and Transport Research Institute, 8-581 95 Linköping, Sweden