LINA ALDÉN & MATS HAMMARSTEDT
2017:5
Self-employment and life
satisfaction among the elderly
Self-employment and life satisfaction among the elderly:
Survey-based evidence from Sweden
by Lina Aldén
Linnaeus University Centre for Discrimination and Integration Studies Linnaeus University
SE-351 95 Växjö Sweden lina.alden@lnu.se Mats Hammarstedt
Linnaeus University Centre for Discrimination and Integration Studies Linnaeus University
SE-351 95 Växjö Sweden
mats.hammarstedt@lnu.se Abstract
This paper compares life satisfaction among the elderly (61 years of age or older) who are self-employed, wage-employed or out of the labour force in Sweden with the help of a unique survey. Sweden is interesting since the share of elderly, just as in other countries, has increased during the last decade. Encouraging the elderly to remain in the labour force is now high on the political agenda. We find that people who are self-employed report higher life satisfaction than people who are wage-employed or out of the labour force. General health is a strong determinant of life satisfaction but the differences among the groups remain when we control for health related variables. Further, the self-employed report higher job satisfaction than the wage-employed, and find their work less mentally stressful. Even though our results are driven by different types of selection, we conclude that they underline the need for a flexible working life. Stimulating self-employment among older people may be an effective way to improve their life satisfaction, to increase Sweden’s labour supply and to keep older people in the labour force.
Keywords: self-employment, ageing, life satisfaction, job satisfaction
The paper is part of the project “Entrepreneurship after retirement – a way to enhance life satisfaction?” funded by the Kamprad Family Foundation for Entrepreneurship, Research and Charity. The authors appreciate the financial support. The authors are also grateful for comments from participants at the workshop “Active ageing: French and Swedish experiences” in Paris 2017.
1. Introduction
Most countries have reported an ageing population in the last decades, a trend that is expected to continue. In Europe, the share of the population who are 60 years of age or older is expected to increase by almost 25 percent from 2015 to 2030. The expected increase in this share in North America is even higher, at around 40 percent.1
Population ageing is often associated with different economic problems, such as labour shortages and exhaustion of the social security system. Due to these problems, policymakers and researchers tend to view elderly people as an economic burden and have invested much effort in motivating them either to remain in the labour force or to come out of retirement. A crucial question is how to enable seniors to remain in the labour force without compromising their well-being and life satisfaction. Most research on labour market attachment among seniors focuses on changes in the retirement age and the creation of incentives and possibilities for seniors to remain in wage-employment after that age.2 However, creating incentives for seniors to remain in the labour force is not unproblematic given the pervasiveness of age discrimination in the workplace.3 Furthermore, health limitations and the need for flexible working hours can make it difficult for seniors to remain in the labour force. Therefore, forcing seniors to work after the age at which they had hoped to retire may reduce their life satisfaction.
One way for seniors to stay active and to remain in the labour force after voluntary retirement is for them to become self-employed. Self-employed seniors can increase Sweden’s labour supply, decrease the burden on the social security system and contribute to economic growth. Furthermore, self-employment can help older people to avoid boredom. In addition, it can offer autonomy and flexibility, thereby enhancing seniors’ life satisfaction.4
However, while previous research indicates that being self-employed increases life satisfaction, very little is known about life satisfaction among self-employed seniors.5 Therefore, it is worthwhile to study this topic and to compare subjective life satisfaction among the elderly self-employed with that of the elderly who are wage-employed or inactive (i.e., out of the labour force). If self-employed seniors are more satisfied with their lives than are seniors who are wage-employed, or inactive, after reaching the retirement age, an effective way to enhance senior life satisfaction may be to promote self-employment.
This paper focuses on life satisfaction among self-employed seniors in Sweden. The paper compares life satisfaction among the elderly who are self-employed, wage-employed or inactive in Sweden with the help of a unique survey. Sweden is interesting because its elderly population, as those in other countries, has increased during the last decade. Finding a way to motivate elderly individuals to remain in the labour force is now high on Sweden’s political agenda in.6
1 See the United Nations (2015).
2 See e.g., Shirle (2008), Poterba, Venti and Wise (2013) and Anxo, Ericson and Herbert (2017).
3 Age discrimination in has been documented by e.g. Lahey (2008) Riach and Rich (2010) Ahmed, Andersson
and Hammarstedt (2012), Neumark, Burn and Putton (2016), Carlsson and Eriksson (2017), and Drydakis, MacDonald, Chiotis and Sommers (2017).
4 For a study of retirement and psychological well-being, see e.g. Charles (2004).
5 For studies of self-employment and job and life satisfaction, see e.g., Oswald (1997), Blanchflower and Oswald
(1998), Blanchflower (2000), Benz and Frey (2004), Taylor (2004), and Andersson Joona (2008).
To obtain data about seniors’ life and job satisfaction, between March 31 and May 24, 2016 we conducted a survey between. We define seniors as individuals aged 61 and older. The rationale for using this age restriction is that 61 is the initial eligibility age for age pension in Sweden. The survey was sent to a random sample of individuals aged 61 years and older and resident in Sweden in 2016. Since we are interested in whether seniors who are self-employed are more satisfied with their lives than seniors who are wage-employed or inactive, the sample was stratified along these lines. The respondents were asked about their life satisfaction, health, leisure activities, if their parents were still alive, and if they had children and grandchildren. The self-employed and wage-employed were asked if they were satisfied with their job, if the job was mentally straining, and if the job was stressful. The self-employed were also asked about their reasons for becoming self-employed and the extent to which they had experienced any problems in running the firm. We combine the survey data with high-quality register data from the LISA database at Statistics Sweden. From this database we collect information about individual characteristics, such as age, educational attainment, civil status and region of residence, for the year 2014.
The remainder of the paper is organised as follows. In Section 2 we explain why we can expect self-employment to enhance life satisfaction among seniors. The survey and the data used are described in Section 3; descriptive statistics are presented in Section 4. Section 5 contains the estimations of factors affecting life satisfaction among our respondents. Section 6 offers a discussion and the conclusions.
2. Why should we expect self-employment to enhance life satisfaction among seniors?
Psychologists have for a long time paid attention to the relationship between retirement and life satisfaction. The main argument for why retirement should diminish life satisfaction is that retirement marks the end of working life and that retirees will suffer psychologically from boredom and from not being able to be part of and contribute to the economic activity of their society.7 However, retirement may also improve life satisfaction positively since retired people are spared what they disliked about working and have time to enjoy other activities.8 Thus, there are incentives as well as disincentives for seniors to become involved in the labour force after retirement. However, even if many seniors would still prefer to work for financial reasons or to avoid boredom, most seniors will not, for different reasons, be able to remain wage-employed after reaching retirement age. Different factors, such as the rules in the pension system (not being eligible for wage-employment), age discrimination, an unpleasant working environment, health limitations as well as personal desire for leisure and flexibility all contribute to why seniors not are eligible or motivated to remain wage-employed after retirement.
One possibility for seniors who wants to remain in the labour force after reaching the retirement age is to become self-employed. How can we then expect self-employment to affect life satisfaction among seniors? Firstly, self-employment could offer gratification, motivation and possibilities for seniors to stay in the labour force. Previous research has shown that self-employment increases both job satisfaction and life satisfaction.9 In general,
7 See Miller (1965), Henry (1971). 8 See Atchley (1971, 1993).
9 See Blanchflower and Oswald (1998), Blanchflower (2004), Benz and Frey (2004), Taylor (2004) and
self-employment offers more flexibility, control and freedom than wage-employment. Over the past decades, overall health has improved and life expectancy has increased. Better health and longer life make it possible for seniors to participate in self-employment, increasing their life satisfaction and reducing their boredom after retirement.
Self-employment may also be a necessity for seniors who want to remain in the labour force since employers may be reluctant to hire seniors. One reason may be that employers are concerned about the higher labour cost and lower productivity associated with older workers. Higher labour cost for seniors may be due the expectation of high wages based on their years of experience, higher level of absenteeism and higher health insurance costs. Some employers assume that older workers have not updated their skills, so they are thought to be less efficient and to have less capacity to learn than younger workers. Self-employment thus offers an attractive opportunity for seniors who want to remain in the labour force.
Another reason can be found in the financial situation after retirement. The inability to afford retirement due to insufficient income from the pension system may render participation in the labour force necessary for seniors even as public pension age limits seniors’ opportunities for wage-employment. Self-employment makes it possible for seniors with inadequate pensions to participate in the labour force, and thereby to improve their living standards and life satisfaction.
In addition, older people might prefer more flexible schedules. For seniors who need to work after retirement but whose failing health, or a family member’s, requires fewer work hours than the wage-employment can accommodate, self-employment is an option. Seniors who have enough income to retire but still want to work may want time for leisure. Self-employment is an attractive option for these seniors.
Thus, there are different reasons that make self-employment more appealing than wage-employment or inactivity among seniors. Our study will give insights into association between self-employment and life satisfaction among seniors in Sweden.
3. The survey
We collected data on seniors’ life satisfaction from a survey administered in cooperation with Statistics Sweden between March 31 and May 24, 2016. We define seniors as people 61 years and older. We use this age restriction since 61 is the age at which individuals in Sweden are eligible for age pension. The population for the survey thus comprised all individuals, aged 61 and older, resident in Sweden in 2016. Since we are interested in the extent to which life satisfaction differs among the self-employed, wage-employed and the inactive, a stratified random sample was drawn, based on whether the respondent was self-employed, wage-employed or inactive. The information of their labour market activity is obtained from the year 2014; at the time of the survey this was the most recent data available at Statistics Sweden. Individuals were considered self-employed if they declared that they were running a private firm or limited liability any time during 2014 (stratum 1). They were defined as wage-employed if they had any income from wage-employment in 2014 but were not classified as self-employed (stratum 2). Finally, individuals were classified as inactive if they did not have an income from work in 2014 and were not classified as wage-employed or self-employed (stratum 3). The definition of self-employed implies that people who were both self-employed and wage-employed were classified as self-employed. Ten thousand individuals were drawn in stratum 1 and 2,500 in strata 2 and 3.
In the survey, respondents were asked about their life satisfaction, health, leisure activities, if their parents were still alive, and if they had children and/or grandchildren.10 The self-employed and wage-self-employed were asked if they were satisfied with their job, if the job was mentally straining, and if the job was stressful. The self-employed asked additional questions about their reasons for becoming self-employed and the extent to which they had experienced certain problems in running the firm, such as difficulties in accessing financial capital or labour.
For all strata, the response rate was high: about 72 per cent for the self-employed, 75 per cent for the wage-employed, and 66 per cent for the inactive. A comparison of respondents and non-respondents of the survey by sex, age, civil status, education, earnings, region of residence, and citizenship does not reveal any large or striking differences between respondents and non-respondents.11 After restricting the sample to individuals with no missing values or ambiguous answers to the survey questions, the sample comprises 9,965 individuals of whom 6,698 are self-employed, 1,789 wage-employed, and 1,478 inactive. We combine the survey data with high-quality register data from the LISA database at Statistics Sweden. LISA contains information about demographic characteristics, educational attainment, employment, and labour and non-labour income for all individuals, aged 16 and older, resident in Sweden. From this database we collect information about individual characteristics such as age, educational attainment, civil status, region of residence, country of birth, disposable income (equalized), and labour earnings for the year 2014.
In our analysis we use three samples. The first sample consists of individuals who are classified as self-employed, wage-employed or inactive based on the definitions used for dividing the underlying population into the three strata. This sample comprises the 9,965 individuals mentioned above. We use this sample to ascertain if there are differences in self-reported life satisfaction among the self-employed, wage-employed and the inactive. In the survey, the respondents were asked whether they feel that their life is a source of personal satisfaction. The respondents had three possible answers: 1) most of the time, 2) sometimes, and 3) never. Individuals are considered satisfied with their lives if they answered that they often perceive their daily life as a source of personal satisfaction.
The second sample consists of individuals who defined themselves in the survey as either wage-employed, self-employed or inactive. In the survey, the respondents were asked whether they were wage-employed, self-employed or inactive. When using this definition, the sample comprises 9,606 individuals of whom 3,483 are self-employed, 1,463 are wage-employed, and 4,660 are inactive. Clearly, the two samples do not completely match and, in particular, the definition presented above produces more self-employed individuals and fewer inactive individuals. One reason may be that the strata are based on data from 2014 although the survey was conducted in 2016, suggesting that individuals may have changed their status in the interim. However, it may also be the case that even though some individuals are self-employed according our definition they may perceive themselves as inactive, meaning retired. In order to explore whether these results are sensitive to the definition, this second sample is used to explore if there are differences in life satisfaction among the different groups.
10 See Appendix A for a presentation of the survey questions.
The respondents who reported being either self-employed or wage-employed were asked about their job. In total, 4,767 individuals, of whom 3,346 are self-employed and 1,421 are wage-employed, gave complete and non-ambiguous answers to these questions. This third sample is used to identify differences in job satisfaction between the self-employed and wage-employed, and the extent to which they perceive their job as mentally straining and stressful. In the survey, the self- and wage-employed were asked if they were satisfied with their job and to rank their level of satisfaction on a five-point scale from very satisfied to very dissatisfied. Individuals were defined as being satisfied with their job if they answered that they were very satisfied with their job. The self- and wage-employed were also asked if their job was mentally straining and stressful. They were defined as perceiving their job as mentally straining or stressful if they answered these questions in the affirmative. Finally, this sample is used to study seniors’ reasons for entering self-employment and the extent to which the self-employed have had problems with access to financial capital, laws and regulations, payroll taxes, discrimination by customers, suppliers and banks or other problems in running their business.
4. Descriptive statistics
Table 1 presents descriptive statistics for the survey respondents. There are small age differences between the self-employed and the wage-employed; the inactive are older. There are also small differences between the wage-employed and the self-employed in terms of education; among the inactive, the percentage of individuals with primary education is higher and the percentage with university education is lower.
If we turn to outcomes that measure life satisfaction and health we find that among males 78 per cent of the self-employed report high life satisfaction, meaning that they often perceive their life as a source of personal satisfaction. Among wage-employed males, the corresponding figure is 74 per cent. Among inactive males, the share reporting high life satisfaction is 66 per cent. Among females, the share reporting high life satisfaction is 80 per cent among the self-employed. Among wage-employed females, the share reporting high life satisfaction is 78 per cent. Among inactive females, 65 per cent report high life satisfaction. For all groups, regardless of gender, very few responded that they never perceive that their life is a source of personal satisfaction. The highest share, 6 per cent, is found among the inactive.
Table 1 further reveals that self-employed individuals have a higher disposable income than the wage-employed. Unsurprisingly, inactive individuals have a considerably lower income than those who are self-employed and wage-employed. This is true for both males and females. Males, however, have a higher disposable income than females, irrespective of labour market status.
Turning to health, 80 per cent of self- and wage-employed males report good health; the corresponding figure among the inactive is 69 per cent. The same pattern emerges among females; 83 per cent of the self-employed and wage-employed females reports good health and 67 per cent of the inactive females report good health. The same tendency emerges when we look at other health-related outcomes. The share that report fatigue, sleeping problems, anxiety or depression is higher among the inactive than among the self- or wage-employed.
Table 1: Descriptive statistics
Males Females
Self-employed employed Wage- Inactive employed Self- employed Wage- Inactive Weighted sample share 0.161 0.280 0.559 0.072 0.288 0.640
Life satisfaction Often 0.78 0.74 0.66 0.80 0.78 0.65 Sometimes 0.20 0.23 0.27 0.17 0.20 0.28 Never 0.02 0.03 0.06 0.03 0.02 0.06 Demographic characteristics Age 69.8 67.0 75.8 69.3 66.3 76.2 Aged 67 or older 0.66 0.46 0.94 0.63 0.41 0.92 Primary education 0.25 0.23 0.32 0.17 0.14 0.33 Secondary education 0.39 0.42 0.42 0.39 0.45 0.44 University education 0.36 0.36 0.26 0.44 0.41 0.23 Married 0.70 0.65 0.66 0.62 0.58 0.49 Foreign born 0.06 0.09 0.11 0.07 0.11 0.11 Metropolitan area 0.28 0.34 0.36 0.32 0.36 0.31 Disposable income (SEK, equalised) 358,700 323,100 234,700 281,500 253,100 174,300 Health
Good general health 0.80 0.80 0.69 0.83 0.83 0.67 Fatigue 0.53 0.54 0.58 0.58 0.63 0.65 Sleeping problems 0.45 0.45 0.47 0.60 0.64 0.65 Anxiety 0.30 0.30 0.33 0.44 0.43 0.48 Depression 0.13 0.14 0.20 0.18 0.17 0.26 Spend time on hobbies 0.75 0.76 0.64 0.78 0.77 0.62 Parent alive 0.16 0.22 0.06 0.17 0.22 0.04 Grandchild 0.74 0.68 0.79 0.80 0.78 0.84 Observations 4,478 837 653 2,220 952 825
Table 2 presents job characteristics of self- and wage-employed respondents. Most of the respondents report job satisfaction. However, the self-employed are more satisfied with their jobs than the wage-employed. Among males 49 per cent of the self-employed are very satisfied with their jobs; the corresponding figure among wage-employed males is 41 per cent. Among females, 58 per cent of the self-employed are very satisfied with their jobs. The share of wage-employed females who are very satisfied with their jobs is 44 per cent.
Table 2: Descriptive statistics of job characteristics of the self-employed and wage-employed, by gender and type of employment
Males Females Self-
employed employed Wage- employed Self- employed Wage- Job satisfaction
Very satisfied 0.49 0.41 0.58 0.44 Satisfied 0.41 0.41 0.31 0.42 Neither satisfied nor dissatisfied 0.08 0.12 0.10 0.11 Dissatisfied 0.01 0.03 0.01 0.02 Very dissatisfied 0.01 0.02 0.00 0.01 Job mentally straining 0.23 0.35 0.27 0.44 Job stressful 0.28 0.45 0.30 0.61 Demographic characteristics Age 69.3 64.8 68.1 64.2 Aged 67 or older 0.63 0.23 0.54 0.18 Primary 0.21 0.19 0.11 0.11 Secondary 0.41 0.42 0.37 0.42 University 0.38 0.39 0.52 0.47 Married 0.69 0.62 0.60 0.58 Foreign born 0.06 0.12 0.08 0.10 Metropolitan area 0.36 0.37 0.41 0.40 Job characteristics Working hoursa) 29.5 33.8 24.7 31.4 Combiner 0.12 0.01 0.16 0.00 Labour income (SEK)b) 130,200 374,100 120,800 293,300
Observations 2,515 688 831 733
Note: a) Working hours is the sum of working hours in self-employment and wage-employment. b) Self-employed
individuals can have negative earnings from self-employment.
Wage-employed individuals find their job more mentally straining or stressful than the self-employed. Among males, 35 per cent of the wage-employed individuals report that their job is mentally straining while the corresponding share among self-employed males is 23 per cent. Among wage-employed females, 44 per cent find their job mentally straining while the corresponding figure among self-employed females is 27 per cent.
Among wage-employed males, 45 per cent find their job stressful but only 28 per cent of self-employed males do. Among females, the share of wage-self-employed that reported a stressful job was 61 per cent but the same share among self-employed females was only 30 per cent.
Table 2 also shows that the self-employed work fewer hours than the wage-employed. This might be because we are studying the elderly, and that the self-employed are freer to choose
how much time to spend on work than the wage-employed. The self-employed also have lower labour earnings, which could be due to fewer working hours but also to the fact that earnings from self-employment can take on negative values (e.g. if a firm incurs a loss). Table 3 displays the distribution across business lines.12 Among males, a large share of the self-employed was active in agriculture or in the law, business and technology sectors. Among females, the largest share of self-employed was active in the law, business and technology sector or in health care and the social services.
Table 3: Distribution across business lines of self-employed and wage-employed individuals
Males Females
Self-employed Wage-employed Self-employed Wage-employed Agriculture, forestry, fishing 0.16 0.03 0.06 0.00 Manufacturing 0.07 0.16 0.03 0.04 Construction 0.10 0.08 0.02 0.01 Trade 0.09 0.07 0.09 0.06 Information and communication 0.03 0.02 0.02 0.02 Transport and warehousing 0.04 0.10 0.01 0.01 Finance, insurance, business services 0.07 0.11 0.04 0.05 Law, business, and technology 0.16 0.05 0.19 0.04 Education 0.02 0.08 0.07 0.21 Health care and social services 0.03 0.10 0.14 0.38 Art, entertainment, and recreation 0.03 0.04 0.05 0.03 Services 0.03 0.05 0.08 0.02 Other 0.17 0.11 0.19 0.13 Observations 2,515 688 831 733
Table 4 shows the self-reported reasons for entering self-employment among self-employed individuals. Among males, 60 per cent are employed since they consider self-employment as a hobby. The corresponding share among females is 46 per cent.
Furthermore, a large share of the self-employed individuals entered self-employment because they could not afford to retire. Among females, 18 per cent are self-employed for economic reasons; the corresponding share among males is 14 per cent. Among males, 6 per cent were self-employed since it gave them an opportunity to fulfil their ideas. The share of females that was self-employed to be able to fulfil ideas was 7 per cent.
12 The sample of self-employed comprises a relatively high share of individuals active in agriculture, forestry,
and fishing. Typically, farmers are excluded from studies of self-employment. As a sensitivity check, we have estimated all regressions for life and job satisfaction. The results, available upon request, are in all essentials unchanged.
Table 4: Reasons for entering self-employment among the self-employed, by gender
Males Females Difficulties in getting permanent employment 0 0 Higher expected income as self-employed 0.01 0 Flexible working hours 0.03 0.02 Was dismissed 0.01 0 To fulfil my ideas 0.06 0.07 Inability to afford retirement 0.14 0.18 Self-employment is hobby 0.60 0.46
Other 0.15 0.23
Observations 2,503 821
Table 5 shows the problems experienced by the self-employed. Among males, 11 per cent of the self-employed consider laws and regulations as a problem in their self-employment activities. The same share among females was 8 per cent. In terms of payroll taxes, 12 per cent of the males and 11 per cent of the females consider them as a problem.
Among self-employed males, 9 per cent report having experienced discrimination by customers, suppliers and banks. 5 per cent of the females report having experienced such discrimination.
Table 5: Problems experienced by the self-employed, by gender and age
Males Females Access to financial capital 0.03 0.07 Laws and regulations 0.11 0.08 Payroll taxes 0.12 0.11 Perceived discrimination by customers,
suppliers and banks 0.09 0.05
Other 0.05 0.04
Observations 2,427 798
5. Estimations – self-employment, life and job satisfaction
5.1 Estimation strategy
To explore the extent to which there are differences in life satisfaction between self-employed, wage-employed and inactive seniors we estimate a linear probability model. The outcome variable takes the value of 1 if the respondent in the survey has answered that the daily life is a source of personal satisfaction most of the time and 0 otherwise. We use the following regression model that is estimated separately by gender:
Pr (𝑌𝑌& = 1) = 𝛼𝛼++ 𝛼𝛼- 𝑆𝑆𝑆𝑆𝑆𝑆𝑆𝑆_𝑆𝑆𝑒𝑒𝑒𝑒𝑆𝑆𝑒𝑒𝑒𝑒𝑆𝑆𝑒𝑒𝑒𝑒𝑒𝑒𝑒𝑒𝑆𝑆 61_66 &+ 𝛼𝛼< 𝑊𝑊𝑊𝑊𝑒𝑒𝑆𝑆_𝑆𝑆𝑒𝑒𝑒𝑒𝑆𝑆𝑒𝑒𝑒𝑒𝑆𝑆𝑒𝑒𝑒𝑒𝑒𝑒𝑒𝑒𝑆𝑆 61_66 &+
𝛼𝛼? 𝑆𝑆𝑆𝑆𝑆𝑆𝑆𝑆_𝑆𝑆𝑒𝑒𝑒𝑒𝑆𝑆𝑒𝑒𝑒𝑒𝑆𝑆𝑒𝑒𝑒𝑒𝑒𝑒𝑒𝑒𝑆𝑆 ≥ 67 &+ 𝛼𝛼B 𝑊𝑊𝑊𝑊𝑒𝑒𝑆𝑆_𝑆𝑆𝑒𝑒𝑒𝑒𝑆𝑆𝑒𝑒𝑒𝑒𝑆𝑆𝑒𝑒𝑒𝑒𝑒𝑒𝑒𝑒𝑆𝑆 ≥ 67 &+ 𝛼𝛼C 𝑒𝑒𝑒𝑒𝑆𝑆 ≥ 67 &+ 𝛽𝛽𝑋𝑋&+
𝜀𝜀& (1)
Inactive individuals aged 61-66 constitute the reference group. 𝛼𝛼- is the percentage point
difference in life satisfaction between the self-employed and inactive aged 61–66, 𝛼𝛼< the
difference between wage-employed and inactive individuals aged 61–66, 𝛼𝛼? the difference
between self-employed and inactive individuals aged 67 or older, 𝛼𝛼B the difference between
self-employed and inactive individuals aged 67 or older, and 𝛼𝛼C is the difference between
inactive individuals aged 67 or older and inactive individuals aged 61–66. Using this specification, we can compare differences in life satisfaction among the self-employed, wage-employed, and the inactive within and across age groups. It also allows us to compare differences in outcomes between individuals aged 61–66 and 67 or older within the group of self-employed, wage-employed and inactive. We formally test whether differences across and within groups are statistically significant.
Seven specifications of the model are estimated. All explanatory variables included in vector 𝑋𝑋& are presented in Table B1 in Appendix B. Specification 1 shows the unconditional
differences between the different groups of seniors explained above. In Specification 2 we add the following controls for demographic characteristics: age, educational attainment, marital status, whether the individual is foreign born or not, and whether the individual resides in a metropolitan area or not. Specification 3 adds a control for equalised gross disposable income13. Since this variable can take on negative values and be zero it is entered as a numerical variable. Specification 4 includes all controls used in Specification 3 and adds an indicator if the individual has good perceived general health. Specification 5 adds controls for whether the individual has experienced fatigue, sleeping problems, anxiety or depression. In Specification 6 we add a control for whether the individual spends time on hobbies. Finally, Specification 7 adds controls for whether the individual has a living parent and if the individual has grandchildren or not.
We use a similar model to identify differences between the self-employed and wage-employed seniors in job satisfaction and the extent to which seniors view their job as perceived as mentally straining or stressful. We estimate the following linear probability model, again estimated separately by gender:
Pr (𝑌𝑌& = 1) = 𝛼𝛼++ 𝛼𝛼- 𝑆𝑆𝑆𝑆𝑆𝑆𝑆𝑆_𝑆𝑆𝑒𝑒𝑒𝑒𝑆𝑆𝑒𝑒𝑒𝑒𝑆𝑆𝑒𝑒𝑒𝑒𝑒𝑒𝑒𝑒𝑆𝑆 61_66 &+ 𝛼𝛼< 𝑆𝑆𝑆𝑆𝑆𝑆𝑆𝑆_𝑆𝑆𝑒𝑒𝑒𝑒𝑆𝑆𝑒𝑒𝑒𝑒𝑆𝑆𝑒𝑒𝑒𝑒𝑒𝑒𝑒𝑒𝑆𝑆 ≥ 67 &+
𝛼𝛼? 𝑒𝑒𝑒𝑒𝑆𝑆 ≥ 67 &+ 𝛽𝛽𝑋𝑋&+ 𝜀𝜀& (2)
When we explore if there are differences in job satisfaction between the self-employed and wage-employed, the dependent variable is set at 1 if the individual answered that he/she is very satisfied with the job and 0 otherwise.14 Here, wage-employed individuals aged 61–66 are the reference group. 𝛼𝛼- is then the percentage point difference in the outcome variable
between the self-employed and wage-employed aged 61–66, 𝛼𝛼< the difference between the
13 Disposable income has been equalised using the following forumula: annual houshold disposable income /
(1*(number of adults)+0,42*(number of children aged 0–3)+0,52*(number children aged 4–10)).
14 An alternative would be estimate an OLS and treat the dependent variable as cardinal, see e.g. Luttmer (2005)
and Zwan, Hessels and Rietveld (2015) for previous applications of this model in the happiness literature. However, due to the skewed distribution of this variable – with the majority answering that they were either very satisfied or satisfied with the job – we decided treat the dependent variable as categorical. However, using a cardinal variable yields similar results (that are available upon request).
self-employed and wage-employed aged 67 or older, and 𝛼𝛼? is the difference between
wage-employed individuals aged 67 or older and wage-wage-employed individuals aged 61-66. As above, this specification allows us to compare differences in outcomes between the wage-employed and self-employed within and across age groups. We can also compare differences in outcomes between individuals aged 61-66 and 67 or older within the groups of the self-employed and wage-self-employed individuals.
For job satisfaction, the outcome variable takes the value 1 if the individuals has answered that he/she is very satisfied with the job and 0 otherwise. As regards whether the job is mentally straining or stressful the outcome variable takes the value 1 if the respondent has answered that his/her job is mentally straining and stressful, respectively, and 0 otherwise. We estimate five specifications. Specification 1 shows the unconditional differences between the different groups of self-employed and wage-employed seniors. Specification 2 adds controls for age, educational attainment, marital status, whether the individual is foreign born, and whether the individual resides in a metropolitan area. Specifications 3 to 5 add controls for different job characteristics. In Specification 3 controls for individual working hours and an indicator for if the individual is a combiner, meaning that both wage-employed and self-employed, are added. In Specification 4 we add a control for the individual’s labour income and in Specification 5 we also add industry fixed effects.
5.2 Differences in life satisfaction – individuals grouped according to the three strata
The estimation results for males are presented in Table 6. Column 1 reports the unconditional estimates (Specification 1) and shows that self-employed individuals aged 61–66 have almost a 30 percentage point higher probability of reporting high life satisfaction than do inactive individuals in the same age cohort. If we compare self-employed individuals in the aged 61– 66 with wage-employed individuals in the same ages, the difference amounts to about 7 percentage points (0.296–0.225). The F-test reveals that this differential is statistically significant at the 1 per cent level.
A comparison between self-employed individuals aged 61–66 and self-employed individuals aged 67 or older shows that older individuals have a somewhat higher propensity of reporting high life satisfaction. This difference amounts to 2.5 percentage points (0.296– (0.106+0.215)) and is statistically significant at the 10 per cent level. Furthermore, self-employed individuals who are 67 years of age or older have almost 11 percentage points higher probability of reporting high life satisfaction than inactive individuals in the same age group. Self-employed individuals aged 67 years or older has 1.9 percentage points (0.106– 0.125) lower probability of reporting high life satisfaction than wage-employed individuals in the same age group. This difference is not statistically significant.
Table 6: LPM estimates of the probability of being satisfied with life among males (standard errors within parentheses) (1) (2) (3) (4) (5) (6) (7) Self-employed x Age 61–66 0.296*** (0.079) 0.275 *** (0.077) 0.269 *** (0.076) 0.120 * (0.068) (0.063) 0.083 (0.063) 0.092 (0.063) 0.092 Wage-employed x Age 61–66 0.225*** (0.081) 0.211 *** (0.079) 0.208 *** (0.078) (0.070) 0.070 (0.065) 0.041 (0.065) 0.052 (0.065) 0.052 Self-employed x Age ≥ 67 0.106*** (0.020) 0.097 *** (0.021) 0.087 *** (0.021) 0.053 *** (0.018) 0.050 *** (0.018) 0.044 ** (0.018) 0.045 ** (0.018) Wage-employed x Age ≥ 67 0.125*** (0.028) 0.115 *** (0.028) 0.110 *** (0.028) 0.058 ** (0.026) 0.043 * (0.025) (0.025) 0.032 (0.025) 0.033 Age ≥ 67 0.215*** (0.080) 0.203 *** (0.078) 0.208 *** (0.078) (0.069) 0.104 (0.064) 0.062 (0.064) 0.077 (0.066) 0.073 Secondary 0.024 (0.028) (0.028) 0.021 (0.025) 0.026 (0.024) 0.031 (0.024) 0.016 (0.024) 0.016 University 0.063** (0.030) 0.055 * (0.030) (0.026) 0.033 (0.025) 0.033 (0.026) 0.012 (0.026) 0.012 Married 0.069*** (0.024) 0.067 *** (0.024) 0.039 * (0.021) (0.020) 0.023 (0.020) 0.019 (0.020) 0.021 Foreign born -0.098** (0.040) -0.094 ** (0.040) -0.071 * (0.037) (0.035) -0.048 (0.034) -0.043 (0.034) -0.044 Metropolitan area 0.038 (0.024) (0.024) 0.032 (0.021) 0.015 (0.020) 0.021 (0.020) 0.019 (0.020) 0.019 Disposable income / 10,000 (equalised) 0.001 *** (0.000) 0.000 ** (0.000) 0.000 * (0.000) (0.000) 0.000 (0.000) 0.000 Good general health 0.452***
(0.026) 0.347 *** (0.029) 0.320 *** (0.030) 0.321 *** (0.030) Fatigue -0.076*** (0.022) -0.066 *** (0.022) -0.067 *** (0.022) Sleeping problems -0.005 (0.022) (0.022) -0.005 (0.022) -0.005 Anxiety -0.121*** (0.027) -0.126 *** (0.027) -0.125 *** (0.027) Depression -0.153*** (0.035) -0.145 *** (0.035) -0.146 *** (0.035) Spend time on hobbies 0.122***
(0.024) 0.123 *** (0.024) Parent alive -0.020 (0.029) Grandchild -0.008 (0.022) Constant 0.463*** (0.078) 0.400 *** (0.080) 0.380 *** (0.080) 0.204 *** (0.072) 0.437 *** (0.071) 0.374 *** (0.072) 0.384 *** (0.073) Prob > F: (Self-employed x Age 61–66) = (Wage-employed x Age 61–66) 0.004 0.008 0.011 0.026 0.050 0.058 0.059 Prob > F: (Self-employed x Age ≥ 67) = (Wage-employed x Age ≥ 67) 0.384 0.411 0.293 0.800 0.703 0.539 0.546 Prob > F: (Self-employed x Age 61–66) = (Age ≥ 67 + Self-employed x Age ≥ 67) 0.063 0.057 0.052 0.003 0.013 0.012 0.071 Prob > F: (Wage-employed x Age 61–66) = (Age ≥ 67 + Wage-employed x Age ≥ 67) 0.000 0.000 0.000 0.001 0.019 0.033 0.057 Observations 5,968 5,968 5,968 5,968 5,968 5,968 5,968 R2 0.022 0.036 0.038 0.219 0.275 0.288 0.289
Note: The results are weighted and adjusted for the sampling design using Stata svy commands. * p < 0.10, ** p < 0.05, *** p < 0.01
The estimates remain stable when we add controls for demographic characteristics, such as educational attainment, marital status and for whether the individual is foreign born or not. This is also the case when we control for disposable income. Thus, such variables have little impact on the observed differentials in life satisfaction between self-employed, wage-employed and inactive individuals.
The results change, however, when health-related variables are included in Specifications 4 and 5. Turning to Specification 7, in which the full set of controls are included, we find that general health have a strong positive impact on life satisfaction. Furthermore, other health related variables, such as fatigue, sleeping problems, anxiety and depression, all have a negative impact on life satisfaction. In particular, adding health-related controls reduces the observed differentials between males who are active – wage-employed or self-employed – and inactive on the labour market.
The difference across age groups observed among the self-employed, with older males reporting a higher life satisfaction than the younger males, also remains unchanged at 2.6 percentage points (0.092–(0.045+0.073)). This differential is statistically significant at the 10 per cent level. Finally, self-employed individuals aged 67 years or older now have 4.5 percentage point higher probability of reporting high life satisfaction than do inactive individuals of the same age. Finally, it is worth noting that spending time on hobbies improves life satisfaction for males, but having a grandchild or a living parent has no impact on life satisfaction.
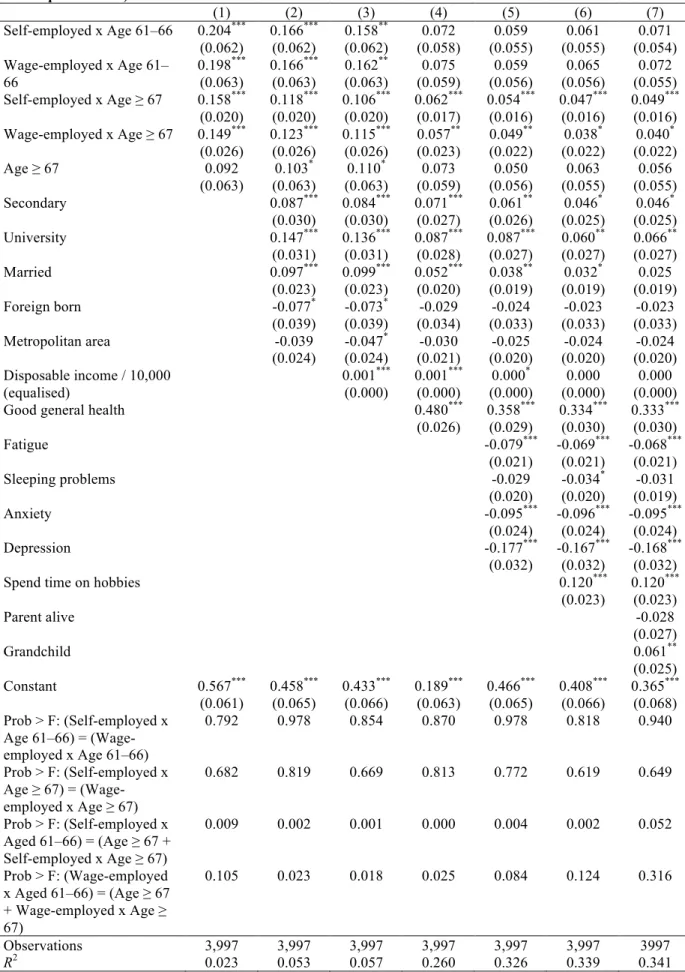
Table 7 reports the corresponding estimates for females. The unconditional estimates in the first column show that self-employed females aged 61–66 have a slightly more than 20 percentage point higher probability of reporting high life satisfaction than do inactive females in the same age group. Among females aged 67 or older, the corresponding difference amounts to almost 16 percentage points. A comparison between self-employed females aged 61–66 and 67 or older shows that females in the older group have a 4.6 percentage point (0.204–(0.158+0.092)) higher probability of reporting high life satisfaction than do females in the younger group. This differential is statistically significant at the 1 per cent level.
As for males, the magnitude of the coefficients remains fairly stable when we add demographic controls and disposable income, indicating that differences in these characteristics across groups have little impact on differential in life satisfaction among self-employed, wage-employed and inactive individuals.
However, with the full set of health-related controls in column 7, the difference in the propensity of reporting high life satisfaction between self-employed and inactive females aged 61–66 decreases and ceases to be statistically significant. However, self-employed females who are 67 years or older still have a higher probability of reporting high life satisfaction than do inactive females in the same age group, although the difference –roughly 5 percentage points – is somewhat smaller. Further, self-employed females who are 67 years of age or older have 3.4 percentage points (7.1–(4.9+5.6)) higher probability of reporting high life satisfaction than do their self-employed counterparts aged 61–66. This differential is statistically significant at the 10 per cent level.
Table 7: LPM estimates of the probability of being satisfied with life among females (standard errors within parentheses) (1) (2) (3) (4) (5) (6) (7) Self-employed x Age 61–66 0.204*** (0.062) 0.166 *** (0.062) 0.158 ** (0.062) (0.058) 0.072 (0.055) 0.059 (0.055) 0.061 (0.054) 0.071 Wage-employed x Age 61– 66 0.198 *** (0.063) 0.166 *** (0.063) 0.162 ** (0.063) (0.059) 0.075 (0.056) 0.059 (0.056) 0.065 (0.055) 0.072 Self-employed x Age ≥ 67 0.158*** (0.020) 0.118 *** (0.020) 0.106 *** (0.020) 0.062 *** (0.017) 0.054 *** (0.016) 0.047 *** (0.016) 0.049 *** (0.016) Wage-employed x Age ≥ 67 0.149*** (0.026) 0.123 *** (0.026) 0.115 *** (0.026) 0.057 ** (0.023) 0.049 ** (0.022) 0.038 * (0.022) 0.040 * (0.022) Age ≥ 67 0.092 (0.063) 0.103 * (0.063) 0.110 * (0.063) (0.059) 0.073 (0.056) 0.050 (0.055) 0.063 (0.055) 0.056 Secondary 0.087*** (0.030) 0.084 *** (0.030) 0.071 *** (0.027) 0.061 ** (0.026) 0.046 * (0.025) 0.046 * (0.025) University 0.147*** (0.031) 0.136 *** (0.031) 0.087 *** (0.028) 0.087 *** (0.027) 0.060 ** (0.027) 0.066 ** (0.027) Married 0.097*** (0.023) 0.099 *** (0.023) 0.052 *** (0.020) 0.038 ** (0.019) 0.032 * (0.019) (0.019) 0.025 Foreign born -0.077* (0.039) -0.073 * (0.039) (0.034) -0.029 (0.033) -0.024 (0.033) -0.023 (0.033) -0.023 Metropolitan area -0.039 (0.024) -0.047 * (0.024) (0.021) -0.030 (0.020) -0.025 (0.020) -0.024 (0.020) -0.024 Disposable income / 10,000 (equalised) 0.001 *** (0.000) 0.001 *** (0.000) 0.000 * (0.000) (0.000) 0.000 (0.000) 0.000 Good general health 0.480***
(0.026) 0.358 *** (0.029) 0.334 *** (0.030) 0.333 *** (0.030) Fatigue -0.079*** (0.021) -0.069 *** (0.021) -0.068 *** (0.021) Sleeping problems -0.029 (0.020) -0.034 * (0.020) (0.019) -0.031 Anxiety -0.095*** (0.024) -0.096 *** (0.024) -0.095 *** (0.024) Depression -0.177*** (0.032) -0.167 *** (0.032) -0.168 *** (0.032) Spend time on hobbies 0.120***
(0.023) 0.120 *** (0.023) Parent alive -0.028 (0.027) Grandchild 0.061** (0.025) Constant 0.567*** (0.061) 0.458 *** (0.065) 0.433 *** (0.066) 0.189 *** (0.063) 0.466 *** (0.065) 0.408 *** (0.066) 0.365 *** (0.068) Prob > F: (Self-employed x Age 61–66) = (Wage-employed x Age 61–66) 0.792 0.978 0.854 0.870 0.978 0.818 0.940 Prob > F: (Self-employed x Age ≥ 67) = (Wage-employed x Age ≥ 67) 0.682 0.819 0.669 0.813 0.772 0.619 0.649 Prob > F: (Self-employed x Aged 61–66) = (Age ≥ 67 + Self-employed x Age ≥ 67) 0.009 0.002 0.001 0.000 0.004 0.002 0.052 Prob > F: (Wage-employed x Aged 61–66) = (Age ≥ 67 + Wage-employed x Age ≥ 67) 0.105 0.023 0.018 0.025 0.084 0.124 0.316 Observations 3,997 3,997 3,997 3,997 3,997 3,997 3997 R2 0.023 0.053 0.057 0.260 0.326 0.339 0.341
Note: The results are weighted and adjusted for the sampling design using Stata svy commands. * p < 0.10, ** p < 0.05, *** p < 0.01
Good general health has a large positive impact on the propensity of reporting high life satisfaction for females. Furthermore, other health-related variables such as fatigue, sleeping problems, anxiety and depression all have a negative impact on life satisfaction. It is also worth noting that for females, a grandchild has a positive effect on life satisfaction.
5.3 Estimations of factors affecting life satisfaction – individuals grouped by survey answer We carried out the same estimations and grouped the individuals by self-reported labour market status as wage-employed, self-employed or inactive in the survey. The results appear in Table 8 and Table 9. Specification 1 in Table 8 shows that self-employed males aged 61–66 have an almost 19 percentage point higher probability of reporting high life satisfaction than do inactive males in the same age group. When the individuals are grouped by the definition of the three, this effect amounts to almost 30 percentage points for males (Table 6). Self-employed individuals aged 67 years or older have a 14 percentage point higher probability of reporting a high life satisfaction than do inactive individuals aged 67 years of age or older. In Table 6 the corresponding differential was 11 percentage points.
Table 8 reveals that self-employed individuals aged 61–66 have a 7.5 percentage point higher probability of reporting high life satisfaction than wage-employed individuals in the same age group. This differential is statistically significant at the 5 per cent level.
When we look at the different specifications, the pattern looks the same as in Table 6. General health and health-related variables have a strong impact on life satisfaction and explain many of the differences in life satisfaction observed among self-employed, wage-employed and inactive individuals.
When the full set of controls is included in Specification 7, it emerges that self-employed males aged 61–66 have a 6.5 percentage point higher probability of reporting high life satisfaction than do inactive individuals in the same age group. The estimates in Table 6 showed no differences between these two groups. Furthermore, self-employed individuals aged 67 years or older have a 5.4 percentage point higher probability of reporting high life satisfaction than do inactive individuals in that age group. This result is in line with the result presented in Table 6.
Table 8: LPM estimates of the probability of being satisfied with life among males when group definition is based on survey answer (standard errors within parentheses)
(1) (2) (3) (4) (5) (6) (7) Self-employed aged 61–66 0.186*** (0.044) 0.172 *** (0.043) 0.164 *** (0.042) 0.071 * (0.037) (0.035) 0.054 0.065 * (0.035) 0.065 * (0.035) Wage-employed aged 61–66 0.111** (0.047) 0.103 ** (0.045) 0.102 ** (0.045) (0.040) 0.044 (0.038) 0.040 (0.038) 0.047 (0.038) 0.047 Self-employed aged 67 or older 0.141 *** (0.024) 0.128 *** (0.025) 0.116 *** (0.025) 0.061 *** (0.021) 0.057 *** (0.021) 0.053 ** (0.021) 0.054 ** (0.021) Wage-employed aged 67 or older 0.098 ** (0.048) 0.097 ** (0.049) 0.086 * (0.049) (0.050) -0.007 (0.050) -0.008 (0.049) -0.015 (0.049) -0.014 Aged 67 or older 0.109** (0.043) 0.102 ** (0.042) 0.108 *** (0.042) 0.077 ** (0.036) (0.033) 0.052 0.063 * (0.033) 0.060 * (0.034) Secondary 0.039 (0.029) (0.029) 0.036 (0.026) 0.033 (0.025) 0.038 (0.025) 0.023 (0.025) 0.023 University 0.075** (0.031) 0.067 ** (0.031) (0.027) 0.042 (0.026) 0.040 (0.027) 0.019 (0.027) 0.019 Married 0.075*** (0.024) 0.073 *** (0.024) 0.043 ** (0.022) (0.020) 0.027 (0.020) 0.023 (0.021) 0.026 Foreign born -0.109*** (0.042) -0.104 ** (0.042) -0.077 ** (0.038) (0.035) -0.055 (0.035) -0.052 (0.035) -0.052 Metropolitan area 0.035 (0.024) (0.024) 0.029 (0.021) 0.014 (0.021) 0.018 (0.020) 0.018 (0.020) 0.017 Disposable income / 10,000 (equalised) 0.001 *** (0.000) 0.001 ** (0.000) 0.000 ** (0.000) (0.000) 0.000 (0.000) 0.000 Good general health 0.445***
(0.027) 0.335 *** (0.030) 0.309 *** (0.030) 0.309 *** (0.030) Fatigue -0.086*** (0.023) -0.076 *** (0.023) -0.076 *** (0.023) Sleeping problems -0.004 (0.022) (0.022) -0.005 (0.022) -0.005 Anxiety -0.114*** (0.028) -0.118 *** (0.028) -0.118 *** (0.028) Depression -0.161*** (0.036) -0.152 *** (0.036) -0.153 *** (0.036) Spend time on hobbies 0.122***
(0.025) 0.122 *** (0.025) Parent alive -0.015 (0.030) Grandchild -0.009 (0.023) Constant 0.585*** (0.040) 0.502 *** (0.046) 0.479 *** (0.047) 0.234 *** (0.043) 0.457 *** (0.048) 0.396 *** (0.049) 0.405 *** (0.051) Prob > F: (Self-employed x Age 61–66) = (Wage-employed x Age 61–66) 0.014 0.023 0.044 0.352 0.593 0.496 0.490 Prob > F: (Self-employed x Age ≥ 67) = (Wage-employed x Age ≥ 67) 0.382 0.538 0.553 0.172 0.197 0.176 0.176 Prob > F: (Self-employed x Aged 61–66) = (Age ≥ 67 + Self-employed x Age ≥ 67) 0.370 0.369 0.336 0.812 0.939 0.772 0.771 Prob > F: (Wage-employed x Aged 61–66) = (Age ≥ 67 + Wage-employed x Age ≥ 67) 0.846 0.924 0.814 0.413 0.440 0.318 0.321 Observations 5,807 5,807 5,807 5,807 5,807 5,807 5,807 R2 0.015 0.032 0.034 0.209 0.267 0.281 0.281
Note: The results are weighted and adjusted for the sampling design using Stata svy commands. * p < 0.10, ** p < 0.05, *** p < 0.01
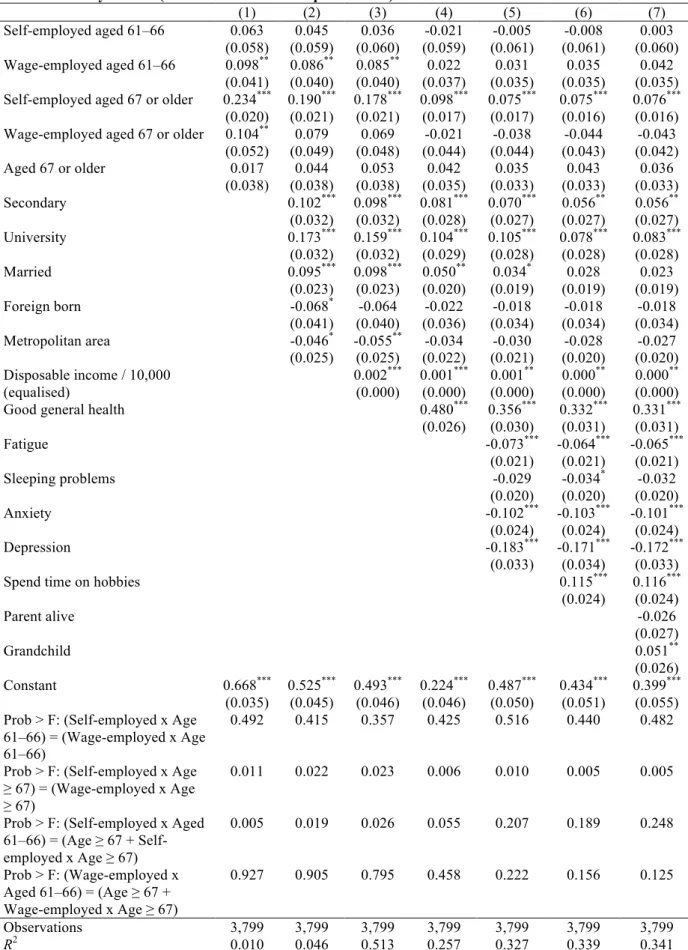
The results for females are presented in Table 9. In contrast to Table 7, there is no unconditional difference in the probability of reporting high life satisfaction between self-employed females aged 61–66 and inactive females in that age group (see column 1). Self-employed females aged 67 years of age or older have a more than 23 percentage point higher probability of being satisfied with their lives than inactive females aged 67 years or older. The corresponding differential reported in Table 7 amounted to about 16 percentage points. There is also a statistically significant differential in the probability of reporting high life satisfaction between self-employed females aged 67 years or older and self-employed females aged 61– 66. This differential amounts to almost 18 percentage points (0.063–(0.234+0.017)). Also, self-employed individuals aged 67 years or older report a 13 percentage point higher probability of reporting high life satisfaction than wage-employed individuals in the same age group (0.234–0.104). This differential is statistically significant at the 5 percent level. Just as in Table 7, adding health-related variables has a large impact on the estimates. In Specification 7, when the full set of controls is added, two differentials are still statistically significant. The first is that between self-employed individuals aged 67 years or older and inactive females of the same age, now amounting to almost 8 percentage points. The corresponding differential in Table 7 amounts to approximately 5 percentage points. The second differential is that between self-employed and wage-employed females aged 67 or older, where the self-employed have an 11.9 percentage point higher probability (7.6–(–4.3)) of reporting a high life satisfaction than the wage-employed. This differential is statistically significant at the 1 percent level.
Thus, for both males and females, self-employment at ages 67 year or older appears to be
Table 9: LPM estimates of the probability of being satisfied with life among females when group definition based on survey answer (standard errors within parentheses)
(1) (2) (3) (4) (5) (6) (7) Self-employed aged 61–66 0.063 (0.058) (0.059) 0.045 (0.060) 0.036 (0.059) -0.021 (0.061) -0.005 (0.061) -0.008 (0.060) 0.003 Wage-employed aged 61–66 0.098** (0.041) 0.086 ** (0.040) 0.085 ** (0.040) (0.037) 0.022 (0.035) 0.031 (0.035) 0.035 (0.035) 0.042 Self-employed aged 67 or older 0.234***
(0.020) 0.190 *** (0.021) 0.178 *** (0.021) 0.098 *** (0.017) 0.075 *** (0.017) 0.075 *** (0.016) 0.076 *** (0.016) Wage-employed aged 67 or older 0.104**
(0.052) (0.049) 0.079 (0.048) 0.069 (0.044) -0.021 (0.044) -0.038 (0.043) -0.044 (0.042) -0.043 Aged 67 or older 0.017 (0.038) (0.038) 0.044 (0.038) 0.053 (0.035) 0.042 (0.033) 0.035 (0.033) 0.043 (0.033) 0.036 Secondary 0.102*** (0.032) 0.098 *** (0.032) 0.081 *** (0.028) 0.070 *** (0.027) 0.056 ** (0.027) 0.056 ** (0.027) University 0.173*** (0.032) 0.159 *** (0.032) 0.104 *** (0.029) 0.105 *** (0.028) 0.078 *** (0.028) 0.083 *** (0.028) Married 0.095*** (0.023) 0.098 *** (0.023) 0.050 ** (0.020) 0.034 * (0.019) (0.019) 0.028 (0.019) 0.023 Foreign born -0.068* (0.041) (0.040) -0.064 (0.036) -0.022 (0.034) -0.018 (0.034) -0.018 (0.034) -0.018 Metropolitan area -0.046* (0.025) -0.055 ** (0.025) (0.022) -0.034 (0.021) -0.030 (0.020) -0.028 (0.020) -0.027 Disposable income / 10,000 (equalised) 0.002 *** (0.000) 0.001 *** (0.000) 0.001 ** (0.000) 0.000 ** (0.000) 0.000 ** (0.000) Good general health 0.480***
(0.026) 0.356 *** (0.030) 0.332 *** (0.031) 0.331 *** (0.031) Fatigue -0.073*** (0.021) -0.064 *** (0.021) -0.065 *** (0.021) Sleeping problems -0.029 (0.020) -0.034 * (0.020) (0.020) -0.032 Anxiety -0.102*** (0.024) -0.103 *** (0.024) -0.101 *** (0.024) Depression -0.183*** (0.033) -0.171 *** (0.034) -0.172 *** (0.033) Spend time on hobbies 0.115***
(0.024) 0.116 *** (0.024) Parent alive -0.026 (0.027) Grandchild 0.051** (0.026) Constant 0.668*** (0.035) 0.525 *** (0.045) 0.493 *** (0.046) 0.224 *** (0.046) 0.487 *** (0.050) 0.434 *** (0.051) 0.399 *** (0.055) Prob > F: (Self-employed x Age
61–66) = (Wage-employed x Age 61–66)
0.492 0.415 0.357 0.425 0.516 0.440 0.482 Prob > F: (Self-employed x Age
≥ 67) = (Wage-employed x Age ≥ 67)
0.011 0.022 0.023 0.006 0.010 0.005 0.005 Prob > F: (Self-employed x Aged
61–66) = (Age ≥ 67 + Self-employed x Age ≥ 67) 0.005 0.019 0.026 0.055 0.207 0.189 0.248 Prob > F: (Wage-employed x Aged 61–66) = (Age ≥ 67 + Wage-employed x Age ≥ 67) 0.927 0.905 0.795 0.458 0.222 0.156 0.125 Observations 3,799 3,799 3,799 3,799 3,799 3,799 3,799 R2 0.010 0.046 0.513 0.257 0.327 0.339 0.341
Note: The results are weighted and adjusted for the sampling design using Stata svy commands. * p < 0.10, ** p < 0.05, *** p < 0.01
5.4 Differences in job satisfaction, whether job is perceived as mentally straining or stressful We start by presenting results from the estimations of determinants behind job satisfaction. Tables 10 and 11 show the results for males and females, respectively. Specification 1 in Table 10 shows that self-employed males aged 61–66 have about a 12 percentage point higher probability of being satisfied with their job than wage-employed males of that age. Although the estimate for the self-employed aged 67 or older suggests that they are less satisfied with the job than are the wage-employed of the same age, the difference is not statistically significant. Among wage-employed males aged 67 or older, the probability of being satisfied with their job is almost 23 percentage points higher than it is for the wage-employed aged 61 to 66. Not surprisingly, this suggests that individuals who remain in wage employment after the retirement age 67 is a select group consisting of those who are most satisfied with their jobs. However, among the self-employed the difference across age groups is not statistically significant.
Table 10: LPM estimates of the probability of being satisfied with the job among self-employed and wage-employed males (standard errors within parentheses)
(1) (2) (3) (4) (5) Self-employed aged 61–66 0.122*** (0.034) 0.115 *** (0.034) 0.118 *** (0.035) 0.147 *** (0.035) 0.134 *** (0.036) Self-employed aged 67 or older -0.089
(0.057) (0.057) -0.087 (0.057) -0.085 (0.057) -0.054 (0.060) -0.050 Age 67 or older 0.229*** (0.058) 0.218 *** (0.058) 0.214 *** (0.060) 0.234 *** (0.059) 0.227 *** (0.059) Secondary -0.072* (0.041) -0.072 * (0.041) -0.075 * (0.041) -0.080 ** (0.040) University 0.037 (0.041) (0.041) 0.036 (0.041) 0.017 (0.043) 0.001 Married 0.034 (0.032) (0.032) 0.034 (0.032) 0.026 (0.031) 0.028 Foreign born -0.039 (0.051) (0.051) -0.039 (0.050) -0.039 (0.050) -0.047 Metropolitan area 0.013 (0.033) (0.033) 0.013 (0.033) 0.002 (0.034) -0.016 Working hours -0.000 (0.001) (0.001) -0.001 (0.001) -0.001 Combiner -0.017 (0.054) (0.054) -0.026 (0.053) -0.022 Labour income / 10,000 0.000*** (0.000) 0.000 *** (0.000) Constant 0.361*** (0.025) 0.359 *** (0.045) 0.370 *** (0.056) 0.343 *** (0.056) 0.289 *** (0.062) Business line No No No No Yes Prob > F: (Self-employed x Aged 61–66) =
(Age ≥ 67 + Self-employed x Age ≥ 67) 0.619 0.630 0.771 0.353 0.225 Observations 3,203 3,203 3,203 3,203 3,203
R2 0.027 0.039 0.039 0.049 0.067
Note: The results are weighted and adjusted for the sampling design using Stata svy commands. * p < 0.10, ** p < 0.05, *** p < 0.01
The coefficients remain stable as we add demographic controls in column 2 but also when controlling for differences in job characteristics in columns 3–5. The results in columns 4 and 5 indicate that labour earnings is positively related to job satisfaction, although the magnitude is very small. However, controlling for income does not have a large impact on how being wage- or self-employed affects job satisfaction for males. Specification 5 indicates that among males aged 61–66 self-employed individuals now have about 13 percentage point higher
probability of being satisfied with their job than wage-employed individuals. Among males aged 67 years or older there is no difference in job satisfaction between the wage- and the self-employed. Although the estimates suggests that self-employed males aged 67 or older have a higher probability of being satisfied with their job than their younger counterparts, this difference is not statistically significant.
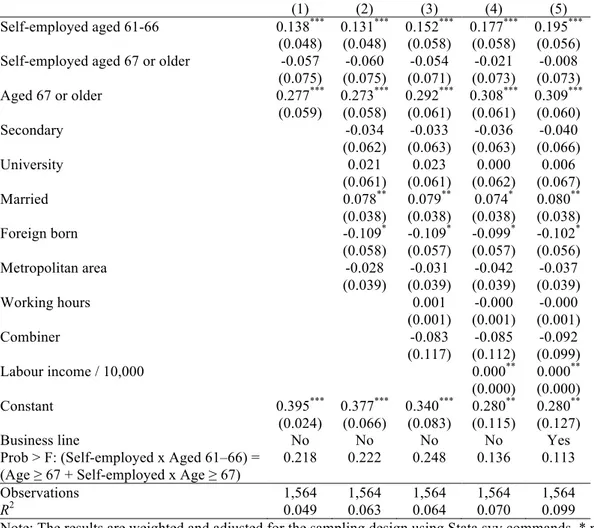
The corresponding results for females are presented in Table 11. Specification 1 shows that self-employed females aged 61–66 are more satisfied with their jobs than wage-employed females in the same age cohort, a difference of about 14 percentage points. Just as for males, there is no difference between self-employed and wage-employed females aged 67 or older. Finally, wage-employed females aged 67 or older are more satisfied with their jobs than employed females aged 61–66, again reflecting that older women who are still wage-employed on the labour market is a select group. Adding controls for demographic and job characteristics does not change the results.
Table 11: LPM estimates of the probability of being satisfied with the job among self-employed and wage-employed females (standard errors within parentheses)
(1) (2) (3) (4) (5) Self-employed aged 61-66 0.138*** (0.048) 0.131 *** (0.048) 0.152 *** (0.058) 0.177 *** (0.058) 0.195 *** (0.056) Self-employed aged 67 or older -0.057
(0.075) (0.075) -0.060 (0.071) -0.054 (0.073) -0.021 (0.073) -0.008 Aged 67 or older 0.277*** (0.059) 0.273 *** (0.058) 0.292 *** (0.061) 0.308 *** (0.061) 0.309 *** (0.060) Secondary -0.034 (0.062) (0.063) -0.033 (0.063) -0.036 (0.066) -0.040 University 0.021 (0.061) (0.061) 0.023 (0.062) 0.000 (0.067) 0.006 Married 0.078** (0.038) 0.079 ** (0.038) 0.074 * (0.038) 0.080 ** (0.038) Foreign born -0.109* (0.058) -0.109 * (0.057) -0.099 * (0.057) -0.102 * (0.056) Metropolitan area -0.028 (0.039) (0.039) -0.031 (0.039) -0.042 (0.039) -0.037 Working hours 0.001 (0.001) (0.001) -0.000 (0.001) -0.000 Combiner -0.083 (0.117) (0.112) -0.085 (0.099) -0.092 Labour income / 10,000 0.000** (0.000) 0.000 ** (0.000) Constant 0.395*** (0.024) 0.377 *** (0.066) 0.340 *** (0.083) 0.280 ** (0.115) 0.280 ** (0.127) Business line No No No No Yes Prob > F: (Self-employed x Aged 61–66) =
(Age ≥ 67 + Self-employed x Age ≥ 67) 0.218 0.222 0.248 0.136 0.113 Observations 1,564 1,564 1,564 1,564 1,564
R2 0.049 0.063 0.064 0.070 0.099
Note: The results are weighted and adjusted for the sampling design using Stata svy commands. * p < 0.10, ** p < 0.05, *** p < 0.01
Tables 12 and 13 report the results from the estimations of the probability of perceiving the job as mentally straining for males and females, respectively. The unconditional estimates in column 1 in Table 12 show that self-employed males aged 61–66 have an 8 percentage point lower probability of describing their job as mentally straining than do wage-employed males in that age group. Furthermore, self-employed men who are 67 years of age or older have an almost 14 percentage point (–0.08–(–0.013–0.203)) lower probability of reporting that their
job is mentally straining than do self-employed males aged 61–66. Wage-employed males aged 67 or older have a lower probability of reporting that their job is mentally straining than do wage-employed males in the age span 61–66, probably reflecting that individuals who perceive their job as mentally straining is leaving the labour market after the retirement age. Table 12: LPM estimates of the probability of perceiving the job as mentally straining among self-employed and wage-self-employed males (standard errors within parentheses)
(1) (2) (3) (4) (5) Self-employed aged 61–66 -0.080** (0.033) -0.075 ** (0.033) -0.075 ** (0.031) -0.061 * (0.032) (0.032) -0.012 Self-employed aged 67 or older -0.013
(0.045) (0.044) -0.013 (0.043) -0.017 (0.043) -0.002 (0.044) 0.042 Aged 67 or older -0.203*** (0.047) -0.192 *** (0.045) -0.099 ** (0.047) -0.089 * (0.047) -0.088 * (0.046) Secondary 0.083** (0.036) 0.091 ** (0.035) 0.089 ** (0.035) 0.069 * (0.036) University 0.174*** (0.037) 0.192 *** (0.036) 0.183 *** (0.036) 0.110 *** (0.040) Married -0.009 (0.029) (0.028) -0.017 (0.028) -0.021 (0.028) -0.013 Foreign born 0.069 (0.050) (0.050) 0.059 (0.050) 0.060 (0.047) 0.032 Metropolitan area -0.024 (0.031) (0.031) -0.024 (0.031) -0.029 (0.031) -0.028 Working hours 0.007*** (0.001) 0.006 *** (0.001) 0.007 *** (0.001) Combiner -0.050 (0.041) (0.040) -0.055 -0.074 * (0.040) Labour income / 10,000 0.001** (0.000) 0.001 ** (0.000) Manufacturing 0.078 (0.051) Constant 0.395*** (0.026) 0.296 *** (0.040) (0.048) 0.044 (0.049) 0.031 (0.055) -0.051 Business line No No No No Yes Prob > F: (Self-employed x Aged 61–66) =
(Age ≥ 67 + Self-employed x Age ≥ 67) 0.000 0.000 0.202 0.348 0.262 Observations 3,203 3,203 3,203 3,203 3,203
R2 0.045 0.067 0.120 0.123 0.160
Note: The results are weighted and adjusted for the sampling design using Stata svy commands. * p < 0.10, ** p < 0.05, *** p < 0.01
The estimated difference in the probability of perceiving the job as mentally straining between self-employed and wage-employed individuals aged 61–66 remain fairly stable as we add controls for working hours and labour income, but decreases and becomes statistically insignificant when we control for business line. Controlling for working hours decreases the estimated difference across age groups among the wage-employed. In Specification 5, when the full set of controls are added, wage-employed males aged 67 or older have an about 9 percentage point higher probability of perceiving their job as mentally straining compared to wage-employed males aged 61–66. In contrast, when the full set of controls are added there are no statistically significant differences between age groups among the self-employed. The results for females in Table 13 are consistent with the results for males. Specification 1 reveals that self-employed females aged 61–66 have an about 11 percentage points lower probability of perceiving their job as mentally straining than do wage-employed females in the same age group. Self-employed females aged 67 years or older have about 17 percentage
point (–0.111–(–0.063–0.216)) lower probability of reporting that their job is mentally straining than self-employed females aged 61–66.
Adding for demographic controls does not alter the results. However, just as for males, controlling for job characteristics reduces the estimates in magnitude and they become statistically insignificant. When the full set of controls is added in Specification 5 there are no differences in the propensity of reporting that the job is mentally straining between self-employed and wage-self-employed females, or between females in different ages.
Table 13: LPM estimates of the probability of perceiving the job as mentally straining among self-employed and wage-self-employed females (standard errors within parentheses)
(1) (2) (3) (4) (5) Self-employed aged 61–66 -0.111** (0.045) -0.101 ** (0.042) -0.098 ** (0.042) -0.071 * (0.043) (0.043) -0.002 Self-employed aged 67 or older -0.063
(0.066) (0.061) -0.080 (0.061) -0.100 (0.061) -0.063 (0.065) 0.006 Aged 67 or older -0.216*** (0.055) -0.216 *** (0.053) -0.105 * (0.057) (0.056) -0.087 (0.055) -0.076 Secondary 0.119** (0.055) 0.127 ** (0.054) 0.123 ** (0.053) (0.052) 0.080 University 0.275*** (0.056) 0.269 *** (0.055) 0.245 *** (0.055) 0.181 *** (0.056) Married -0.101*** (0.037) -0.091 ** (0.036) -0.096 *** (0.036) -0.079 ** (0.036) Foreign born 0.038 (0.062) (0.057) 0.042 (0.056) 0.053 (0.054) 0.038 Metropolitan area 0.035 (0.038) (0.038) 0.025 (0.038) 0.014 (0.037) 0.045 Working hours 0.006*** (0.001) 0.005 *** (0.001) 0.005 *** (0.001) Combiner 0.077 (0.076) (0.072) 0.076 (0.065) 0.067 Labour income / 10,000 0.003*** (0.001) 0.003 *** (0.001) Constant 0.476*** (0.024) 0.338 *** (0.057) 0.118 * (0.071) (0.070) 0.096 (0.107) 0.066 Business line No No No No Yes Prob > F: (Self-employed x Aged 61–66) =
(Age ≥ 67 + Self-employed x Age ≥ 67) 0.003 0.000 0.046 0.126 0.192 Observations 1,564 1,564 1,564 1,564 1,564
R2 0.044 0.099 0.131 0.138 0.184
Note: The results are weighted and adjusted for the sampling design using Stata svy commands. * p < 0.10, ** p < 0.05, *** p < 0.01
Our final estimations focus on the probability of perceiving the job as stressful. The unconditional results in column 1 in Table 14 shows that self-employed males aged 61–66 have almost an 8 percentage point lower probability of reporting that their job is stressful than wage-employed males in the same age group. Older self-employed individuals have a lower probability of reporting that their job is stressful than do self-employed individuals aged 61– 66. The difference amounts to about 24 percentage points (–0.078–(–0.044–0.277)). Wage-employed individuals aged 67 or older have a lower probability of reporting that their job is stressful than wage-employed aged 61–66.
Table 14: LPM estimates of the probability of perceiving the job as stressful among self-employed and wage-employed males (standard errors within parentheses)
(1) (2) (3) (4) (5) Self-employed aged 61–66 -0.078** (0.035) -0.078 ** (0.034) -0.073 ** (0.032) -0.059 * (0.032) (0.034) -0.049 Self-employed aged 67 or older -0.044
(0.050) (0.050) -0.039 (0.048) -0.043 (0.049) -0.028 (0.051) -0.004 Aged 67 or older -0.277*** (0.052) -0.277 *** (0.052) -0.152 *** (0.053) -0.142 *** (0.053) -0.137 *** (0.051) Secondary -0.005 (0.040) (0.038) 0.005 (0.038) 0.004 (0.039) 0.004 University 0.082** (0.040) 0.105 *** (0.038) 0.096 ** (0.038) 0.096 ** (0.041) Married -0.006 (0.031) (0.029) -0.017 (0.029) -0.021 (0.029) -0.023 Foreign born 0.049 (0.051) (0.051) 0.036 (0.051) 0.036 (0.049) 0.022 Metropolitan area -0.036 (0.032) (0.031) -0.036 (0.031) -0.042 (0.032) -0.050 Working hours 0.009*** (0.001) 0.009 *** (0.001) 0.008 *** (0.001) Combiner -0.094** (0.042) -0.098 ** (0.041) -0.112 *** (0.042) Labour income / 10,000 0.001** (0.000) 0.001 ** (0.000) Constant 0.510*** (0.027) 0.491 *** (0.044) 0.155 *** (0.054) 0.141 *** (0.054) (0.060) 0.062 Business line No No No No Yes Prob > F: (Self-employed x Aged 61–66) =
(Age ≥ 67 + Self-employed x Age ≥ 67) 0.000 0.000 0.000 0.000 0.003 Observations 3,203 3,203 3,203 3,203 3,203
R2 0.088 0.097 0.181 0.183 0.199
Note: The results are weighted and adjusted for the sampling design using Stata svy commands. * p < 0.10, ** p < 0.05, *** p < 0.01
Again controlling for demographics has a minor impact on the results. However, just as for the other job-related outcomes, working hours positively affects the probability of reporting that the job is stressful. Further, being a combiner reduces the probability of reporting that the job is stressful. Thus, combining self-employment and wage-employment seems to reduce stress for older men who remain in the labour market. It is also worth noting that income does not appear to be an important determinant of the probability of perceiving a job as stressful. When the full set of controls is added in Specification 5 we find that self-employed males aged 67 or older have about 9 percentage point (–0.049–(–0.004–0.137)) lower probability of reporting that their job is stressful than do self-employed males aged 61–66.
The results for females are found in Table 15. Specification 1 shows that self-employed females aged 61–66 have roughly a 23 percentage point lower probability of reporting that their job is stressful than do wage-employed females in the same age group. Self-employed females who are 67 years of age or older have an even lower probability of reporting that their job is stressful than do wage-employed females of the same age. This difference amounts to almost 17 percentage points. Among the self-employed, females aged 67 or older have a 25 percentage points (–0.232–(–0.172–0.308)) lower probability than those aged 61–66 to perceive their job as stressful.