TVE15064
Examensarbete 15 hp
Juni 2015
Increasing the hosting Capacity
of Radial Distribution Grids in
Jordan
Fadi AlAlamat
Institutionen för teknikvetenskaper
Department of Engineering Sciences
Teknisk- naturvetenskaplig fakultet UTH-enheten Besöksadress: Ångströmlaboratoriet Lägerhyddsvägen 1 Hus 4, Plan 0 Postadress: Box 536 751 21 Uppsala Telefon: 018 – 471 30 03 Telefax: 018 – 471 30 00 Hemsida: http://www.teknat.uu.se/student
Abstract
INCREASING THE HOSTING CAPACITY OF
RADIAL DISTRIBUTION GRIDS IN JORDAN
Fadi AlAlamat
Photovoltaic (PV) energy has a great potential in Jordan, due to the high levels of solar irradiance the country experiences. Additionally, both the daily and yearly load profiles show a positive correlation between electricity consumption and solar irradiance. However, high PV penetration in classical distribution systems might lead to a number of technical problems, including overvoltage and overcurrent.
Therefore, it is crucial to determine the hosting capacity of radial distribution grids in Jordan, even if detailed data of the distribution load is lacking. This project develops a deterministic model to measure the hosting capacity of distribution grids due to instantaneous injection of distributed power. The model is applied on two grids: a 73-node grid with high (X/R) ratio, located in the south of Jordan; and a 19-node hypothetical grid with low (X/R) ratio designed according to Jordanian standers. Different methods to increase the hosting capacity of the grids are examined, including cable reinforcement and reactive power control. A modified version the constant inverter power factor method is introduced, that aims to generate equal amounts of reactive power to the amounts consumed by the PV inverters. Finally, the results of the different methods are compared. Reactive power control proved sufficient for the 73-node grid with high (X/R), whereas cable reinforcement proved sufficient for the 19-node hypothetical grid with low (X/R). These results would help in deciding which method of increasing the hosting capacity to apply on other distribution systems, based on the parameters of these distribution systems.
UPTEC FRISTTVE15064 Examinator: Nora Masszi
Ämnesgranskare: Mikael Bergkvist Handledare: Joakim Widén
III
Popular scientific summary
Unlike most other countries in the Middle East, Jordan lacks adequate amounts of conventional energy resources, such as fossil fuels. So to cover its energy needs, Jordan is forced to import petroleum and natural gas from neighboring countries, which has been a heavy burden on Jordan’s growing economy. Nonetheless, the absence of fossil fuels in Jordan is counterbalanced by the abundance of solar energy, which could be harvested by the use of solar panels, otherwise known as photovoltaic (PV) panels.
Solar panels are noiseless, have no unhealthy emissions, and require very little maintenance. These characteristics make them perfect to use in residential areas, where each house could generate its own green electricity. The introduction of solar panels into the residential electric system (or, simply, electric grid) is known as penetration. If these panels generate too much electricity – more than what the household needs – the excessive electricity will be injected back into the electric power system.
Injecting more electricity into the grid than it was designed to handle will cause many problems, as each grid has the ability to handle a certain amount of power from solar panels (the hosting capacity of the grid). The aim of this project is to find the best methods to increase the hosting capacity of electric grids in Jordan, i.e., increase the amount of solar energy that the grid can tolerate without causing any technical problems, and to determine which methods are effective for certain grids.
Firstly, a procedure was developed that would determine how much solar generated electricity any grid can withstand. Secondly, different methods for enabling the electric grid to receive more solar generated electricity were examined on two grids: one located in Al Qatraneh in the south of Jordan, and the other is a hypothetical grid that was designed for this thesis. All the methods were tried on both grids in order to determine which one is most suitable for each of them. Then, the best method (or combination of methods) was decided for each grid. Finally the results were analyzed in an attempt to figure out the reasons behind the success or failure of each method.
IV
Preface
This thesis is written in fulfilment of the requirements for the degree of Bachelor of Science program in Electrical Power and Energy engineering at Princess Sumaya University for Technology. The project was done at Uppsala University on an exchange program, and was supervised by both Joakim Widén (UU) and Ayman Faza (PSUT). Mikael Bergkvist (UU) is the project mentor and Martin Sjodin (UU) is the examiner.
V
Contents
1 Introduction ... 1
1.1 Background ... 1
1.2 Importance of photovoltaic energy for Jordan ... 2
1.3 Project Goals ... 5
1.4 Limitations ... 5
2 Theory ... 6
2.1 Hosting capacity ... 6
2.2 How DG penetration causes overvoltage ... 7
3 Methodology ... 10
3.1 Model for determining the hosting capacity ... 10
3.2 Methods to increase hosting capacity ... 12
3.2.1 Reactive power control through inverter power factor ... 12
3.2.2 Reactive power support with capacitor banks ... 13
3.2.3 Cable reinforcement ... 14
4 Studied Grids ... 16
4.1 The 11-Node Test Feeder ... 16
4.2 The 19-Node Test Feeder ... 17
4.2.1 Transformer ... 18
4.2.2 Cables ... 19
4.3 Al Qatraneh Distribution System ... 20
4.4 Load profiles ... 22
5 Results ... 24
5.1 Initial hosting capacity of studied grids ... 24
5.1.1 Initial hosting capacity of the 19-Node Test Feeder ... 24
5.1.2 Initial hosting capacity of the Qatraneh Grid ... 24
5.2 Results of the three methods on the 19-Node test feeder ... 25
5.2.1 Effect of Inverter power factor control ... 25
5.2.2 Effect of Cables reinforcement and Capacitor Banks ... 26
5.3 Results of the three methods on the Qatraneh distribution system ... 27
5.3.1 Effect of Inverter power factor control ... 28
5.3.2 Effects of Capacitor Banks in addition to of Inverter power factor control ... 28
VI
6.1 Analysis of the results ... 29 6.2 Solar matching of reactive power ... 30 7 Conclusions ... 31
VII
Abbreviations
DG: Distributed Generation
DER: Distributed Energy Resources
MV: Medium Voltage
PV: Photovoltaics
LV: Low Voltage
DLC: Daily Load Cycle
MP: Midday Peak
EP: Evening Peak
W:Watt
VA: Volt-ampere
VAr: Volt-ampere reactive
1
1 Introduction
1.1 Background
Driven by economic and environmental concerns, the demand for reliable carbon-free methods to generate electricity is only expected to increase. Also, since generation – both from renewable and non-renewable resources – is becoming more efficient, transmission and distribution, nowadays, comprise a higher percentage of the total electricity delivery cost. This has increased the importance of Distributed Energy Resources (DER) and Distributed Generation (DG) compared to classical centralized generation. Adding that to the fact that that the cost of photovoltaic (PV) generation has been falling significantly [1] helps us appreciate the importance of PV integration into distribution grids. Therefore, we need to study the ability of a grid to handle PV penetration without compromising the quality of the power being delivered, otherwise known as the hosting capacity [2].
PV modules have numerous characteristics that make them perfect to use in low and medium voltage distribution systems, especially in residential areas. For instance, they are noiseless, easy to install, have no emissions, and require little maintenance [3]. But high levels of PV integration, or, in fact, high levels of any form of distributed energy resources , have many undesired consequences on the grid, such as overvoltage, overcurrent and harmonic distortions [4]. Overvoltage happens because the direction of the power-flow in the grid is reversed: from the buses to the substation [5]. In addition to preventing overvoltage, the power fed back to the substation transformer should not exceed its VAR rating, and the current through the cables should not exceed the current carrying capacity.
These negative effects normally happen because most of the distribution networks currently in service were not designed to handle generation at the distribution level; distribution grids were designed to distribute centrally generated electrical power that is delivered by the utility. Even though the conventional design of the grid has numerous advantages [6], this design philosophy limits the ability of grids to handle large amounts of distributed generation.
All countries have design codes that ensure a certain level of power quality to the customer. For instance, in the United States, voltage served to residential areas is not allowed to increase to more than five percent of the nominal voltage under normal operating conditions [7]. But since this study is concerned with the hosting capacity of networks resembling the Jordanian network, the Jordanian standards will be used, which also allows a voltage variation of five percent of the nominal voltage for 230-volt systems [8]. Five percent variation is the limit set for the voltage as received by the customer. Therefore, it would be advisable to set a tighter and more restrictive limit for the voltage at the buses. Consequently, four percent will be the limit for this project.
Many methods have been developed over the years to reduce the effect of overvoltage on radial grids. The simplest method is to lower the setpoint of the on-load tap changer in the substation transformer [9]. Another rather simple method is to reinforce the cables or replace
2
them with thicker ones. Increasing the cross-sectional area of the cable has two benefits: first, it decreases the cable’s impedance and hence the voltage-drop through it, which helps maintain a better voltage profile for the grid. Second, thicker cables have higher current carrying capacity, and can therefore handle higher amounts of power through them. But overall, the method that has previously proved to be most efficient and feasible is reactive power control [5], [10]. Reactive power in the grid could be controlled by changing power factor of the PV inverter. It could be also controlled by the introduction of capacitor banks connected to certain busses in the grid.
This project will study the effects of these methods to increase the hosting capacity of radial grids. The focus will mostly both be on distribution grids currently in service in Jordan, and a designed distribution grid with characteristics similar to the Jordanian grids. The rationale behind this choice will be explained in the next section ( 1.2). Determining the hosting capacity will be done deterministically by building computer models of the grid, and testing the effects of DG penetration under different loading scenarios.
1.2 Importance of photovoltaic energy for Jordan
Unlike most other countries in the region, Jordan does not own sufficient amounts of conventional energy resources. In fact, Jordan imports 97% of its total energy resources from other countries, which puts a heavy economic and political burden on the Jordanian government [11].Most of the electricity generated in Jordan depends on natural gas imported from Egypt, the supply of which has been very unreliable over the years. The cost of generating electricity has been increasing at a rate of 19.2% per year between 2010 and 2013, rising from 3.4% in earlier years. This drastic increase happened because power stations had to switch from gas to diesel and heavy fuel, in order to compensate for the shortage in Egyptian gas.
Nevertheless, the lack of fossil fuel resources in Jordan is balanced out by the abundance in renewable energy resources, especially wind and solar energy. Jordan is considered to be one of the Sun Belt countries, as it lies between latitudes 28.4-33.3 °N, and it exhibits an average annual incident solar irradiance per day ranging between 3.8 and 8 k Wh/m2 depending on the season [12]. This indicates that solar energy has the potential of being an economically feasible alternative to gas.
Furthermore, studying the electricity demand in Jordan shows a positive correlation between demand and ambient temperature; the overall load increases as temperatures rise. This correlation is explained by the fact that a large portion of the energy consumed for domestic and industrial purposes is used for cooling. For instance, studying The Jordanian daily load curves indicates that the power demand peaks around midday, particularly between 11 a.m. and 2 p.m., which is when solar radiation reaches its highest values of the day. This trend (the positive correlation between temperature and consumption) has been increasing since 1994, due to the increased usage of power intensive air-conditioning as an alternative to cooling
3
fans [13]. Figure 1 compares the peak electricity demands between the years 2000 and 2007 during summer and winter. Even though consumption during both years show the same two-peak behavior, with one two-peak occurring during midday and the other occurring around sunset, the midday peak shows higher levels of consumption during 2007. Since the price of air-conditioning units is going down, and since more households are adapting air-air-conditioning, it is safe to assume that the dominance of the midday peak will prevail in future years.
Figure 1: The annual maximum DLC for summer and winter of 2000 and 2007 [13]
Not only does electricity demand increase with temperature on a diurnal level, demand also tends to increase in summer and decrease in winter [13]. Figure 2 illustrates the monthly midday peak (MP) and evening peak (EP) loads for the years 2000 and 2007. There are two main points that could be deduced form the graph. Firstly, consumption is obviously higher during summer. Secondly, we can see how midday peak and evening peak have diverged during 2007 compared to 2000, with the MP becoming significantly higher than EP.
4
Figure 2: Monthly midday and evening peak consumption for 2000 and 2007 [13]
The positive correlation between consumption and temperature, and, consequently, between consumption and daily solar radiation, makes the adaption of solar power in Jordan more economically appealing. The battery technology of today is still both expensive and insufficient for storing large amounts of electric energy. Therefore, it is of utmost importance to try to match generation- from renewable resources- to consumption. In the Jordanian case, peak consumption and peak solar radiation are naturally matched; peak load and peak generation from photovoltaics occur almost simultaneously.
With Jordan being in urgent need for local energy sources, and solar energy being perfectly suitable for the Jordanian electricity market, investing in photovoltaics seems not only a wise economic and environmental decision to make, but rather a necessary and urgent one. In addition, more governments and corporations are investing in the development of PV technology, which will lead PV panels to become both more affordable and efficient in the future. In fact, the National Electric Power Company aims to increase the share of renewable resources to 10% in 2020 [14]
5
1.3 Project Goals
This project has two main goals:
To devise a simple deterministic method to measure the hosting capacity of different distribution grids, in case the load data of these grids is lacking or insufficient.
To apply different methods for increasing the hosting capacity on Jordanian distribution grids, in order to assess the effectiveness and limitations of each method.
1.4 Limitations
This project is limited to studying the technical limitations of different methods to increase the hosting capacity of radial distribution networks. Other economic, demographic, and political limitations are at least as important as the technical limitations. However, these limitations will not be studied here, as they lie outside the scope of this project.
Predicting the likelihood of implementing large numbers of PV in the foreseeable future is another task that lies beyond the scope of this project. Even though section 1.2 pointed out the numerous benefits of harvesting solar energy in Jordan, it does not hint that any large-scale adoption of PV energy is in view. This project only studies methods for increasing the hosting capacity of grids assuming high levels of PV penetration were actually implemented.
6
2 Theory
2.1 Hosting capacity
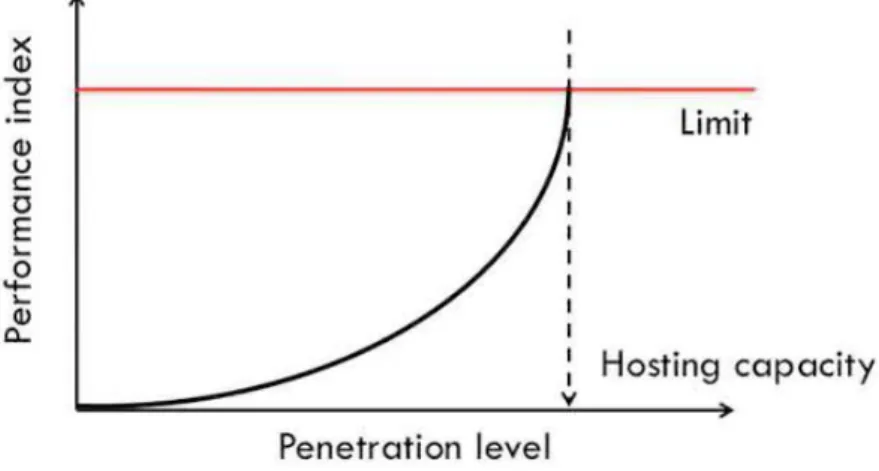
The hosting capacity of distribution grids generally refers to the level of DG penetration that the grid can withstand before exceeding one or more performance indices. See Figure 3.
Figure 3: Definition of hosting capacity
DG penetration could be defined in a variety of ways. For instance, a common definition of penetration is: the percentage of the total power from distributed energy resources (DER) consumed within the grid to the total consumption during a whole year. This study, however, will not focus on increasing the grid’s capacity for DG penetration on a yearly timescale, because the purpose of the study is to analyze the instantaneous effect of injecting high amounts of DG power on the grid with respect to certain performance indices. Thus, DG penetration will be defined as the instantaneous injection of DG power into the distribution network in Watts.
The hosting capacity of the grid is defined with respect to performance indices. In the case of high levels of PV power injected into a distribution system, there are two main categories for technical limitations on the network’s hosting capacity [15]:
• Voltage limitations, represented by the bus voltages in relation to the nominal value.
• Current limitations, represented by allowable loading of transformers and cables. As a result, bus voltage was chosen as the first performance index for the purposes of this study; the hosting capacity will be measured as the maximum amount of DER power generated before the bus voltage exceeds 1.04 per unit, in accordance with the Jordanian design standards.
7
The second and third performance indices are the current through cables and the apparent power at the substation transformer respectively. These limitations are particularly important because overloading cables and transformers will lead to their depreciation, or, in extreme overloading cases, their failure. Both cables and transformers have certain nameplate values set by their manufacturers. Nonetheless, these limitations are not as binding as the voltage quality limits set by governments, in the sense that exceeding them for short periods of time should not necessarily lead to negative impact on the equipment. In this thesis, exceeding the ampacity limits of the distribution cables will be avoided, but overloading the transformer will be allowed within certain boundaries, these limitations will be discussed further in later sections.
In order to be able to quantify the hosting capacity of different grids using a computer algorithm, a more mathematically accurate definition must be used. Hence, the following definition was proposed:
The hosting capacity of the grid is the maximum amount of DG power injected into the Distribution Network before the voltage at the bus, the current through cables or the power fed back to the substation exceed their maximum allowed value.
2.2 How DG penetration causes overvoltage
This section will discuss the factors that determine the voltage at the buses when DG penetration is present. By knowing the factors that determine the value of the bus voltage, we gain a better understanding of the different methods developed to decrease overvoltage. This kind of understanding is important as it enables engineers to choose the best method to decrease overvoltage for each grid.
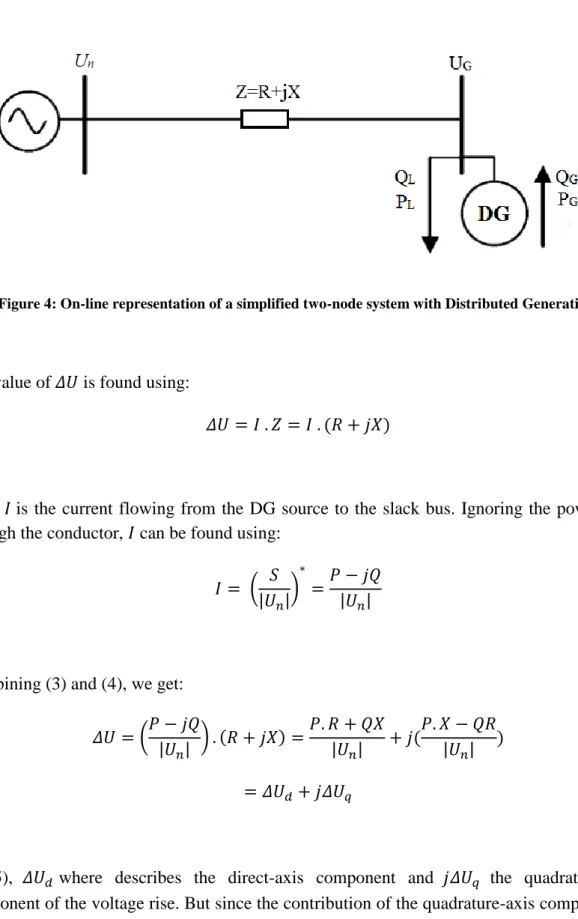
Figure 4 shows a one-line diagram of a simplified power system with two nodes and distributed generation. 𝑈𝑛 is the nominal voltage at the slack bus, which will be assumed constant, and with power angle equal 0˚. Z represents the line impedance, comprising the series resistance 𝑅 and the series reactance 𝑋 Voltage rise 𝛥𝑈 is defined as:
𝛥𝑈 ≡ 𝑈𝐺 − 𝑈𝑛
(1) In this system, S is defined as the total amount of power injected into the system from the load bus as shown in equation (2), where 𝑃𝐺 and 𝑄𝐺 represent the active and reactive powers generated by the PV inverter respectively; and 𝑃𝐿 and 𝑄𝐿 represent the active and reactive power consumed at the bus respectively.
8
𝑆 ≡ (𝑃𝐺 − 𝑃𝐿) + 𝑗(𝑄𝐺− 𝑄𝐿) = 𝑃 + 𝑗𝑄
(2)
Figure 4: On-line representation of a simplified two-node system with Distributed Generation.
The value of 𝛥𝑈 is found using:
𝛥𝑈 = 𝐼 . 𝑍 = 𝐼 . (𝑅 + 𝑗𝑋)
(3) Here, 𝐼 is the current flowing from the DG source to the slack bus. Ignoring the power loss through the conductor, 𝐼 can be found using:
𝐼 = ( 𝑆 |𝑈𝑛| ) ∗ = 𝑃 − 𝑗𝑄 |𝑈𝑛| (4) Combining (3) and (4), we get:
𝛥𝑈 = (𝑃 − 𝑗𝑄 |𝑈𝑛| ) . (𝑅 + 𝑗𝑋) =𝑃. 𝑅 + 𝑄𝑋 |𝑈𝑛| + 𝑗(𝑃. 𝑋 − 𝑄𝑅 |𝑈𝑛| ) = 𝛥𝑈𝑑+ 𝑗𝛥𝑈𝑞 (5)
In (5), 𝛥𝑈𝑑 where describes the direct-axis component and 𝑗𝛥𝑈𝑞 the quadrature-axis component of the voltage rise. But since the contribution of the quadrature-axis component is miniscule in comparison with the direct-axis component, it is safe to neglect it [9]. It follows:
9
𝛥𝑈 ≅𝑃. 𝑅 + 𝑄𝑋 |𝑈𝑛|
(6) The amount of voltage rise depends on the variables in equation (6). To increase the capacity of distribution grids currently in service, we have control over four of the variables; as |𝑈𝑛|is a design parameter of the distribution network and is very hard to modify.
Different methods to increase the hosting capacity focus, each, on one or more variables in equation (6). For instance, reactive power control aims to make the value of 𝑄 less than zero; while cable reinforcement aims to decrease the values of 𝑅 and 𝑋.
10
3 Methodology
3.1 Model for determining the hosting capacity
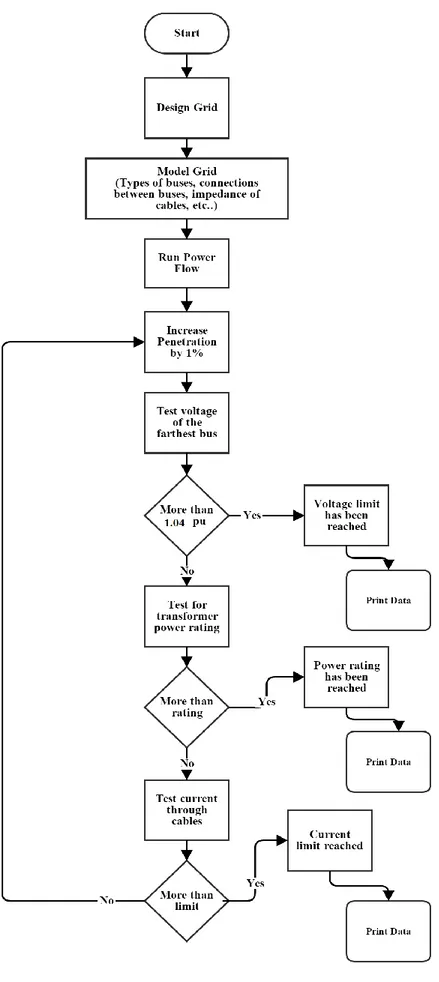
Referring to the definition in Section 2.1, the hosting capacity could be calculated by gradually increasing the amount of penetration in the network in multiple small incremental steps, where the penetration is slightly increased in each step, and then measuring the performance indices after each step. If any limits are violated, the simulation should stop; otherwise, the algorithm will increase penetration once more and repeat the whole process. Here, the hosting capacity would correspond to the amount of DG penetration in the last step, right before any performance indices are breached. In this study, the amount of power generated by PV was represented by power injected at all buses equally.
As mentioned above, the performance indices are bus voltages, branch currents, and substation apparent power. All three of these values could be calculated by running a power-flow analysis on the grid, which is a numerical analysis of the power-flow of electric power through the distribution system. Many iterative methods were developed for analyzing the flow of power through the electrical system, but the most common method is the Newton-Raphson method, which is the method that was used in this project [16].
A power-flow analysis will be performed after each increment in DG penetration. The voltages, currents and power will be compared to the maximum allowed value after each power-flow calculation, in order to check whether the grid still has capacity for more penetration. If none of the maximum values was reached, penetration will increase and all the calculations will be repeated. This will continue until one of the maximum values has been exceeded. Then, the total amount of penetration at that particular step will be considered the hosting capacity of the grid. This algorithm is presented in the form of a flow chart in Figure 5.
11
12
The study is performed by building computer models of the studied grids, and then running the algorithm previously mentioned on the models. MATLAB was chosen for the study. There are two main advantages of using MATLAB:
1. MATLAB provides perfect control over any script, which means that any power-flow algorithm could be extended and modified to better suit the scope of the project.
2. Network modelling in MATLAB is relatively quick. Plus it is easy to change or modify electrical networks modelled with MATLAB.
The power-flow calculations will be done using MATPOWER [17], which is a package of MATLAB M-files for solving power-flow and optimal power-flow problems. MATPOWER enables the use of iterative methods to conduct a power-flow calculation on the grid, including the Newton-Raphson method which was chosen for this project. The detailed MATLAB script is presented in Appendix A.
3.2 Methods to increase hosting capacity
So far, a mathematically accurate definition of hosting capacity has been outlined, and a MATLAB model to determine the hosting capacity has been constructed. In this section, the main methods to increase the hosting capacity are presented.
3.2.1 Reactive power control through inverter power factor
Various methods for controlling reactive power have been developed for the aimed at limiting overvoltage caused by DG power injection into MV and LV grids. The most common reactive power control methods (Q-methods) methods include: Fixed reactive power method (Fixed Q method), Fixed Power Factor or Fixed cosϕ Method, and cosϕ (P) characteristic Method. [18], [19].
The first proposed Q-method was the Fixed Power Factor Method. The idea is that the PV inverters at the buses farthest away from the substation will be set consume reactive power. In other words, PV investors will run at lagging non-unity power factor. Herein, the consumption of reactive power will lead a drop in voltage at the respective buses.
Since the fixed variable will be the power factor rather than the amount of reactive power consumed, the amount of reactive power consumed at each bus will depend on the amount of power generated by the PV system. This means that as PV generation increases (which is the reason behind overvoltage) the amount of reactive power consumed will also increase, which will limit the overall voltage rise. The reactive power will, hereby, work as a negative feedback input that keeps the voltage level in check.
Nonetheless, this solution poses a number of issues that need to be examined. The first obstacle is the need to generating more reactive power in order to match the increasing
13
demand. The generation of this power could be done locally (within the distribution grid), or it could be supplied by the transmission system. Receiving more reactive power from the transmission system will lead to more overloading of the substation transformer. But since the study presumes high levels DG penetration, the substation transformer would have been overloaded already. So the best option to avoid further overloading is to generate the reactive power locally.
Generating reactive power leads to an increase in voltage, which should be taken into consideration when choosing the best location for placing the reactive power generators. Taking a look at the voltage levels of different buses, indicates that not all buses in the distribution feeder exhibit the same levels of overvoltage; only the buses farthest away from the substation exhibit an increase in voltage close to 4%. Thus, these buses can handle a slight increase in voltage caused by generating reactive power near them. This solves the problem of the best location to generate reactive power.
Since the distribution networks under study cover a relatively small area, it is safe to assume that weather conditions are similar. Consequently, the amount of solar energy collected by different photovoltaics within the distribution grid would be similar. If we set some PV systems to generate reactive power, and others to consume it, the two values will be matched, without the need for complex sensors and controllers. In other words, solar radiation will work as a natural controller that ensures equal levels of generation and consumption.
This modification to the Fixed Power Factor Method will be referred to as solar matching of reactive power. The method will be tested on the 19-node test feeder and the Qatraneh distribution system, in order to assess its effectiveness, and to determine its limitations.
3.2.2 Reactive power support with capacitor banks
As mentioned in previous sections, overloading the transformer usually leads a decline in its life expectancy. It is, therefore, advisable to always try to limit the transformer load and keep it close to the nameplate rating. The rating of the transformer is a rating of the amount of Apparent Power passing through it in volt-amperes. Both The active and reactive powers contribute to how much apparent power the transformers need to handle.
In both grids, active power could flow either from the transmission network towards the distribution network, which is the case when distributed energy resources is less than the consumption, or from the distribution grid to the transmission network, which is the case when distributed generators generate more power than the network needs. Reactive power, on the other hand, will only flow from the transmission side to the distribution side, because no excess amount of reactive power will be generated within the distribution systems. Consequently, generating the needed amount of power within the distribution grid itself will decrease the amount of apparent power through the transformer, leading to less overloading and a better life expectancy.
14
It is possible to generate reactive power with the inverter in the PV system [20]. However, this will increase the voltage at the bus where the modules are connected. However, the power generated by PV modules fluctuates drastically over time, and even drops to zero at night. Relying completely on PV invertors to generate reactive power would, therefore, be unreliable.
On the other hand capacitor banks provide a highly reliable and stable source of reactive power. Another benefit is decreasing the power losses at the transformer. Additionally, capacitor banks will help the grid maintain a more stable voltage profile, as capacitor banks limit voltage drop when consumption is much high than distributed energy resources . But the main purpose behind introducing capacitor banks is to avoid overloading the substation transformer.
The amount of reactive power consumed within the distribution grid depends on the amount of consumption. It is possible to install automatic capacitor banks that match the amount of reactive power supplied to the amount consumed, but these banks are significantly more expensive. So because of economic concerns, Fixed Type Capacitor Banks were chosen. These capacitor banks should supply the base needed amount of reactive power. This means that it would be a good decision to choose capacitor banks that supply the amount of reactive power consumed by the minimum load.
In the case of The 19-Node Test Feeder, the amount of reactive power consumed is equal to 1.6 MVAR, during the low consumption scenario. The average demand on reactive power is equal to 2.27 MVAR. Therefore, a capacitor bank of 2 MVAR power ratting was chosen as a compromise. On the other hand, the Qatraneh test feeder consumes a higher base amount of reactive power (3.5 MVAR). A capacitor bank with power rating of 3.5 MVAR will, therefore, be used.
3.2.3 Cable reinforcement
In this study, cable reinforcement refers to the replacement of the distribution system’s branch cables with cables that have a higher ampacity and/or larger cross-sectional area. When it comes to hosting capacity, there are two main reasons for reinforcing the cables:
1. Cable reinforcement might be needed to increase the ampacity of the cables when other methods of increasing the hosting capacity are used. Increasing the hosting capacity would lead to a higher DG penetration in the distribution system, leading to higher currents going through the cables.
2. Cable reinforcement could be used as an independent method to increase the hosting capacity of the system by decreasing the amount of voltage rise caused by DG penetration. This could be explained if we looked at equation (6).
15
𝛥𝑈 ≅ 𝑃. 𝑅 + 𝑄𝑋 |𝑈𝑛|
(6) Voltage rise (𝛥𝑈) increases as the resistance of the cables (𝑅) increases. Therefore, replacing the old cables with new ones that have a higher cross-sectional are, and consequently lower resistance, will decrease the chances of overvoltage even when high levels of penetration are present.
The focus of this project is will be on the first reason for using cable reinforcement, i.e., cable reinforcement will be used as an auxiliary method to the main method of reactive power control, because higher penetration levels will generate a need for cables with higher current carrying capacity.
16
4 Studied Grids
4.1 The 11-Node Test Feeder
The study was initially intended to simulate a simplified version of the IEEE 13-node test feeder [21]. The test feeder was chosen because provides a good description of the general characteristics of radial distribution grids, despite the fact that it was originally designed to provide a common testing sample for software developers to test their power-flow analyzing software.
The test feeder has an unbalanced nature, which makes it hard to conduct a power-flow analysis. It was, therefore, decided to use a balanced simplified version 11-node version of the feeder, developed by Line Fiskum Hexeberg at The Norwegian University of Science and Technology [22]. Figure 6 shows a one line diagram of the modified feeder.
Figure 6: One line diagram of the 11-node test feeder [22]
Testing the hosting capacity of the 11-node test feeder showed that it has high resistance towards overvoltage; the test feeder could handle very high levels of penetration before reaching 1.04 PU voltage limit at its farthest bus. See Figure 7.
17
Figure 7: Voltage (PU) at the farthest bus against penetration level (as a percentage of the consumption). This graph shows how resistant the grid is to overvoltage caused by PV penetration.
Since the main goal of the project is to increase the hosting capacity of distribution systems by decreasing overvoltage, and since the 11-Node Test Feeder has high hosting capacity without any design modifications, the decision was made to abandon the grid in this project. It would be much more suitable to design a radial grid with similar characteristics to the grids in service in Jordan. Such a grid would have a much lower hosting capacity, and would, therefore, be more useful in this project.
4.2 The 19-Node Test Feeder
As mentioned in the previous section, The 11-Node Test Feeder was, before any design improvements, very tolerant to PV penetration. Consequently, it was decided to design a test feeder with less DER hosting capabilities.
The designed grid is a radial medium voltage (MV) grid, inspired by the common design characteristics of 11-kV distribution grids in Jordanian, in the sense that it has similar topology and components
18
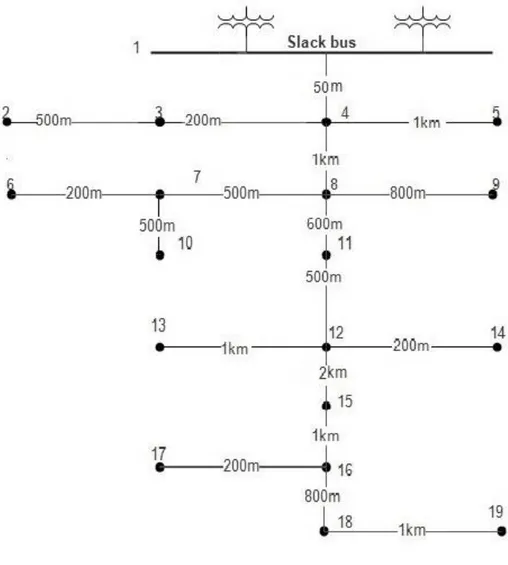
The grid comprises 19 buses with a nominal voltage of 11 kV operating at 60 Hz frequency. Power reaches the grid from the transmission network through two 5MVA transformers connected to the slack bus (node number one). Figure 8 shows the connections between buses and their lengths.
Figure 8: Designed Grid showing distances between buses (not to scale)
4.2.1 Transformer
The chosen transformers are two Mineral-oil-immersed 5000 kVA transformers. They receive electrical power from the transmission network at 132 kV at the primary terminal, and step-down the voltage to 11 kV, before distributing it to a secondary distribution system. The transformers are assumed to be ideal in the computer model.
Since the aim of the project is to increase the grid’s capacity for PV penetration, high amounts of power are going to be injected back into the substation transformer from the distribution system. Overloading the transformer for long periods of time will deteriorate transformer insulation causing its life expectancy to decrease. In addition to insulation loss,
19
other factors have to be taken into account, such as oil expansion and the thermal capability of bushings [23]. Therefore, a limit on the amount of power fed back to the transformer from the distribution feeder has to be set. One possible limit could be the nameplate value of the transformer substation. But the nameplate value is not considered to be a binding value that cannot be exceeded. Some references allow mineral-oil-immersed substation transformers to be loaded at 200% of their nameplate value [23]. Therefore, 2 MVA was set as the power limit in the simulation. Exceeding this value could lead to exceeding the reference temperature of 110˚c by a big margin, causing damage to the transformer.
4.2.2 Cables
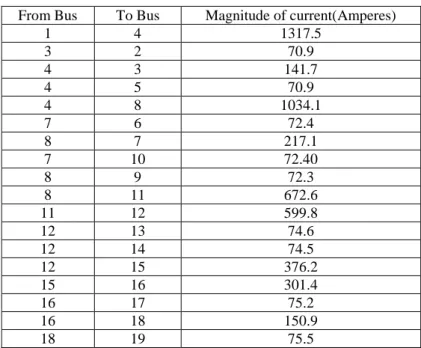
Choosing the appropriate cables for the grid depends mainly on two factors: the voltage level (to determine the insulation type) and the maximum current through the cable (to determine the thickness of the conductor). Since the voltage is set to 11kV, I only needed to estimate the current through the conductors in order to choose the cable types. To see the maximum current that each cable would need to handle, a simulation was run with power consumed by the load was assumed to be 140% of the transformer rating, and the impedance of the cables was assumed to be 0.161+j 0.167Ω/km. The current through all the different branches is shown in Table 1.
Table 1: The current through the different branches in the scenario of extremely high load (140% of the transformer rating)
From Bus To Bus Magnitude of current(Amperes)
1 4 1317.5 3 2 70.9 4 3 141.7 4 5 70.9 4 8 1034.1 7 6 72.4 8 7 217.1 7 10 72.40 8 9 72.3 8 11 672.6 11 12 599.8 12 13 74.6 12 14 74.5 12 15 376.2 15 16 301.4 16 17 75.2 16 18 150.9 18 19 75.5
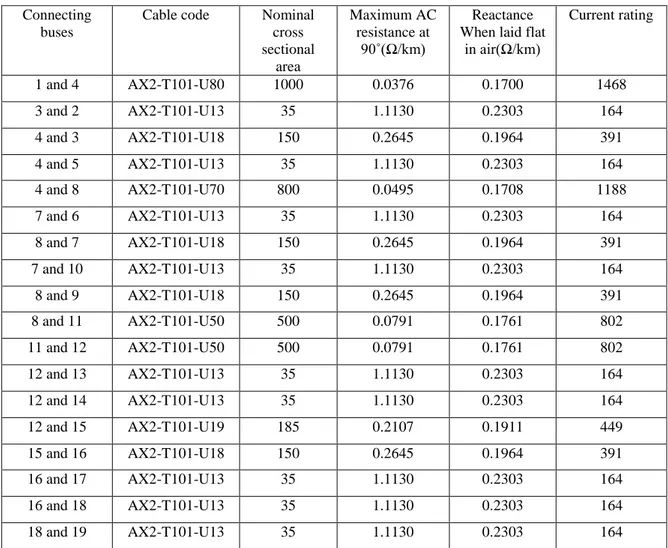
Single core Aluminum XLPE insulated PVC sheeted wires from Doha Cables were chosen for the grid. The cables will have different conductor cross-sectional area depending on the amount of current it needs to handle. The cables are overhead (to save cost) and laid flat
20
rather than trefoil, because this configuration allows for higher current rating. The cables chosen for the grid and their electrical characteristics are shown in Table 2. The data is available on [24].
Table 2: The cables chosen for the designed 19-node test grid and their technical data
Connecting buses
Cable code Nominal cross sectional area Maximum AC resistance at 90˚(Ω/km) Reactance When laid flat
in air(Ω/km) Current rating 1 and 4 AX2-T101-U80 1000 0.0376 0.1700 1468 3 and 2 AX2-T101-U13 35 1.1130 0.2303 164 4 and 3 AX2-T101-U18 150 0.2645 0.1964 391 4 and 5 AX2-T101-U13 35 1.1130 0.2303 164 4 and 8 AX2-T101-U70 800 0.0495 0.1708 1188 7 and 6 AX2-T101-U13 35 1.1130 0.2303 164 8 and 7 AX2-T101-U18 150 0.2645 0.1964 391 7 and 10 AX2-T101-U13 35 1.1130 0.2303 164 8 and 9 AX2-T101-U18 150 0.2645 0.1964 391 8 and 11 AX2-T101-U50 500 0.0791 0.1761 802 11 and 12 AX2-T101-U50 500 0.0791 0.1761 802 12 and 13 AX2-T101-U13 35 1.1130 0.2303 164 12 and 14 AX2-T101-U13 35 1.1130 0.2303 164 12 and 15 AX2-T101-U19 185 0.2107 0.1911 449 15 and 16 AX2-T101-U18 150 0.2645 0.1964 391 16 and 17 AX2-T101-U13 35 1.1130 0.2303 164 16 and 18 AX2-T101-U13 35 1.1130 0.2303 164 18 and 19 AX2-T101-U13 35 1.1130 0.2303 164
4.3 Al Qatraneh Distribution System
Al Qatraneh is a small Jordanian town, located 145 km south of Amman. The town belongs administratively to Karak Governorate. This area exhibits high levels of solar irradiance compared to the rest of Jordan, which makes the distribution system in that area very useful for this study.
Figure 9 represents the Qatraneh distribution system. The graph shows the line feeders, starting from the substation transformer, which has a nameplate rating of 15 MVA. The transformer, then, reduces the voltage from 132 kV to 33 kV, before sending the power over the main feeder to various loads. Each load is represented by a transformer (the little circles with the dot in them), and each transformer has a value that shows the number of
21
transformers (usually 1) and its rating in kVA (above the boxes). On each branch, there is a length value in meters and a letter or two representing the type of the line.
22
The bus voltage limit was set to 1.04 p.u., similar to the limit set for the 19-node test feeder. However, the Qatraneh grid is relatively old, and the transformer is not expected to be as tolerant to overloading as the Transformer used in The 19-Node Test Feeder. Therefore, a tighter limit of 150% of the transformer nameplate value was set, which is equal to 22.5 MVA.
4.4 Load profiles
The amount of power consumed in a distribution network fluctuates on diurnal and annual basis. Therefore, it would be more beneficial to study the behavior of the grid under different loading conditions. Additionally, the load will be measured as a percentage of the nameplate rating of the distribution transformer, in the interest of making the study as general as possible.
The first grid that has been simulated (The 19-Node Test Feeder) is a hypothetical grid that was designed for the benefit of this project. As a result, no actual daily load cycle for that particular grid exists. Also, the daily load cycle for the real grid studied in this project ( 4.3) was unavailable. This meant that simulating a real daily load cycle was not possible.
Nonetheless, it is possible to hypothesize a daily load cycle for the purposes of this study based on data obtained from other Jordanian distribution grids. In [25], Tawalbeh studied the hourly recorded power of an urban substation in the capital of Jordan. The paper presents the recorded daily load cycle of the substation for every month in 2008, during both holidays and working days. Since both the distribution system studied in [25] and the two distribution grids studied in this project are residential, with similar weather conditions and demographic characteristics, it is justifiable to assume they have similar DLCs. It is valid to use any of the curves presented in [25], but the data recorded during a normal working day in July was chosen for the project, as solar radiation reaches its peak in July [26]. The values will be transformed to per unit values, in order to adjust for the difference in nameplate values for the design substation, and the real Jordanian substation. See Figure 10.
23
Figure 10: Daily load profile for the designed feeder
The hosting capacity will be tested for three load scenarios: low load (50%), normal load (70%), and overload (120%). This choice was made to ensure that the methods for increasing hosting capacity tested in this project are valid for all loading scenarios.
In case of The 19-Node Test Feeder, the load will be uniformly spread out on all buses, in the sense that all buses consume the same amount of apparent power; whereas the consumption on each bus at the Al Qatraneh Distribution System will be proportional to the power rating of the transformer supplied by that bus. All loads will be assumed to have a power factor of 0.95 lagging.
24
5 Results
5.1 Initial hosting capacity of studied grids
The first step to increase the grids ability to accept DG penetration is to determine its initial hosting capacity before implementing any modifications. Since the methodology of determining the hosting proposed in the project is concerned with instantaneous PV penetration rather than penetration on a yearly timescale, it would be insufficient to only study the hosting capacity under just one load value. It is, therefore, important to study the general load profiles of the two distribution systems (if possible), in order to better understand which load values these systems are likely to experience.
5.1.1 Initial hosting capacity of the 19-Node Test Feeder
It is important to understand the voltage, power, and current profiles, in order to decide which limits are exceeded, and how to improve the design to increase that limit. The hosting capacity of the grid will be tested under the three load scenarios discussed in 4.4. The hosting capacity values are shown in Table 3.
Table 3: Hosting capacity of the 19-node test grid under three load scenarios.
Load value DER Power Apparent power fed back to the transformer Limit exceeded
50% 18.34 MW 13.35 MVA Voltage (1.04 P.U.) 70% 20.88 MW 14.24 MVA Voltage (1.04 P.U.)
120% 27.36MW 16.23MVA Current between buses 1 and 4
Apart from overvoltage, the power through the transformer exceeds the nameplate rating (10 MVA) in all three cases. This could decrease the life expectancy of the transformer, which is very costly. Therefore, it would be advisable to try to decrease the power going through the transformer in addition to reducing voltage level at the buses where overvoltage occurs.
5.1.2 Initial hosting capacity of the Qatraneh Grid
The same three loading scenarios were chosen to test the hosting capacity of the Qatraneh distribution system: 50%, 70% and 120%. Being the bus farthest away from the substation, he bus feeding transformer 33 will be chosen as the test bus. The hosting capacity of the grid for the three loading scenarios is presented in Table 4.
25
Table 4: The hosting capacities of the Qatraneh distribution system under three different load conditions
Load value DER Power Apparent power fed back to the transformer Limit exceeded
50% 22.19 MW 14.96MW Voltage (1.04 P.U.) 70% 26.92MW 16.95 MVA Voltage (1.04 P.U.)
120% 38.88MW 22.07MVA Voltage (1.04 P.U.)
5.2 Results of the three methods on the 19-Node test feeder
5.2.1 Effect of Inverter power factor control
The consumption of reactive power at the buses exhibiting high overvoltage levels will limit that overvoltage, but it will cause large currents through the cables. For that reason, the amount of reactive power generated, based on the power factor of the system, needs to be carefully selected and tuned: too much reactive power will overheat, or even damage, the cables; while too little reactive power will be inadequate in lowering the voltage.
Therefore, the effectiveness of reactive power control in increasing the capacity of the grid is dependent on the cables implemented and their ampacity. Without changing the cables, the maximum amount of DER possible is the amount of power that does not generate currents for the cables to handle. Table 5 shows the capacity of the grid without cable enforcement, setting the power factor to 0.97.
Table 5: Hosting capacities of the 19-Node test feeder with reactive power control under three load scenarios
Load value
DER Power
Apparent power fed back to the transformer
Limit exceeded
50% 21.138MW 16.17 MVA Current between buses 1 and 4
70% 22.94 MW 16.14MVA Current between busses 12 and 15
120% 26.11 MW 14.90MVA Current between busses 12 and 15
The capacity of the grid has slightly increased for 50 and 70 percent consumption, but decreased for 120 percent, due to the high levels of energy flowing through the cables. It seems that for reactive power control to be effective, we need to reinforce the cables, allowing them to tolerate higher current magnitudes. The results above also show that the introduction of capacitor banks would be unnecessary, since the main issue with DG penetration appears to be the overcurrent through cables and not transformer overloading. In addition to improving the current carrying capacity of the cables, reinforcement will decrease the impedance of the branches, because stronger cables have a larger cross-sectional
26
area, and smaller impedance. Lower impedance will have two direct benefits relevant to this purpose of this study: it both decreases the level of overvoltage and decrease the power losses in the distribution system.
5.2.2 Effect of Cables reinforcement and Capacitor Banks
The effectiveness of the method of reactive power control is in limiting overvoltage was examined in the Section Effect of Inverter power factor control 5.2.1. It was also shown how the
inability of the grid’s cables to handle high current levels limits the amount of PV penetration possible, resulting in a relatively low hosting capacity. So in order to reap the full benefits of reactive power control in increasing the grid’s hosting capacity, the grid’s ability to handle high levels of current needs to be improved. This is done by replacing the existing distribution cables with new cables that have a higher ampacity.
Nevertheless, not all cables reach their ampacity limit when reactive power control is used. It is, therefore, advisable to test the currents though all cables, in order to determine which one need to be changed, and which ones do not.
Running the simulation with different load levels, we can see that the branches undergoing the highest levels of current are the branches connecting buses: 1-4, 4-8, 8-11, 11-12, 12-15, and 15-16. These branches carry the power that feeds the other branches extending from the main feeder. Upgrading these branches will solve the issue of overcurrent.
The main branch connecting buses 1 and 4 will be replaced with single-core copper cables with a cross-sectional area of 1000 mm2, while the other branches will be replaced with single core aluminum branches with a cross-sectional area of 1000 mm2. The hosting capacity of the 19-Node test feeder was tested after reinforcing the grid’s cables, and without any reactive power control. The results show a significant increase in hosting capacity.
Reinforcing the cables had two main effects:
Stronger cables means that more current is now allowed to flow through the branches, solving the problem of overcurrent
The new thicker cables had a significantly lower resistance values. This drastically reduced the amount of voltage rise at the buses, solving the problem of overvoltage.
Nonetheless, this leaves the issue of overloading the substation transformer. Because the introduction of capacitor banks will decrease the apparent power at the transformer, it is a good design modification to make. The hosting capacity of the grid at different load levels after reinforcing the cables and implementing capacitor banks is shown in Table 6.
27
Table 6: Hosting capacity of the 19-Node Test Feeder with capacitor banks and cable reinforcement
Load value
DER Power
Apparent power fed back to the transformer
Limit exceeded Percentage increase in hosting capacity 50% 25.03MW 20 MVA Power at substation
transformer
36.48%
70% 26.93 MW 20 MVA Power at substation transformer
28.98%
120% 31.58 MW 20 MVA Power at substation transformer
15.42%
5.3 Results of the three methods on the Qatraneh distribution
system
It is worth mentioning that when a regular power flow simulation was run on the Qatraneh grid, the current rating of several cables were exceeded, even before injecting any power into the grid. This phenomenon was present at load levels equal to 63% of the transformer rating or higher. A probable explanation for this is that the transformers were intentionally oversized as precautionary design decision, because electricity demand is constantly increasing. Oversized transformers mean that there would be no need for transformer replacement in the near future to compensate for the increased load. Such a decision would make sense economically, because replacing the cables is much cheaper and easier than replacing the transformers.
This means that the grid is running either under much lower load values than expected in the study, or it runs on the predicted loads but some of the cables were reinforced. The first case is of no interest for this project, because if the grid was running on less that its full capacity, there would be no need to increase its capacity; the capacity of the grid has not been exhausted yet.
As a result, the second case will be assumed: the grid is running on full capacity but with some of the main branches reinforced. In this case, it is justifiable to ignore the current limit through the branches, because the branches would have been already reinforced to account for the increased loads. Even though the reinforcement of some cables would decrease their resistance, this effect could be neglected for two reasons. Firstly, reinforcing the cables will mostly decrease the cable resistance (𝑅), and not the reactance (𝑋), see equation (6). The Qatraneh grid has a high 𝑋/𝑅 ratio, which means that the main cause of the voltage rise is the series reactance rather than the resistance. As a consequence, decreasing 𝑅 would not have a great influence on the voltage values. Second, the Qatraneh grid has 73 branches, only a few of which would need reinforcement (5 in case of 120% load). Therefore, these two reasons make the effect of reinforcement negligible.
28
5.3.1 Effect of Inverter power factor control
Solar matching of PV reactive power version of the PV inverter power factor control was tested on the Qatraneh test feeder. The power factor at the PV inverters was set at 0.97. A simulation was run on the Qatraneh Model, the voltage being measured is the voltage at bus supplying transformer number 33, see Figure 9 . Table 7 presents the improvement on the hosting capacity of the Qatraneh grid:
Table 7: Hosting capacity of the Qatraneh distribution system with reactive power control
Load value
DER Power
Apparent power fed back to the transformer
Limit exceeded Percentage increase in hosting capacity 50% 28.74MW 20.93 MVA Bus voltage 29.52%
70% 33.14MW 22.50 MVA Power at substation transformer
23.11%
120% 31.58 MW 20.00 MVA Power at substation transformer
2.19%
From Table 7, we can see that consuming reactive power by the PV inverters is effective in decreasing overvoltage, which can be deduced when considering the case of 50% load. But there is still a need to decrease apparent power at the substation. Therefore, capacitor banks were introduced to assess inverter power factor control in increasing the grids hosting capacity, especially for high consumption levels.
5.3.2 Effects of Capacitor Banks in addition to of Inverter power
factor control
This section shows the results of using both inverter power factor control and capacitor banks. The collective effect of combining the methods for reactive power control is shown in Table 8.
Table 8: Hosting capacity of the Qatraneh distribution system with reactive power control and Capacitor Banks
Load value
DER Power
Apparent power fed back to the transformer
Limit exceeded Percentage increase in hosting capacity 50% 28.74MW 20.93 MVA Bus voltage 29.52%
70% 33.64MW 22.50 MVA Power at substation transformer
25.00%
120% 40.57 MW 22.50 MVA Power at substation transformer
29
6 Discussion
6.1 Analysis of the results
The results shown in 5 indicate that different methods are more effective than others for certain distribution networks. Cable reinforcement proved to be sufficient to increase the capacity of The 19-Node Test Feeder, whereas reactive power control was sufficient in case of the Al Qatraneh Distribution System. In addition, the introduction of capacitor banks was useful in both cases, as it decreases the load on the substation transformer. The purpose of this chapter is to explain why different methods are more effective than others, and what factors play a role in deciding which method is most suitable for a certain distribution system. The main factor in deciding which method is most suitable was how effective each method is in reducing overvoltage. Therefore, in ordered to explain how different methods give different results depending on the distribution system, it is important to refer back to the basic theory that governs the amount voltage rise at different buses, in particular, equation (6):
𝛥𝑈 ≅ 𝑃. 𝑅 + 𝑄. 𝑋 |𝑈𝑛|
To emphasize the effect of each variable, the equation is expanded to:
𝛥𝑈 ≅ 𝑃. 𝑅 |𝑈𝑛|
+𝑄. 𝑋 |𝑈𝑛|
(7) In this form, and by overlook the effect of the common variable |𝑈𝑛|, it is clear that two main terms determine the amount of voltage rise at the bus: 𝑃. 𝑅 and 𝑄. 𝑋. Hereby, choosing the most suitable method depends on which one of these terms is dominant. The ratio of 𝑄/𝑃 is a function of the load power factor, which is varying value that is independent of the distribution system. This means that 𝑄/𝑃 is not a good indicator for deciding which method to use, unless the power factor of the load is highly consistent and predictable.
This leaves us with the ratio 𝑋/𝑅, which is a constant value that depends on the distribution system’s characteristics. If the value of this ratio was great, it would mean that the dominant term is 𝑄. 𝑋. This indicates that controlling the reactive power would be sufficient in limiting overvoltage, as is the case with the Qatraneh distribution system.
On the other hand, if the value of 𝑋/𝑅 was small, then the contribution of the term 𝑄. 𝑋 would not be noteworthy, resulting in reactive power control being insufficient in limiting overvoltage. In this case, 𝑃. 𝑅 would be the main factor in determining the value of overvoltage, and decreasing overvoltage would be done by decreasing this term. This could be done either by reducing the value of 𝑅 using cable reinforcement, or by decreasing the amount of power (𝑃) injecting into the system, either with batteries or with reactive power curtailment.
30
6.2 Solar matching of reactive power
This project introduced a modification to the method of reactive power control using a constant power factor (Section 3.2.1) referred to as solar matching of reactive power. This section is intended to highlight this idea and further analyze it.
The main aim of introducing this method is to compensate for the reactive power consumer in the PV inverters which suffer from voltage rise by generating equal amounts of reactive power at the other PV s in the distribution system. The use of other PV inverters to generate reactive power has the benefit of matching the amount of reactive power generated to the amount consumed without any complex controllers or remote communication systems. The basic premise is the assumption that solar irradiance is similar within the area of distribution systems. Because solar irradiance is similar within the system, knowing the PV generation is one area enables us to predict PV generation in another part of the system. The power factor in different PV investors will be set such that equal amount of reactive power is generated and consumed. The power factors should be decided in advance by engineers who plan the implementation of reactive power control. Whether the power factors at each inverter are set to lag or to lead, or the exact value of the power factors to choose, would depend on the expected voltage at the bus when PV penetration is introduced.
The downside to the method is that it would lead to higher amounts of reactive power flowing through the grid, leading to higher currents and power losses. Nonetheless, generating reactive power within the distribution system releases the substation transformer from the burden of moving reactive power from the transmission side to the distribution side.
31
7 Conclusions
The introduction of high amounts PV power to distribution grids could lead to undesirable and possibly dangerous effects on the grid. It is, thus, vitally important to introduce some modifications to distribution systems that would enable it to handle the excessive amount of power generated locally.
The number one concern, when it comes to distributed generation, is overvoltage. Exceeding the nominal voltage level by a big margin could have fatal effects on electrical equipment, costing huge amounts of money. Over the years, many methods have been developed to decrease the level of overvoltage caused by excessive amounts of power injected into the distribution system. The purpose of this project was to first develop a method for determining the hosting capacity of distribution networks, and, second, to determine which methods are most effective when tested on different distribution networks.
Firstly, a deterministic model was developed for measuring the hosting capacity of distribution systems caused by an instantaneous amount of distributed power injected into the system.
Then that model was implemented to test the capacity of two radial grids. The first grid is a 19-node test feeder that was designed to resemble 11 kV distribution systems in Jordan. The second grid is a 33 kV 73-node distribution system located at Al Qatraneh in the south of Jordan. The two grids had many differences. Therefore, trying different methods of increasing hosting capacity on these two grids would give an insight on how to determine which method of improving the capacity to try on different grids.
Two main capacity-enhancing methods were tested: reactive power control and cable reinforcement. Reactive power control was done by changing the power factor in the PV s. The aim was to consume reactive power at the buses suffering from overvoltage. And to compensate for the reactive power consumed by the inverters suffering from overvoltage, the other investors were set to generate reactive power. The method proved to be highly effective in reducing the magnitude of the voltage in the Qatraneh grid. However, when it was tried on the 19-Node test feeder, overcurrent limited the effectiveness of the method, because high amounts of active and reactive power were flowing through the cables, the current through branches exceeded the rating.
Consequently, some cables in the 19-Node distribution feeder needed to be upgraded. Higher current carrying capacity requires cables with higher cross-sectional are. As a consequence, these upgraded cables naturally had much better series resistance, which improved the voltage profile of the network. This method was sufficient on its own in increasing the hosting capacity of the grid.
In both cases, capacitor banks were implemented, in order to generate the reactive power consumed by the system locally. This reduced the amount of apparent power going through
32
the distribution substation. This reduction in apparent power will improve the life expectancy of the substation transformer.
Finally, the results mentioned above were analyzed. A conclusion was reached that the deciding which method is most successful for each grid depends on the ratio X/R. Distribution systems with high X/R ratio would benefit more from reactive power control, while systems with low X/R ratio would benefit more from cable reinforcement or power curtailment.
References
[1] “Sunny uplands | The Economist.” [Online]. Available:
http://www.economist.com/news/21566414-alternative-energy-will-no-longer-be-alternative-sunny-uplands. [Accessed: 25-May-2015].
[2] N. Etherden and M. H. Bollen, “Increasing the hosting capacity of distribution networks by curtailment of renewable energy resources,” in PowerTech, 2011 IEEE Trondheim, 2011, pp. 1–7.
[3] T. Degner, G. Arnold, T. Reimann, B. Engel, M. Breede, and P. Strauss, “Increasing the photovoltaic-system hosting capacity of low voltage distribution networks,” in
Proceedings of 21st International Conference on Electricity Distribution, 2011, pp. 1243–1246.
[4] J. A. P. Lopes, N. Hatziargyriou, J. Mutale, P. Djapic, and N. Jenkins, “Integrating distributed generation into electric power systems: A review of drivers, challenges and opportunities,” Electr. Power Syst. Res., vol. 77, no. 9, pp. 1189–1203, Jul. 2007. [5] P. Jahangiri and D. C. Aliprantis, “Distributed Volt/VAr Control by PV Inverters,”
IEEE Trans. Power Syst., vol. 28, no. 3, pp. 3429–3439, Aug. 2013. [6] N. Jenkins and I. of E. Engineers, Embedded Generation. IET, 2000.
[7] N. E. M. Association and A. N. S. Institute, American National Standard: Criteria for Safety Symbols. National Electrical Manufacturers Association, 2002.
[8] Jordanian National Electric Power Company, NEPCO Transmission Code. Amman, Jordan, 2009.
[9] T. Stetz, F. Marten, and M. Braun, “Improved Low Voltage Grid-Integration of
Photovoltaic Systems in Germany,” IEEE Trans. Sustain. Energy, vol. 4, no. 2, pp. 534– 542, Apr. 2013.
[10] A. Elektrische, E. En, and K. D. Brabandere, VOLTAGE AND FREQUENCY DROOP CONTROL IN LOW VOLTAGE GRIDS BY DISTRIBUTED GENERATORS WITH INVERTER FRONT-END Jury:. 2006.
[11] Jordanian National Electric Power Company, “NEPCO Annual report,” Amman, Jordan, 2013.
[12] A. Al Tarabsheh and M. Ababne, “Analysis of solar radiation in Jordan,” Editor. BOARD, vol. 4, no. 6, p. 733, 2010.
[13] M. A. Momani, “Factors Affecting Electricity Demand in Jordan,” Energy Power Eng., vol. 05, no. 01, pp. 50–58, 2013.
[14] “National Electric Power Company, Annual Report 2013, Amman, Jordan. .pdf.” . [15] T. Stetz, “Autonomous Voltage Control Strategies in Distribution Grids with
Photovoltaic Systems - Technical and Economic Assessment,” 2013.
[16] J. J. Grainger and W. D. Stevenson, Power system analysis. New York: McGraw-Hill, 1994.
[17] R. D. Zimmerman and C. E. Murillo-Sánchez, “MATPOWER 4.1 User’s Manual,” Power Syst. Eng. Res. Cent. Cornell Univ. Ithaca NY, 2011.
[18] M. Braun, T. Stetz, T. Reimann, B. Valov, and G. Arnold, “Optimal reactive power supply in distribution networks-technological and economic assessment for PV-systems,” in European Photovoltaic Solar Energy Conference (EU PVSEC 2009), Hamburg (Germany), 2009.
![Figure 1: The annual maximum DLC for summer and winter of 2000 and 2007 [13]](https://thumb-eu.123doks.com/thumbv2/5dokorg/5497024.143155/10.892.124.781.348.710/figure-annual-maximum-dlc-summer-winter.webp)
![Figure 2: Monthly midday and evening peak consumption for 2000 and 2007 [13]](https://thumb-eu.123doks.com/thumbv2/5dokorg/5497024.143155/11.892.140.755.119.526/figure-monthly-midday-evening-peak-consumption.webp)
![Figure 6: One line diagram of the 11-node test feeder [22]](https://thumb-eu.123doks.com/thumbv2/5dokorg/5497024.143155/23.892.284.629.538.847/figure-line-diagram-node-test-feeder.webp)